Copyright
©2013 Baishideng Publishing Group Co.
World J Cardiol. Nov 26, 2013; 5(11): 426-433
Published online Nov 26, 2013. doi: 10.4330/wjc.v5.i11.426
Published online Nov 26, 2013. doi: 10.4330/wjc.v5.i11.426
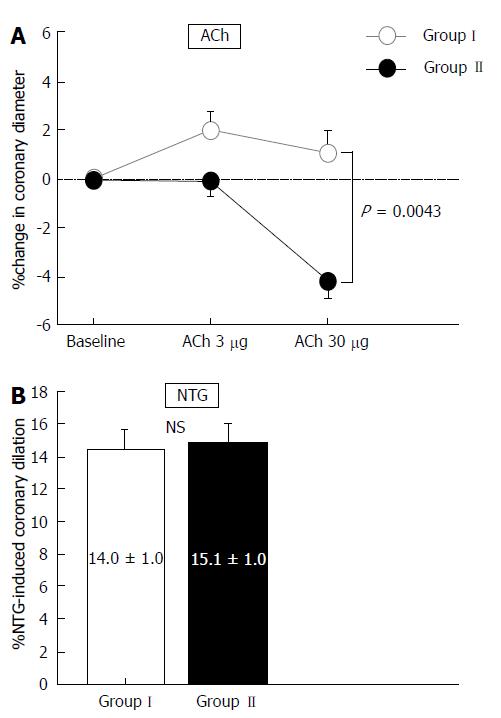
Figure 1 Percentage changes in epicardial coronary artery diameter in response to acetylcholine infusion and nitroglycerin in Groups I and II.
A: Greater changes in coronary artery diameter in response to acetylcholine infusion were observed in Group I (open circles) compared with Group II (black circles); B: Nitroglycerin-induced coronary dilation was similar between Groups I and II. Vertical bars represent SEM. ACh: Acetylcholine; NS: Not significant; NTG: Nitroglycerin.
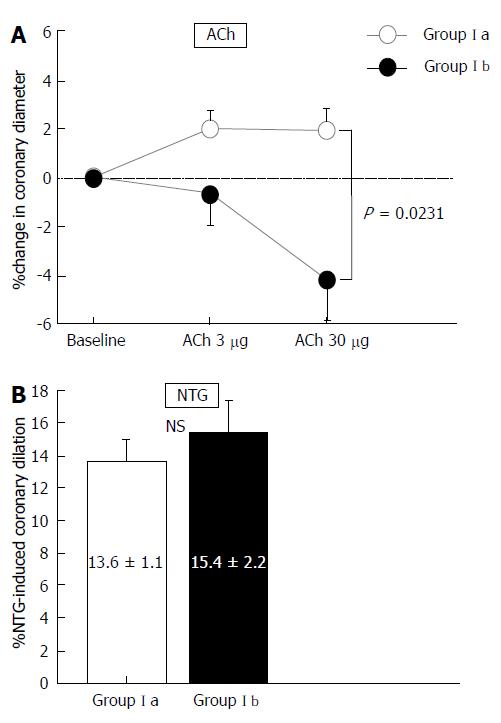
Figure 2 Percentage changes in epicardial coronary artery diameter in response to acetylcholine infusion and nitroglycerin in Groups Ia and Ib.
A: Greater changes in coronary artery diameter in response to acetylcholine (ACh infusion were observed in Group Ia (open circles) than those in Group Ib (gray circles); B: Nitroglycerin -induced coronary dilation was similar between Groups Ia and Ib. Vertical bars represent SEM. ACh: Acetylcholine; NTG: Nitroglycerin; NS: Not significant.
- Citation: Teragawa H, Mitsuba N, Ishibashi K, Kurisu S, Kihara Y. Positive influence of aspirin on coronary endothelial function: Importance of the dose. World J Cardiol 2013; 5(11): 426-433
- URL: https://www.wjgnet.com/1949-8462/full/v5/i11/426.htm
- DOI: https://dx.doi.org/10.4330/wjc.v5.i11.426


