Copyright
©2012 Baishideng Publishing Group Co.
World J Cardiol. Dec 26, 2012; 4(12): 341-346
Published online Dec 26, 2012. doi: 10.4330/wjc.v4.i12.341
Published online Dec 26, 2012. doi: 10.4330/wjc.v4.i12.341
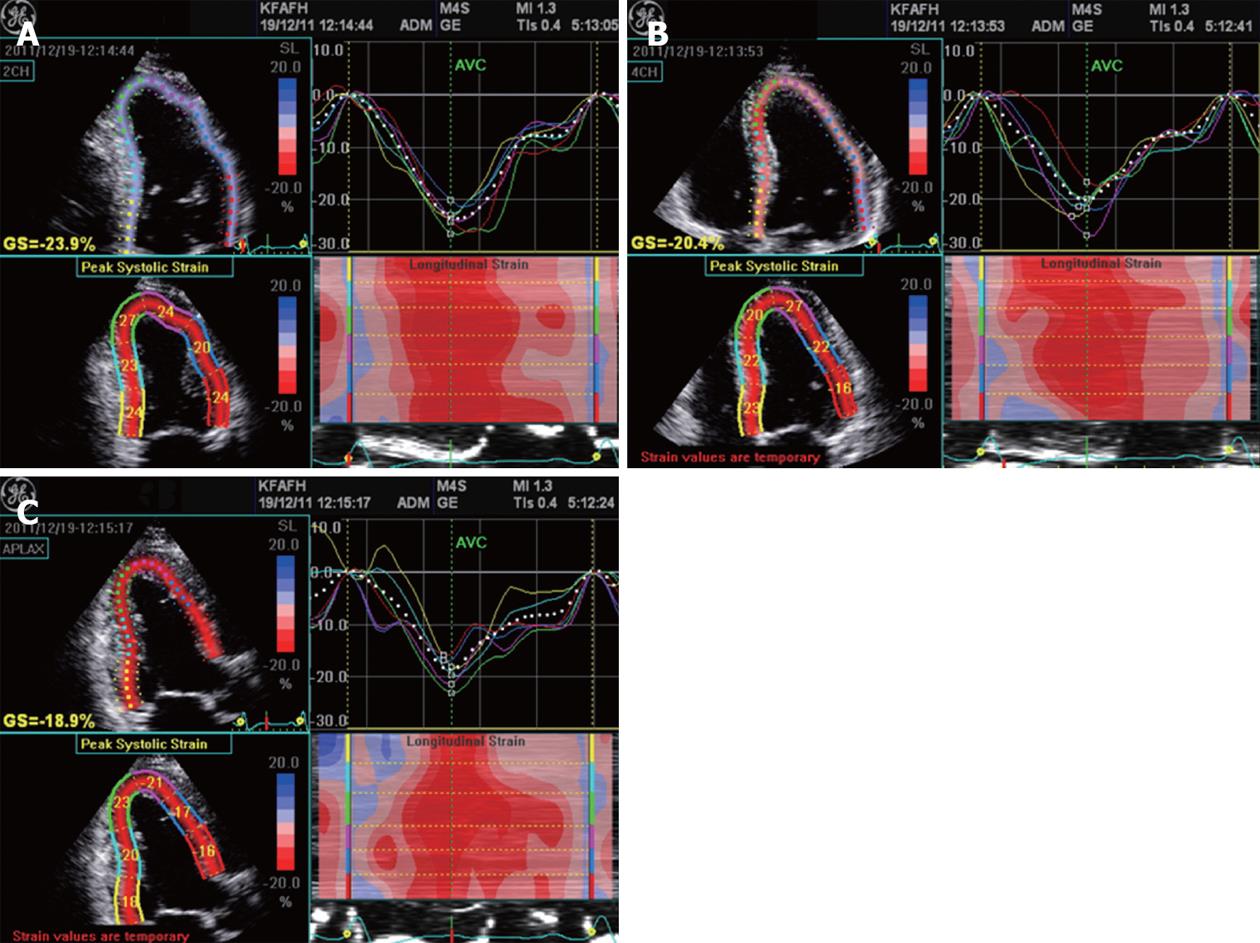
Figure 1 Segmental longitudinal strain displayed in 3 image planes.
A: Apical 4-chamber; B: Apical 2-chamber; C: Apical long axis views.
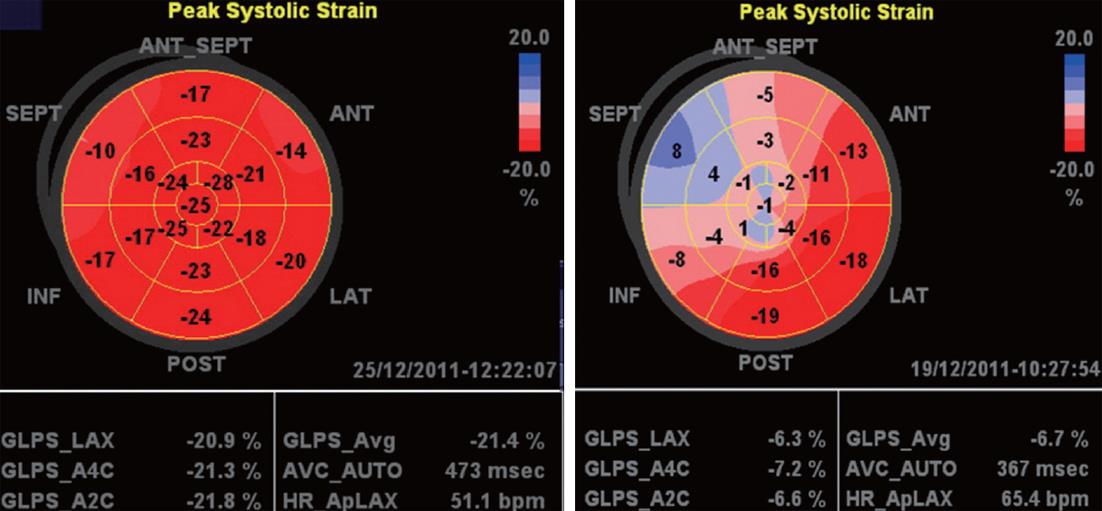
Figure 2 Measurements of longitudinal strain in all 17 left ventricle segments represented in bull’s eye map in normal (right) and abnormal (left) subjects.
- Citation: Anwar AM. Global and segmental myocardial deformation by 2D speckle tracking compared to visual assessment. World J Cardiol 2012; 4(12): 341-346
- URL: https://www.wjgnet.com/1949-8462/full/v4/i12/341.htm
- DOI: https://dx.doi.org/10.4330/wjc.v4.i12.341


