Copyright
©The Author(s) 2024.
World J Cardiol. Jan 26, 2024; 16(1): 40-48
Published online Jan 26, 2024. doi: 10.4330/wjc.v16.i1.40
Published online Jan 26, 2024. doi: 10.4330/wjc.v16.i1.40
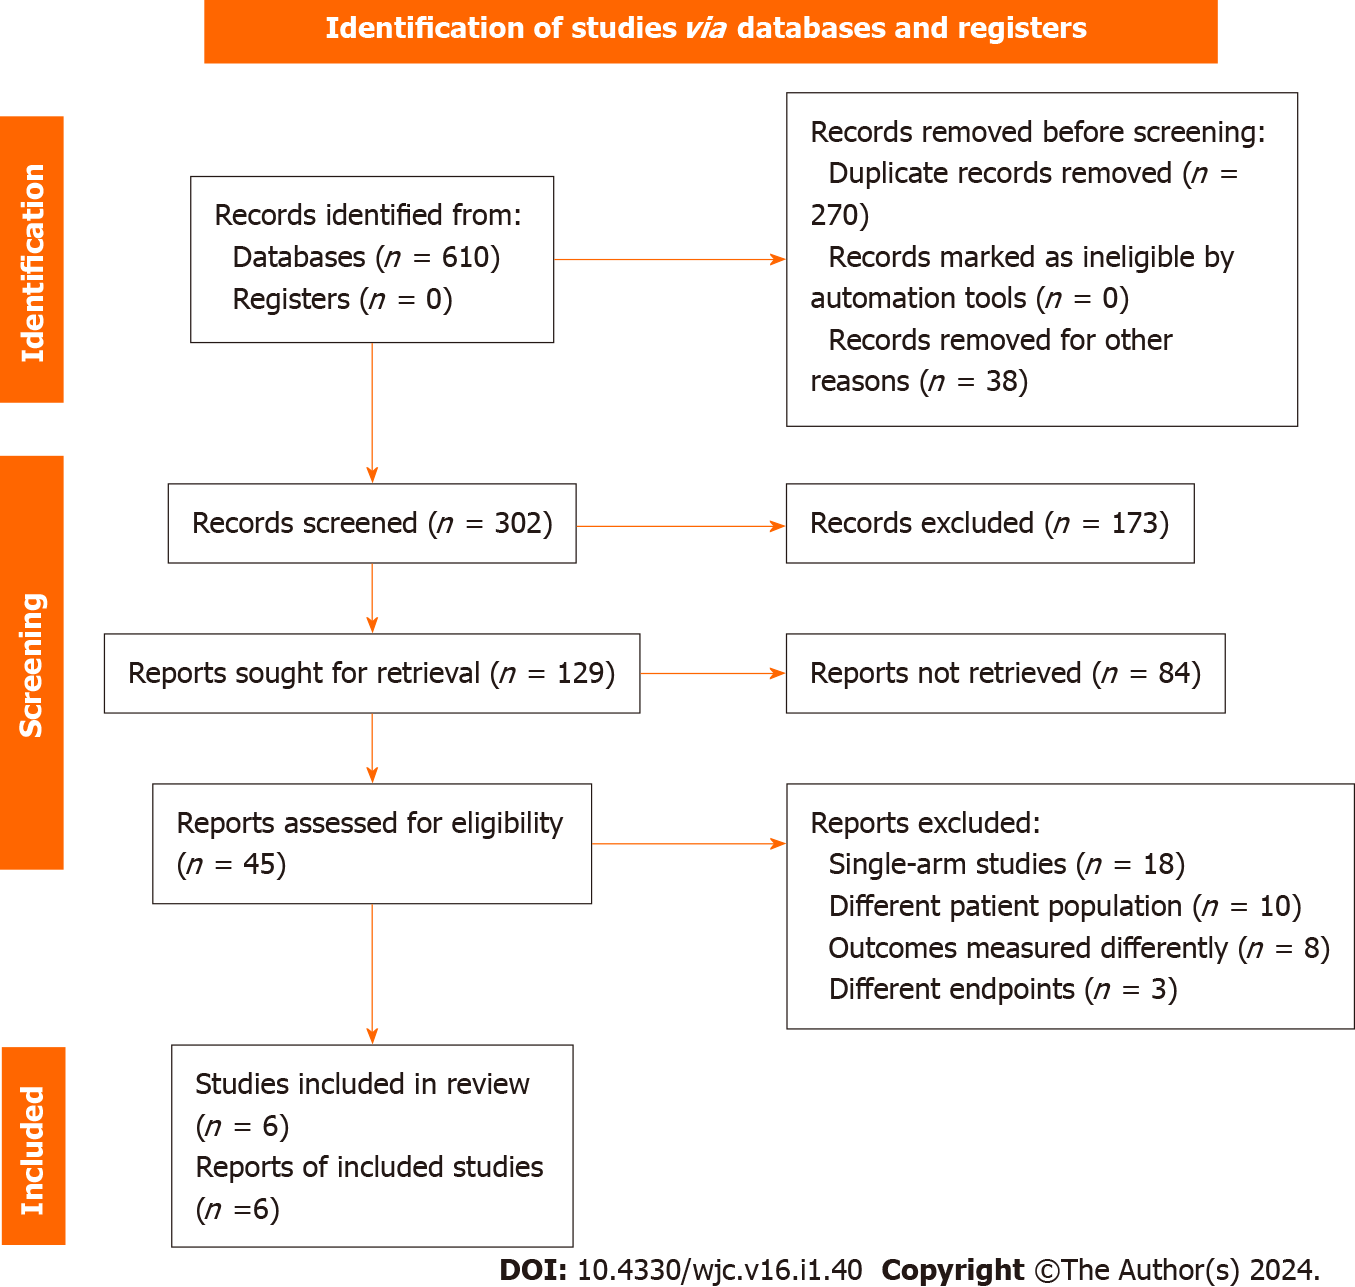
Figure 1 PRISMA flowchart.
Figure 2 Forest plot comparing paced QRS duration between left bundle branch pacing and biventricular pacing groups.
95%CI: 95% confidence interval; LBBP: Left bundle branch pacing; BiVP: Biventricular pacing.
Figure 3 Forest plot comparing pacing threshold at follow-up between left bundle branch pacing and biventricular pacing groups.
95%CI: 95% confidence interval; LBBP: Left bundle branch pacing; BiVP: Biventricular pacing.
Figure 4 Forest plot comparing paced left ventricular ejection fraction between left bundle branch pacing and biventricular pacing groups.
95%CI: 95% confidence interval; LBBP: Left bundle branch pacing; BiVP: Biventricular pacing.
Figure 5 Forest plot comparing paced left ventricular end-diastolic diameter between left bundle branch pacing and biventricular pacing groups.
95%CI: 95% confidence interval; LBBP: Left bundle branch pacing; BiVP: Biventricular pacing.
Figure 6 Forest plot comparing paced left ventricular end-systolic diameter between left bundle branch pacing and biventricular pacing groups.
95%CI: 95% confidence interval; LBBP: Left bundle branch pacing; BiVP: Biventricular pacing.
Figure 7 Forest plot comparing New York Heart Association classification between left bundle branch pacing and biventricular pacing groups.
95%CI: 95% confidence interval; LBBP: Left bundle branch pacing; BiVP: Biventricular pacing.
Figure 8 Forest plot comparing B-type natriuretic peptide levels between left bundle branch pacing and biventricular pacing groups.
95%CI: 95% confidence interval; LBBP: Left bundle branch pacing; BiVP: Biventricular pacing.
- Citation: Yasmin F, Moeed A, Ochani RK, Raheel H, Awan MAE, Liaquat A, Saleem A, Aamir M, Hawwa N, Surani S. Left bundle branch pacing vs biventricular pacing in heart failure patients with left bundle branch block: A systematic review and meta-analysis. World J Cardiol 2024; 16(1): 40-48
- URL: https://www.wjgnet.com/1949-8462/full/v16/i1/40.htm
- DOI: https://dx.doi.org/10.4330/wjc.v16.i1.40


