Copyright
©The Author(s) 2022.
World J Cardiol. May 26, 2022; 14(5): 282-296
Published online May 26, 2022. doi: 10.4330/wjc.v14.i5.282
Published online May 26, 2022. doi: 10.4330/wjc.v14.i5.282
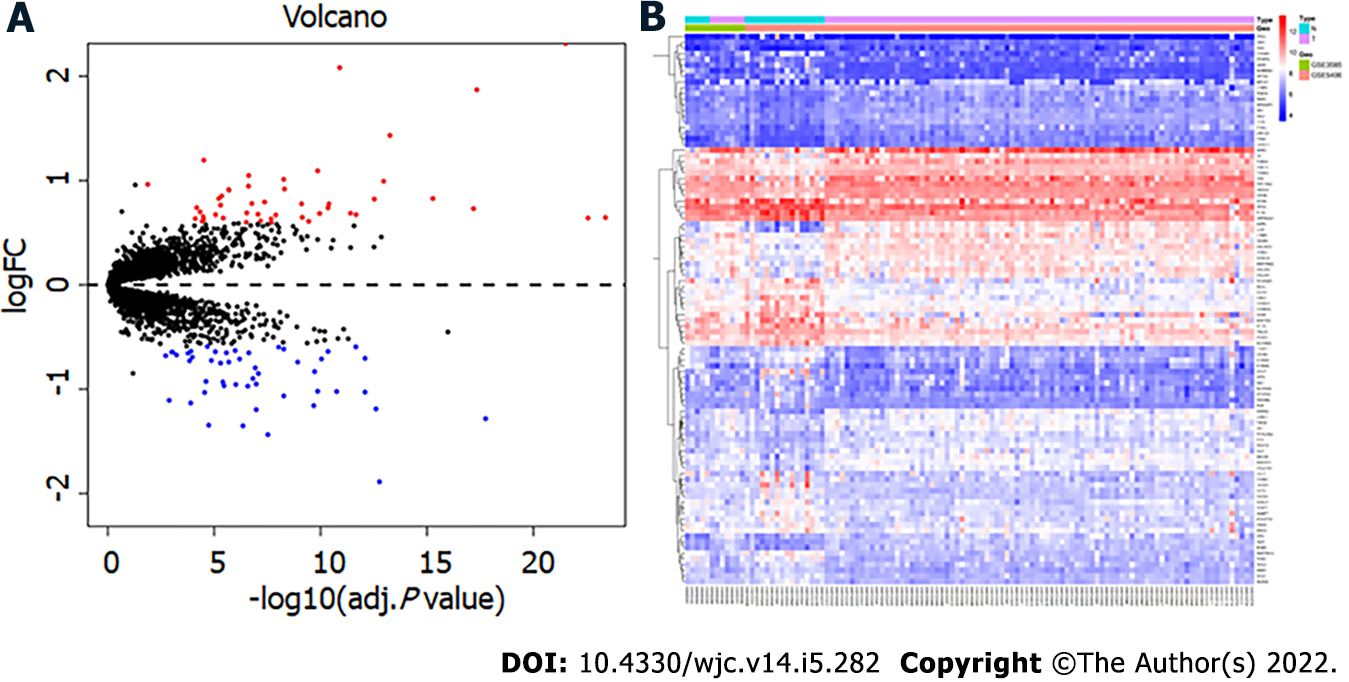
Figure 1 Identification of differentially expressed genes.
A: Volcano map, in which the red node represents the upregulated differentially expressed genes (DEGs) and the blue node represents the downregulated DEGs; B: Heatmap of DEGs.
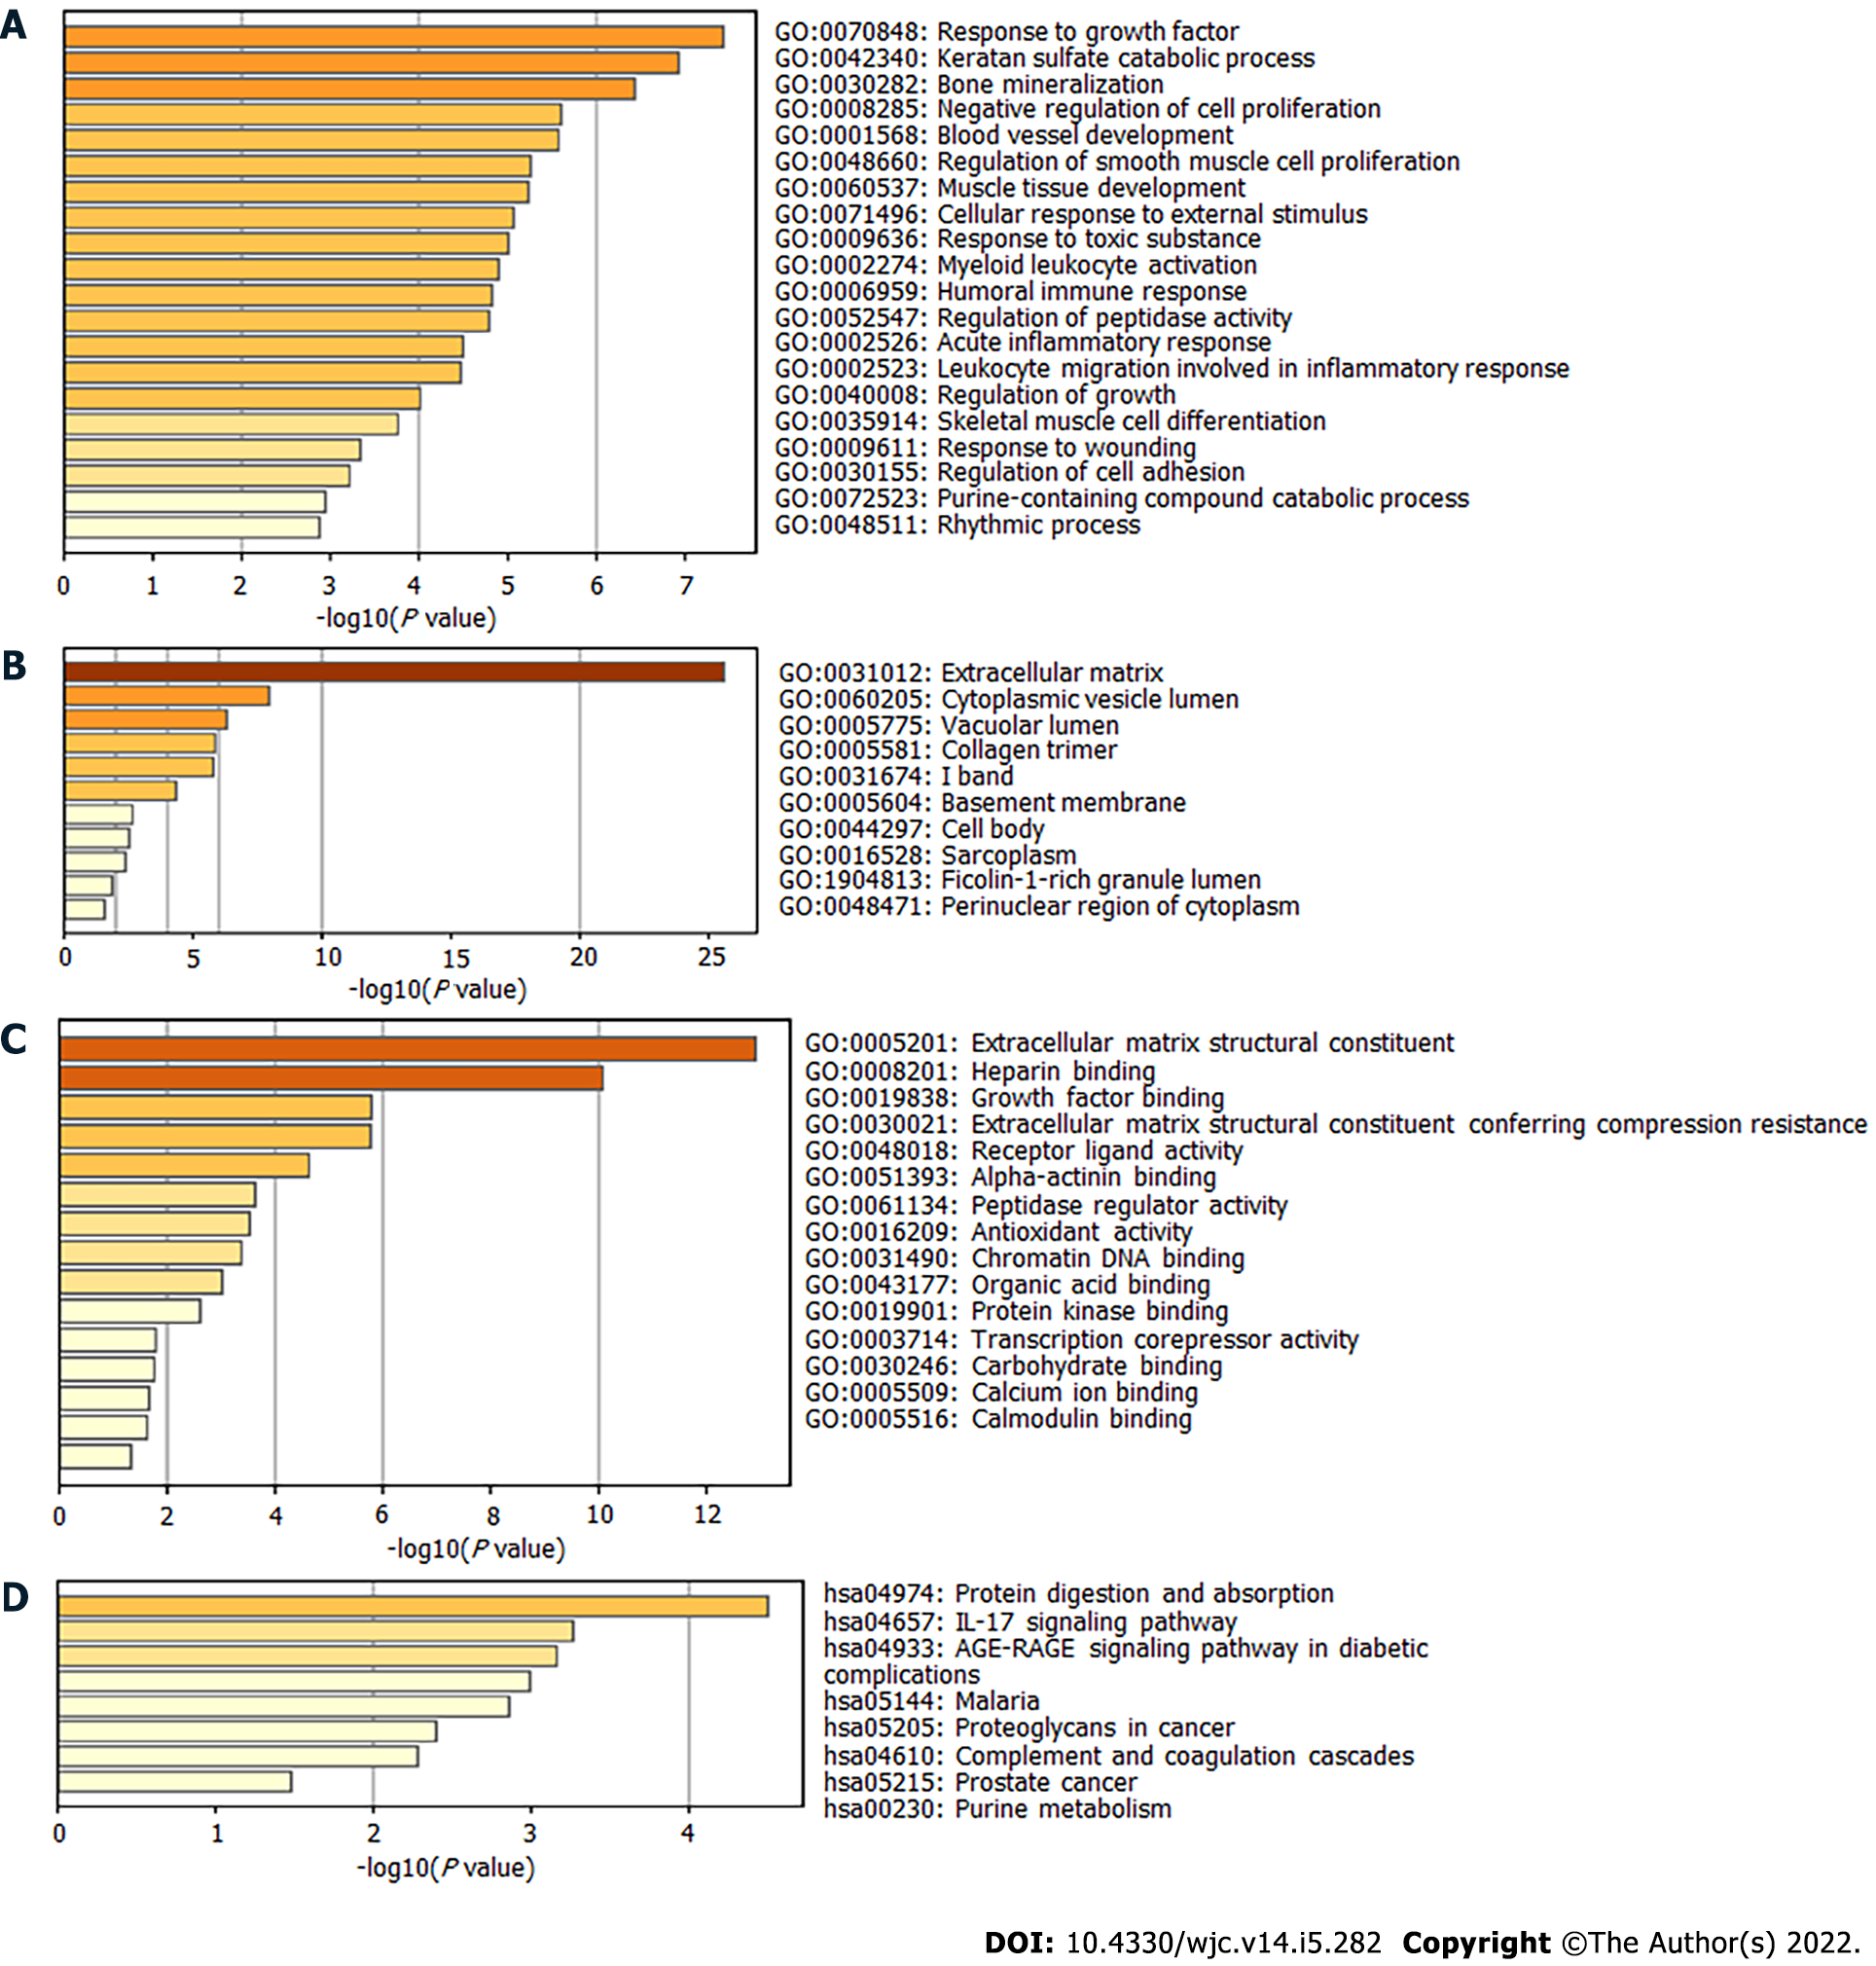
Figure 2 Gene Ontology and Kyoto Encyclopedia of Genes and Genomes analysis of enrichment for differentially expressed genes.
A: Biological process; B: Cellular component; C: Molecular function; D: Kyoto Encyclopedia of Genes and Genomes.
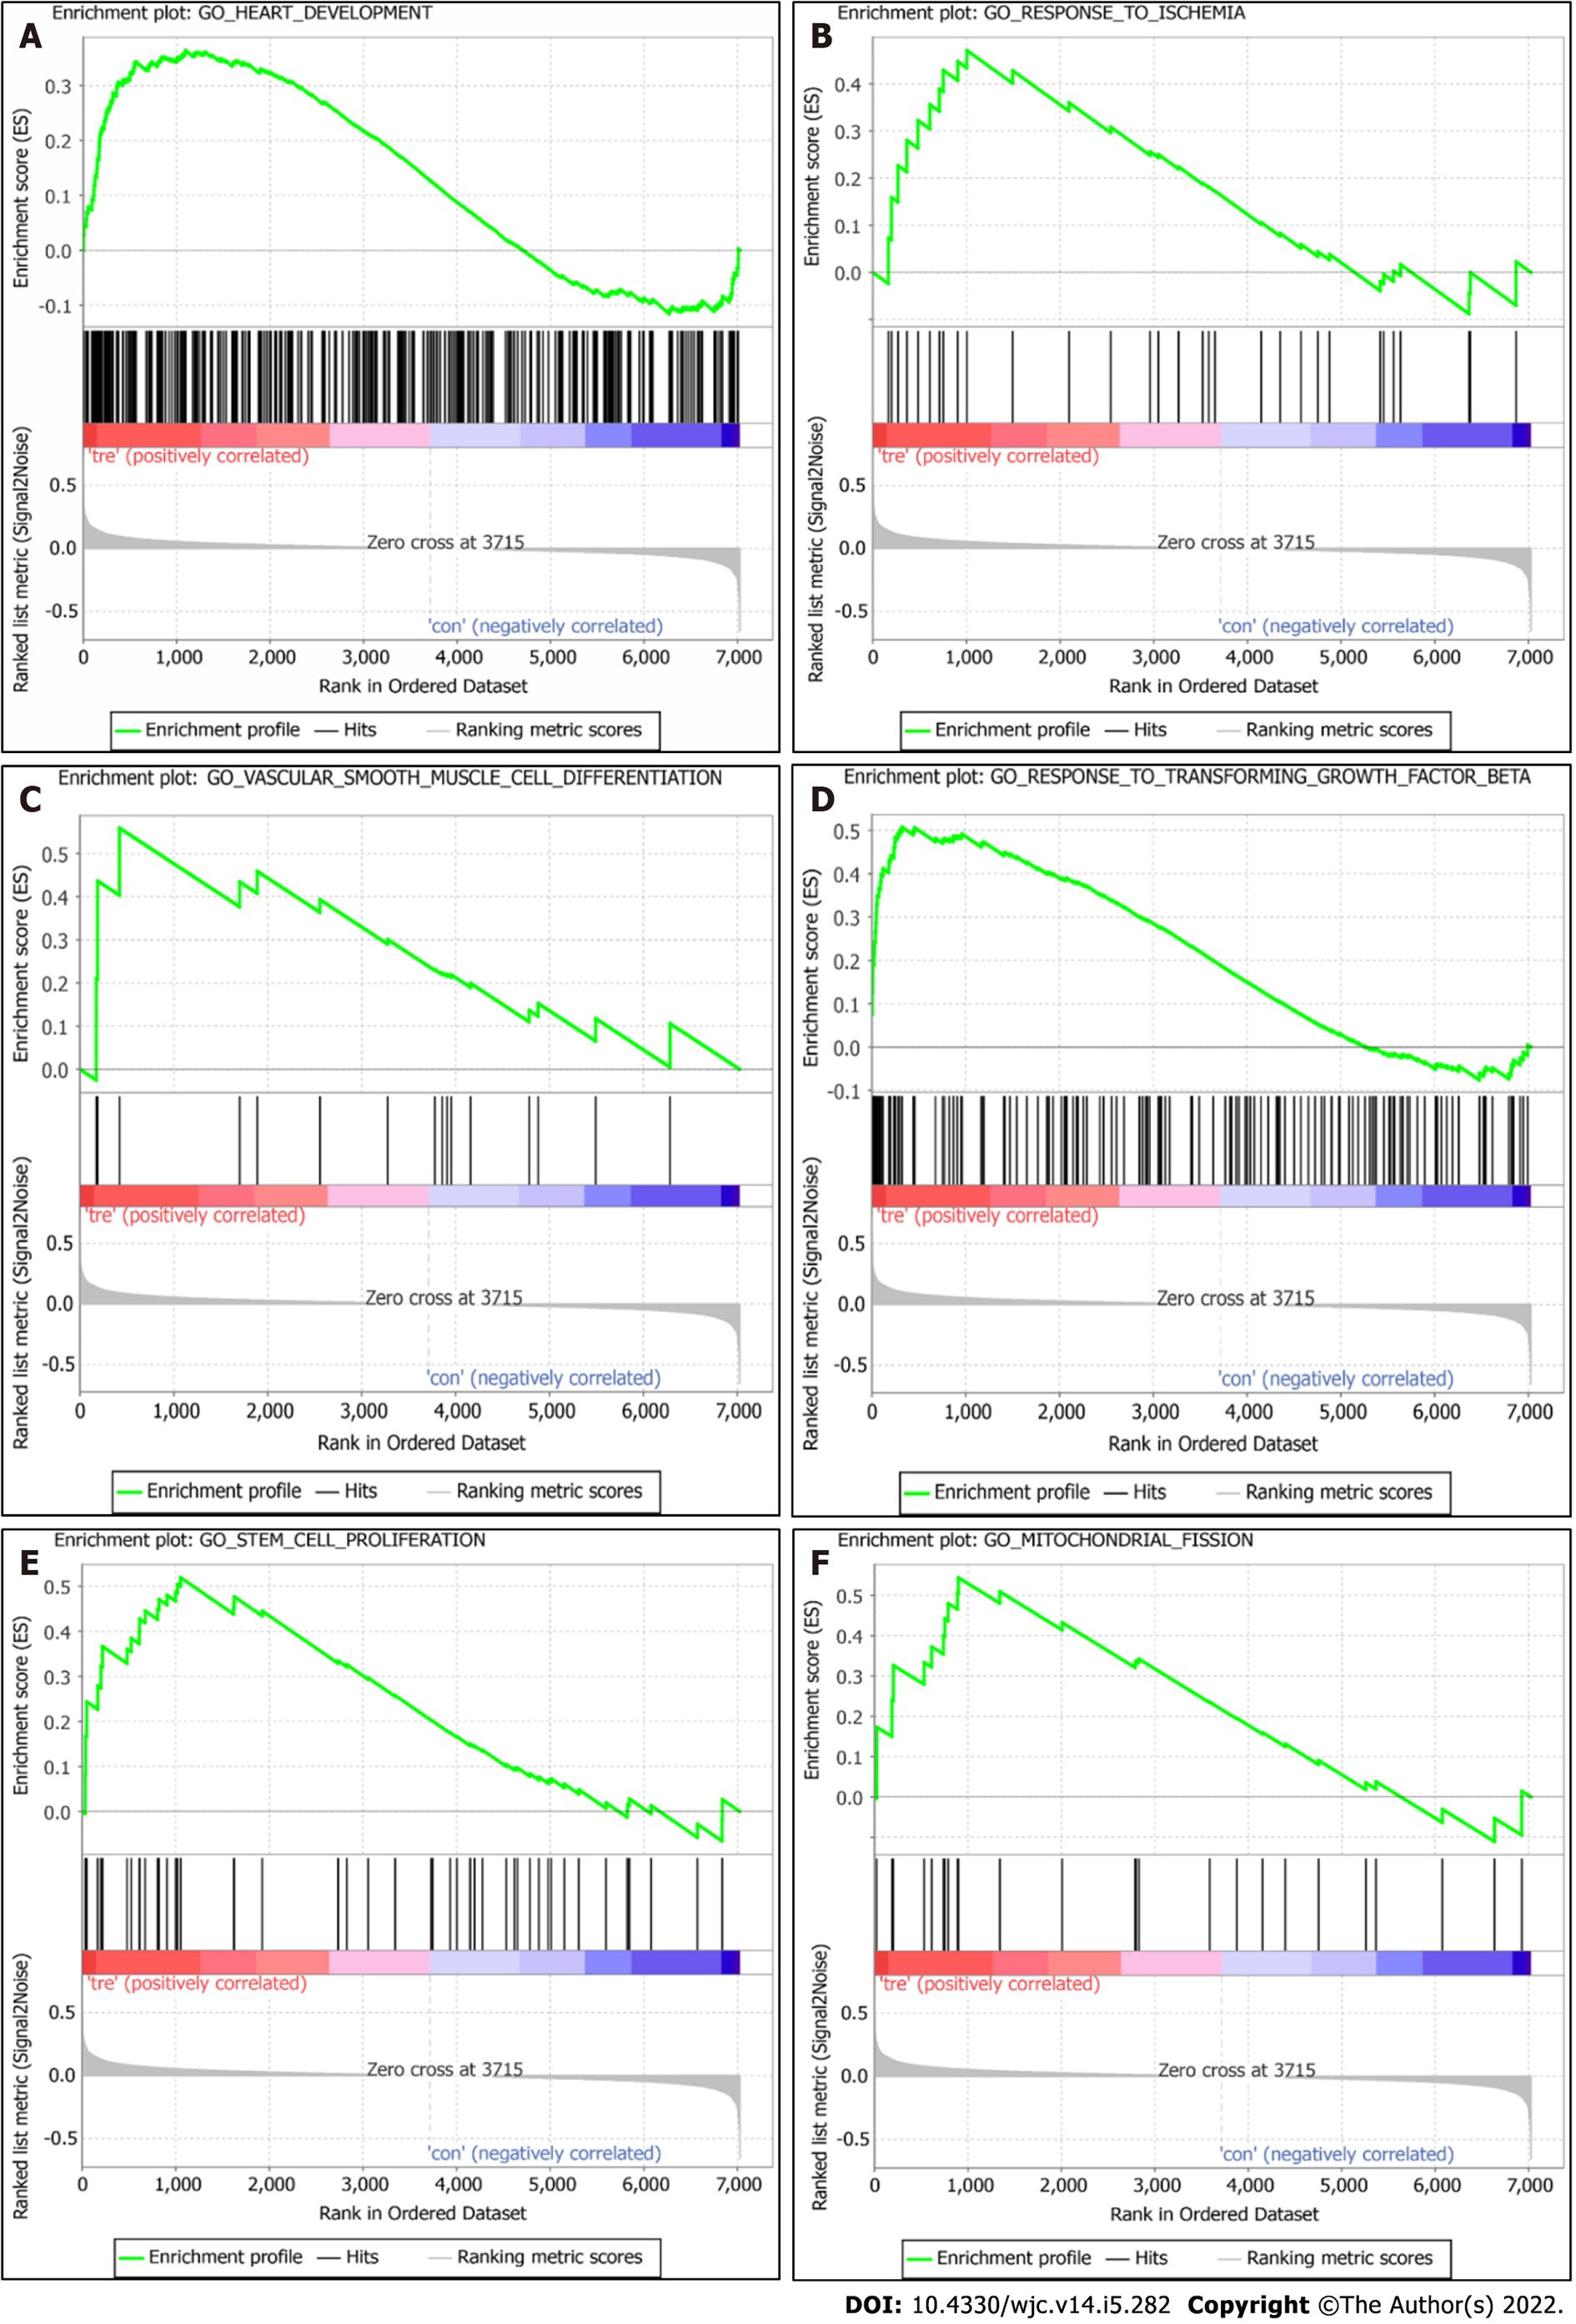
Figure 3 Gene set enrichment analyses of enrichment of differentially expressed genes.
A: Heart development; B: Response to ischemia; C: Vascular smooth muscle cell differentiation; D: Response to transforming growth factor beta; E: Stem cell proliferation; F: Regulation of mitochondrial fission.
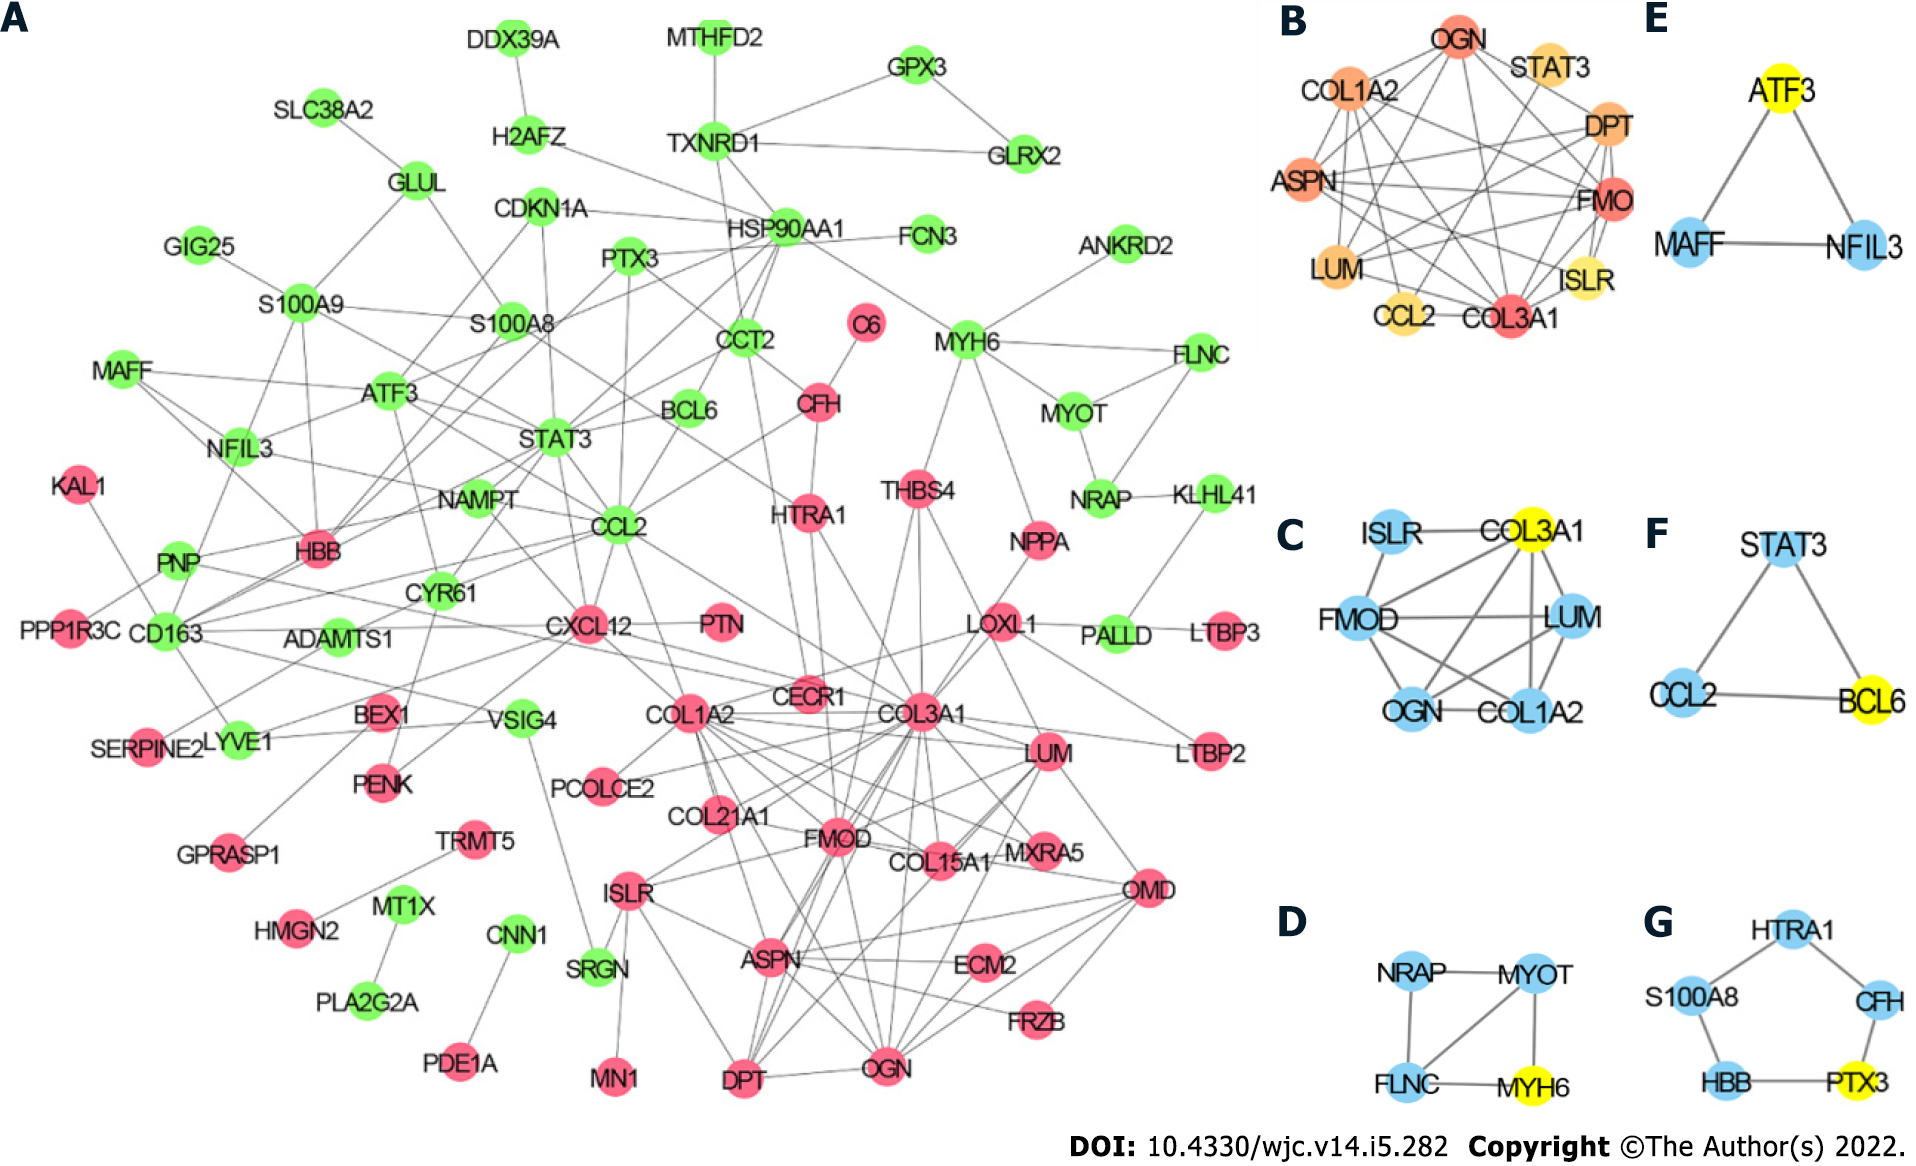
Figure 4 Protein-protein interaction network.
A: Protein-protein interaction (PPI) network of differentially expressed genes (DEGs), in which the red node represents upregulated DEGs and the green node represents the downregulated DEGs; B: Top 10 hub genes; C: Module 1; D: Module 2; E: Module 3; F: Module 4; G: Module 5. Yellow node represents the Seed gene of each module.
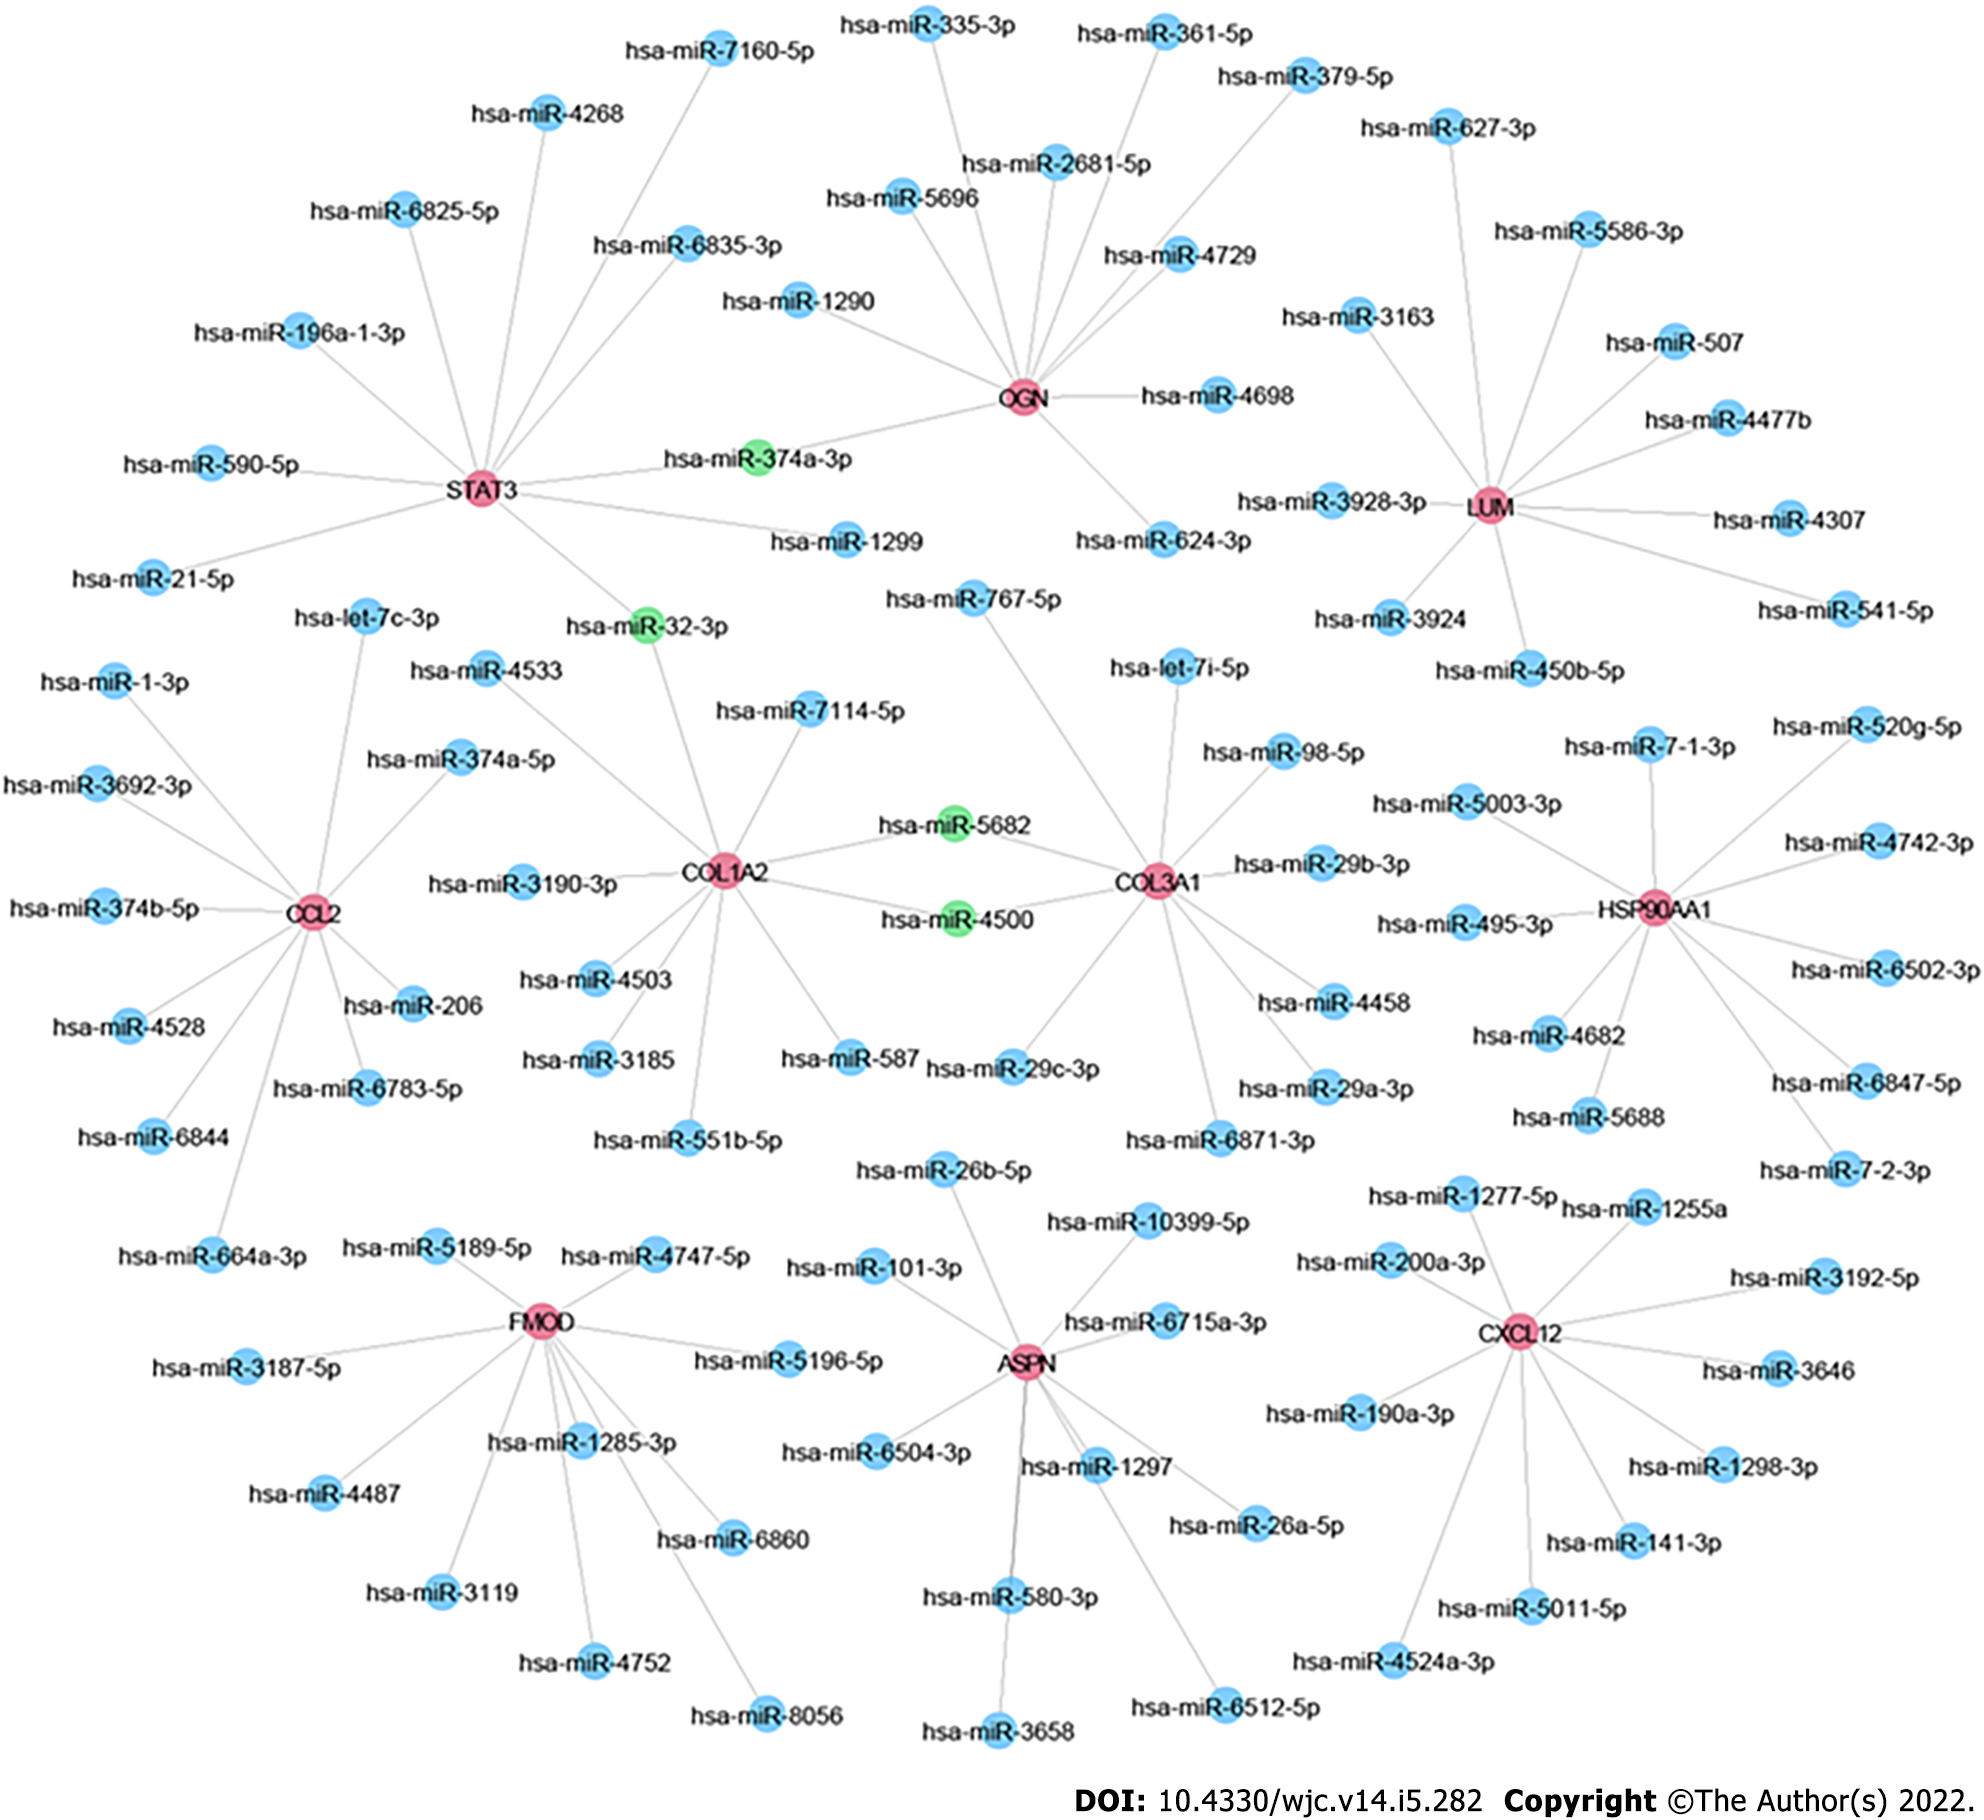
Figure 5 MicroRNA-mRNA network.
Red node represents the Hub genes; blue node represents the Targeted microRNAs; green node represents the mutual targeted miRNAs of ≥ 2 hub genes.
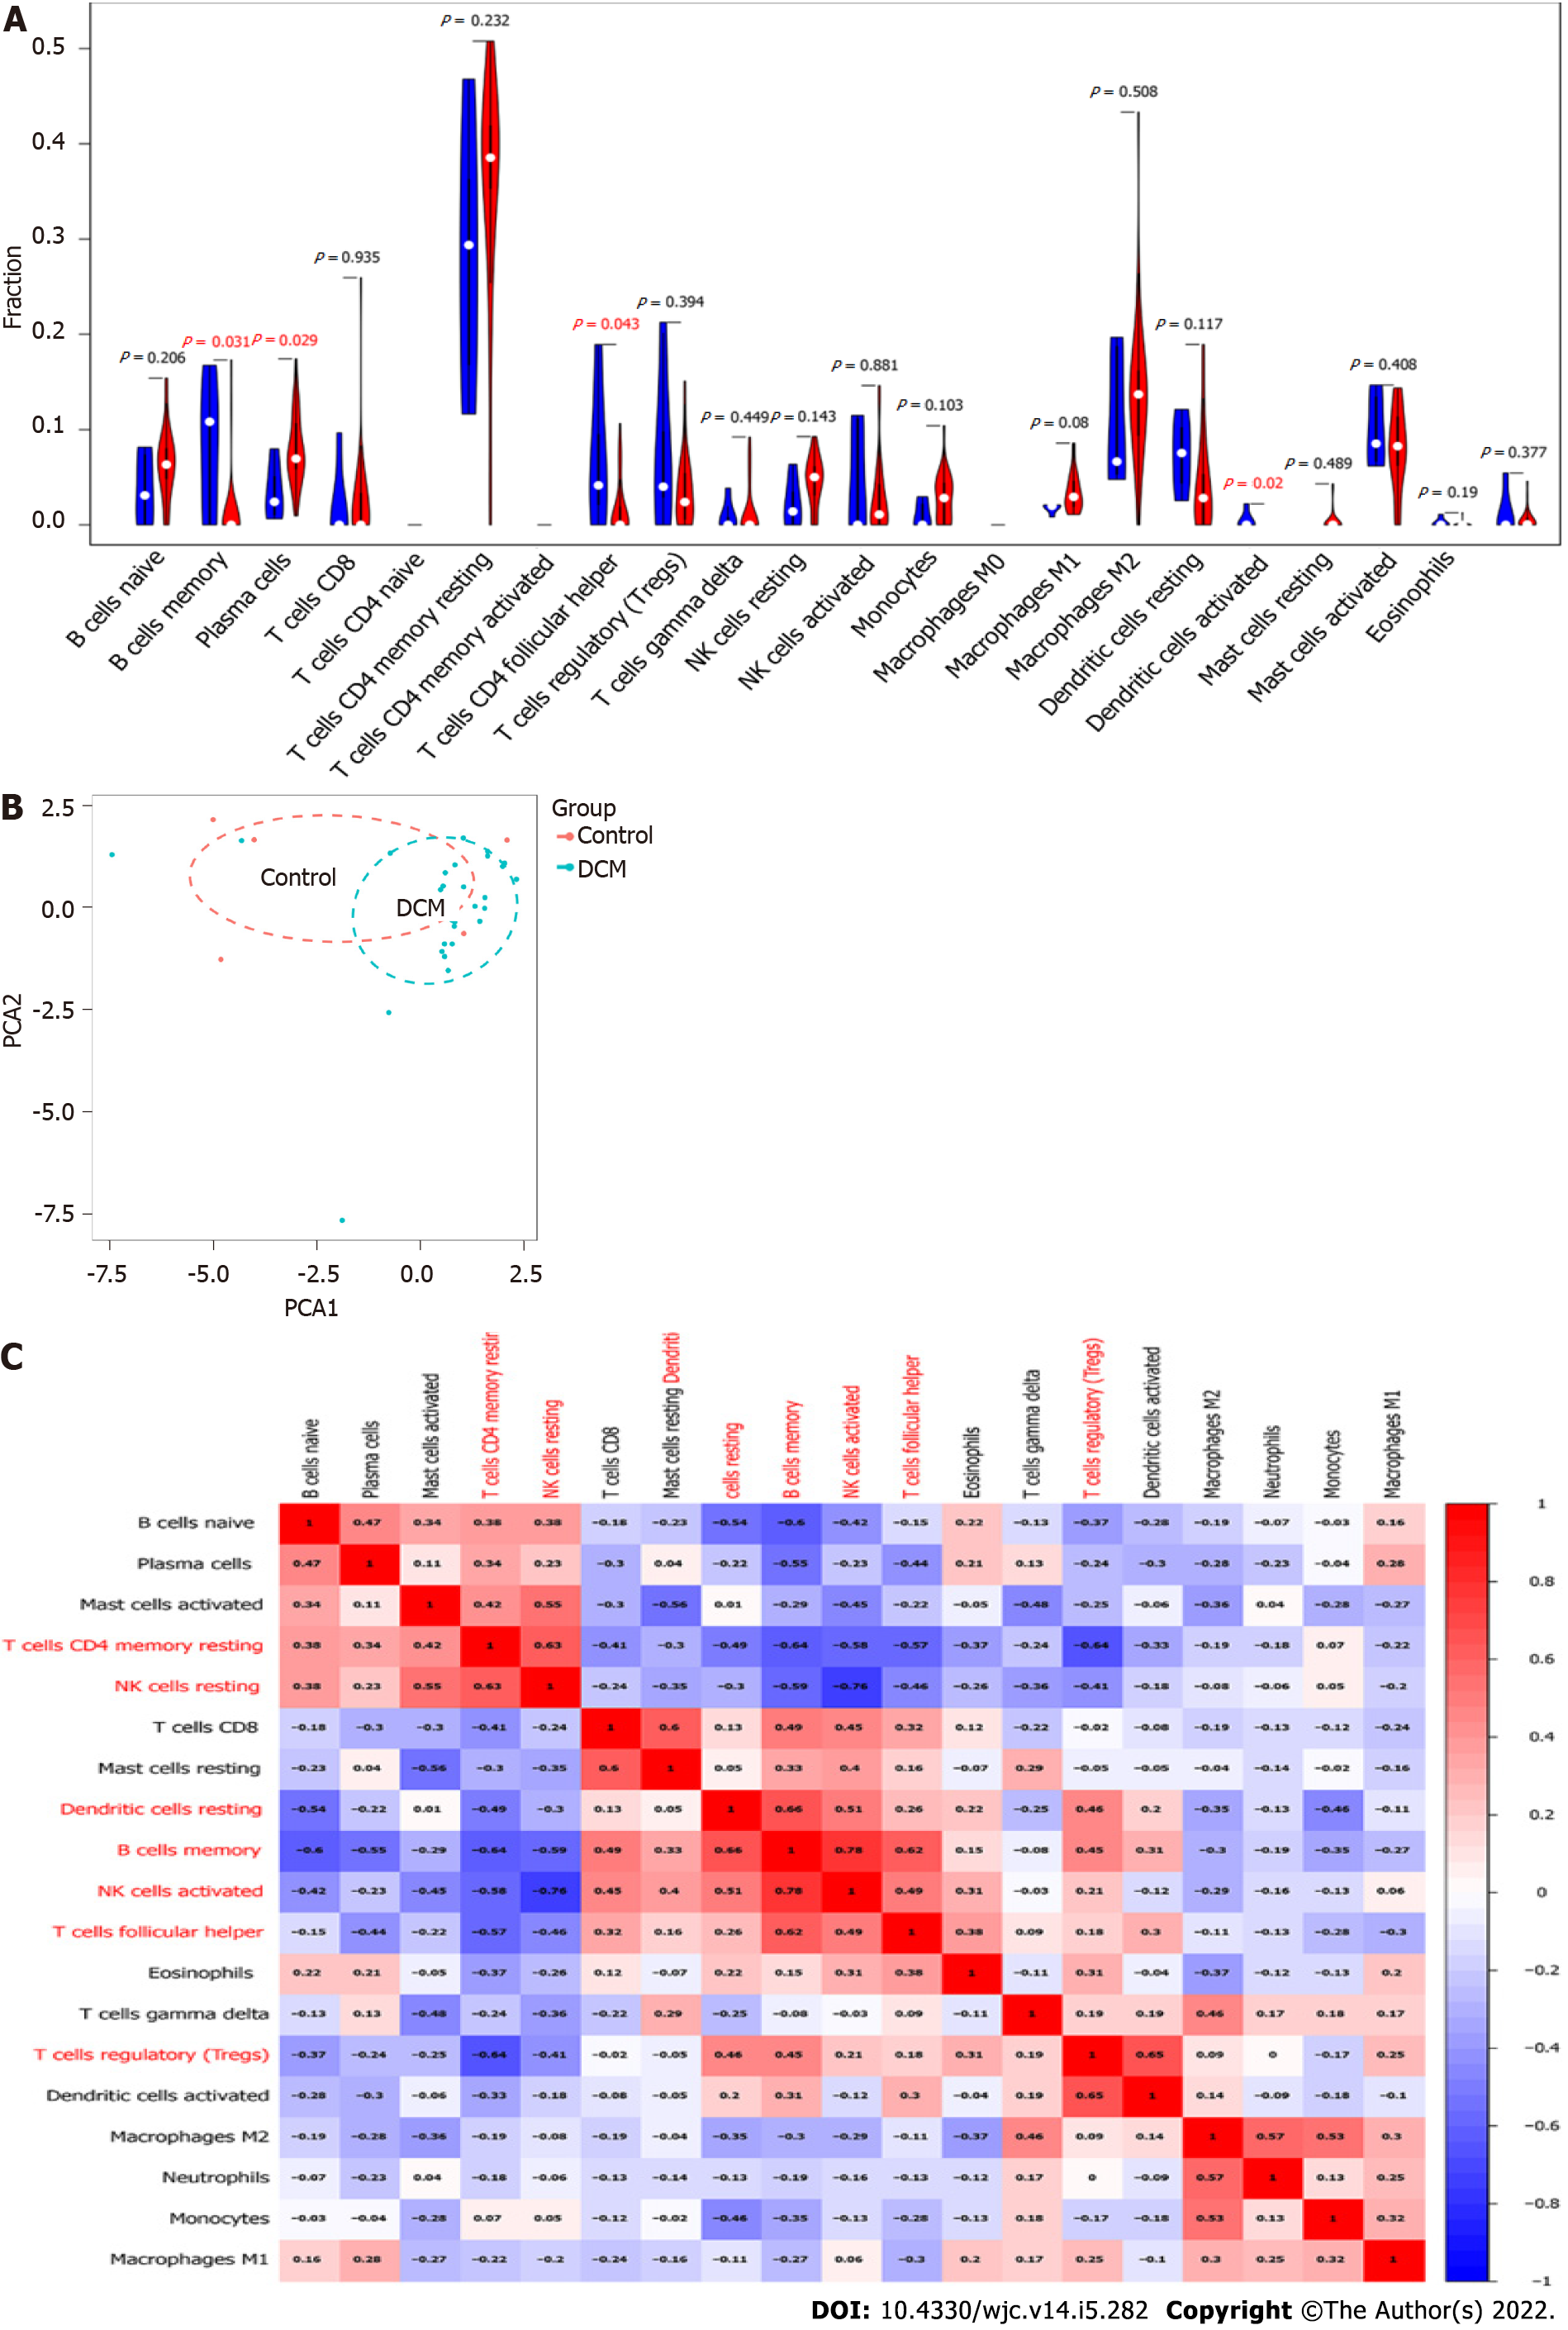
Figure 6 Immune cell infiltration analyses of differentially expressed genes.
A: Violin plot, in which red represents dilated cardiomyopathy group and blue represents the normal group; B: Principal component analysis; C: Correlation heatmap.
- Citation: Liu Z, Song YN, Chen KY, Gao WL, Chen HJ, Liang GY. Bioinformatics prediction of potential mechanisms and biomarkers underlying dilated cardiomyopathy. World J Cardiol 2022; 14(5): 282-296
- URL: https://www.wjgnet.com/1949-8462/full/v14/i5/282.htm
- DOI: https://dx.doi.org/10.4330/wjc.v14.i5.282


