Copyright
©The Author(s) 2022.
World J Cardiol. Nov 26, 2022; 14(11): 599-616
Published online Nov 26, 2022. doi: 10.4330/wjc.v14.i11.599
Published online Nov 26, 2022. doi: 10.4330/wjc.v14.i11.599
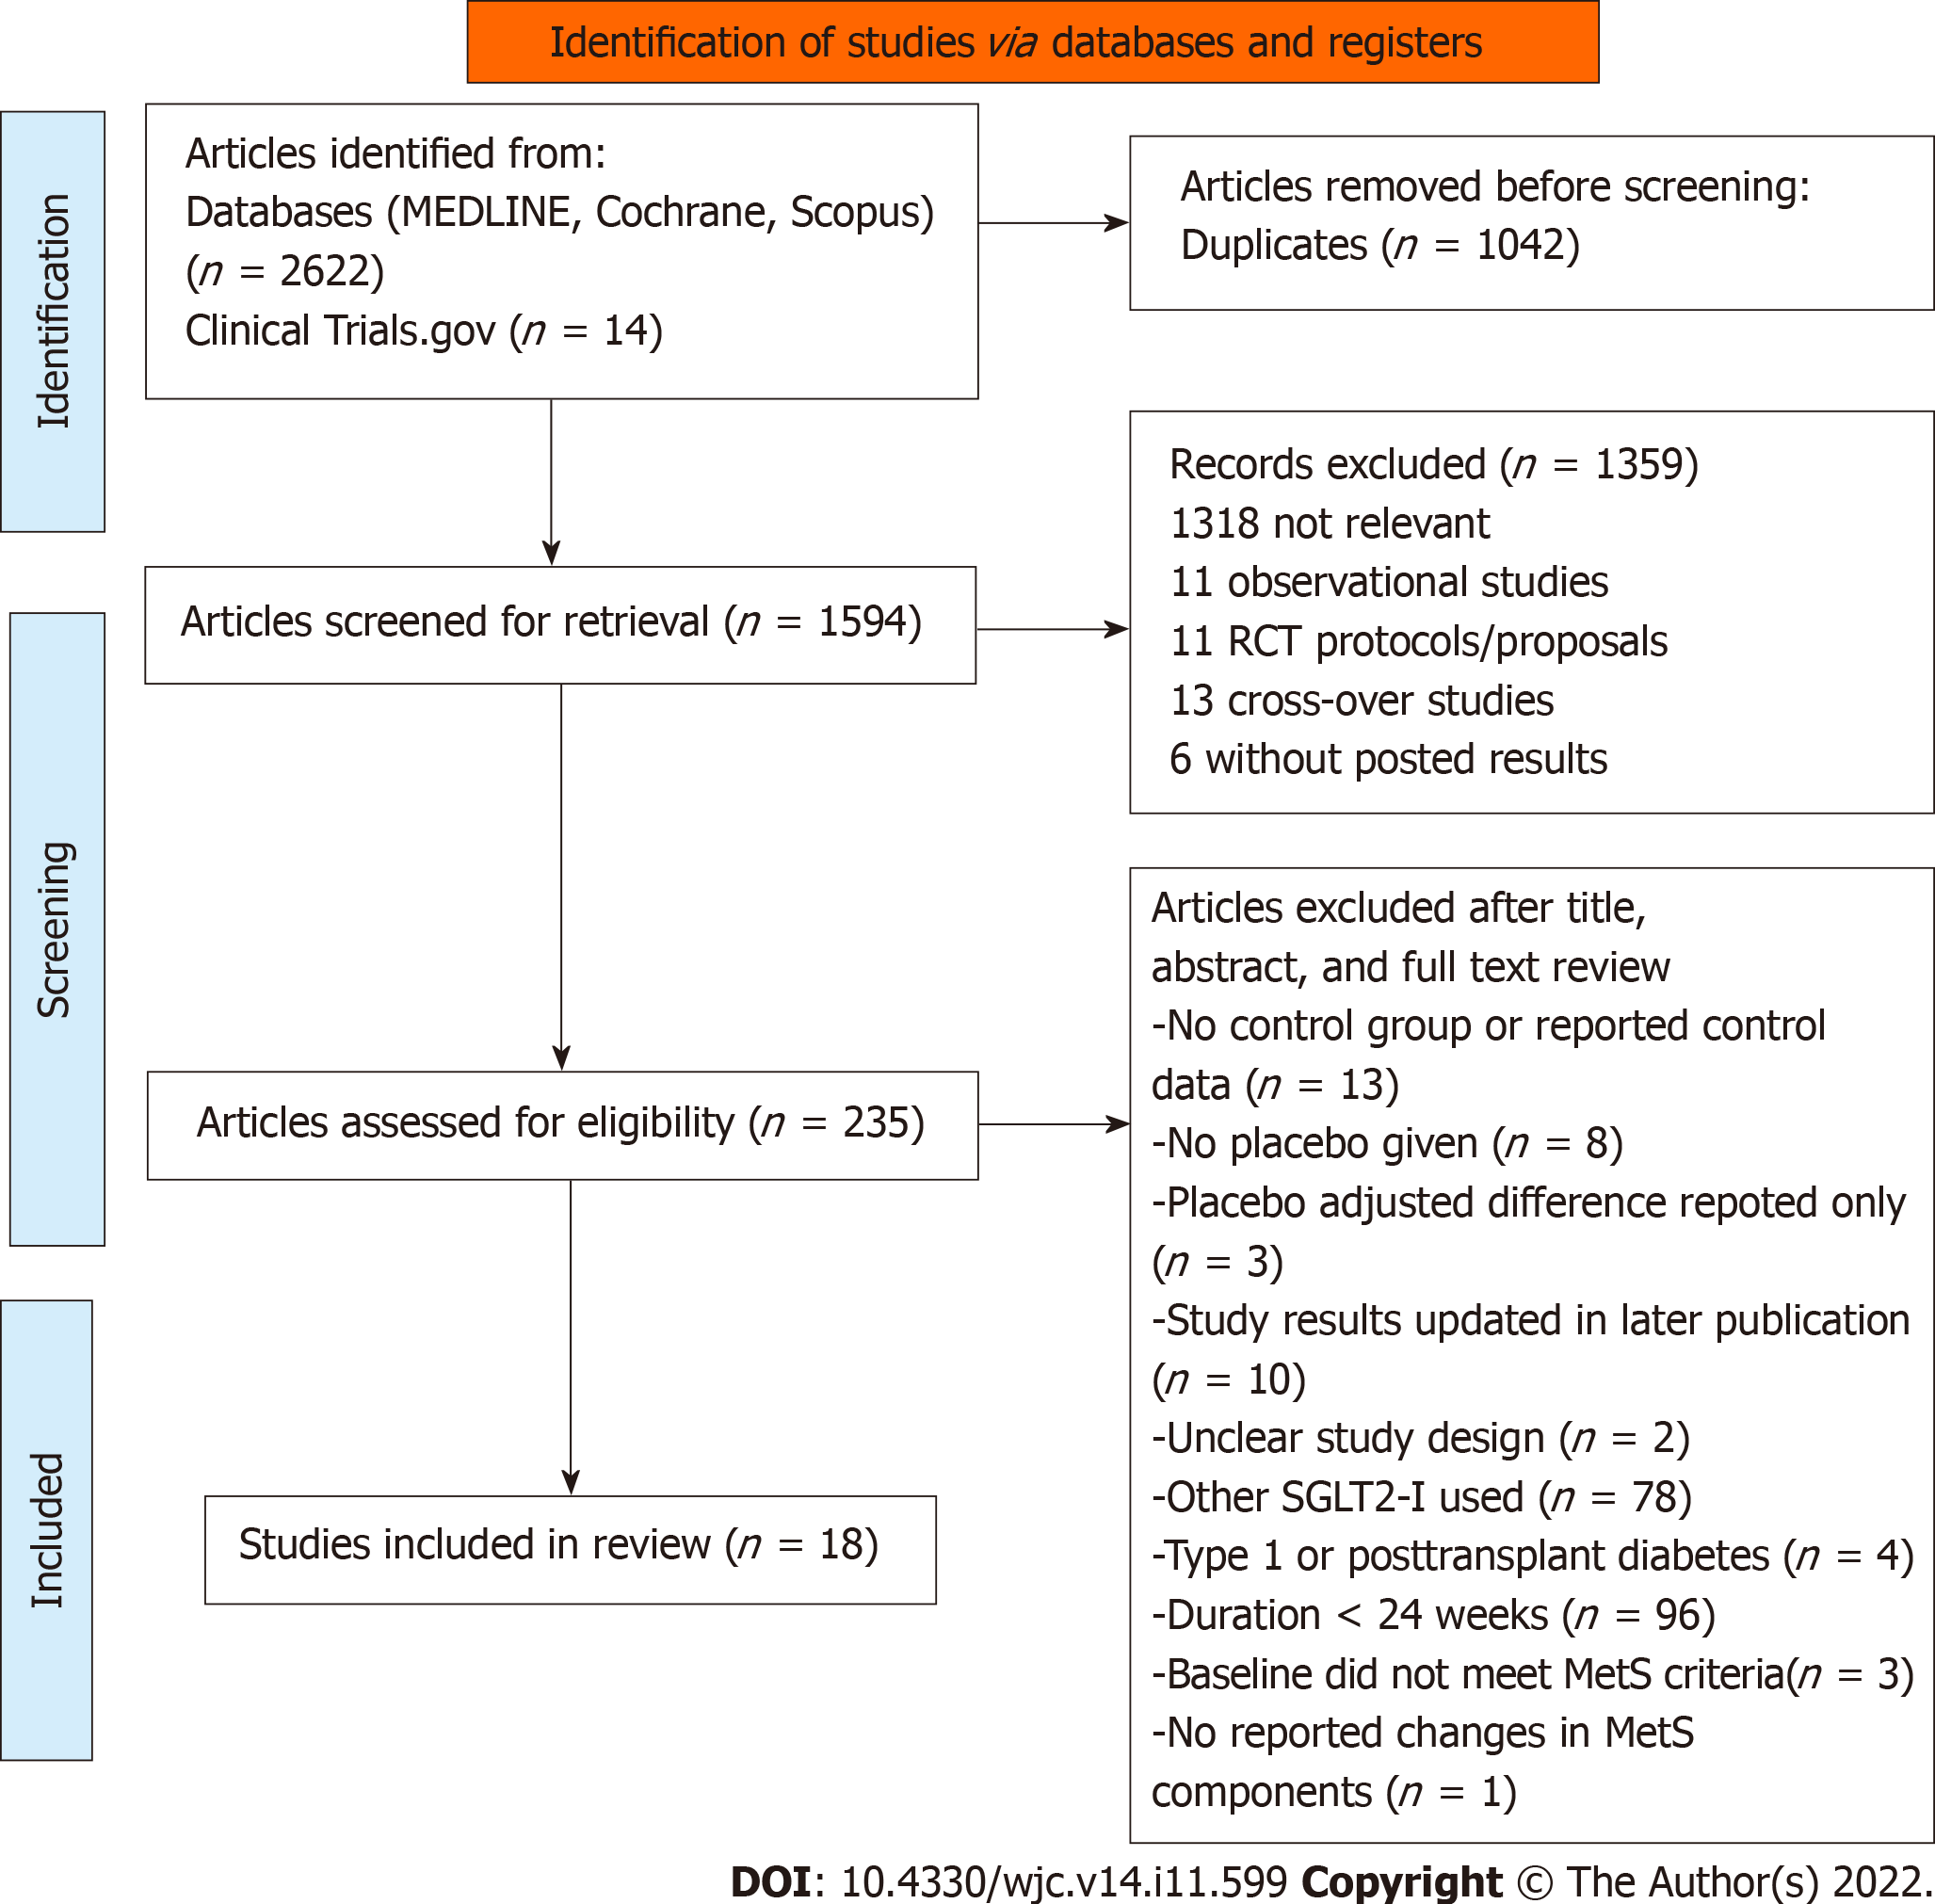
Figure 1 PRISMA flow diagram showing outcomes of databases and registers search.
SGLT2-I: Sodium-glucose cotransporter 2 inhibitor; Mets: Metabolic syndrome.
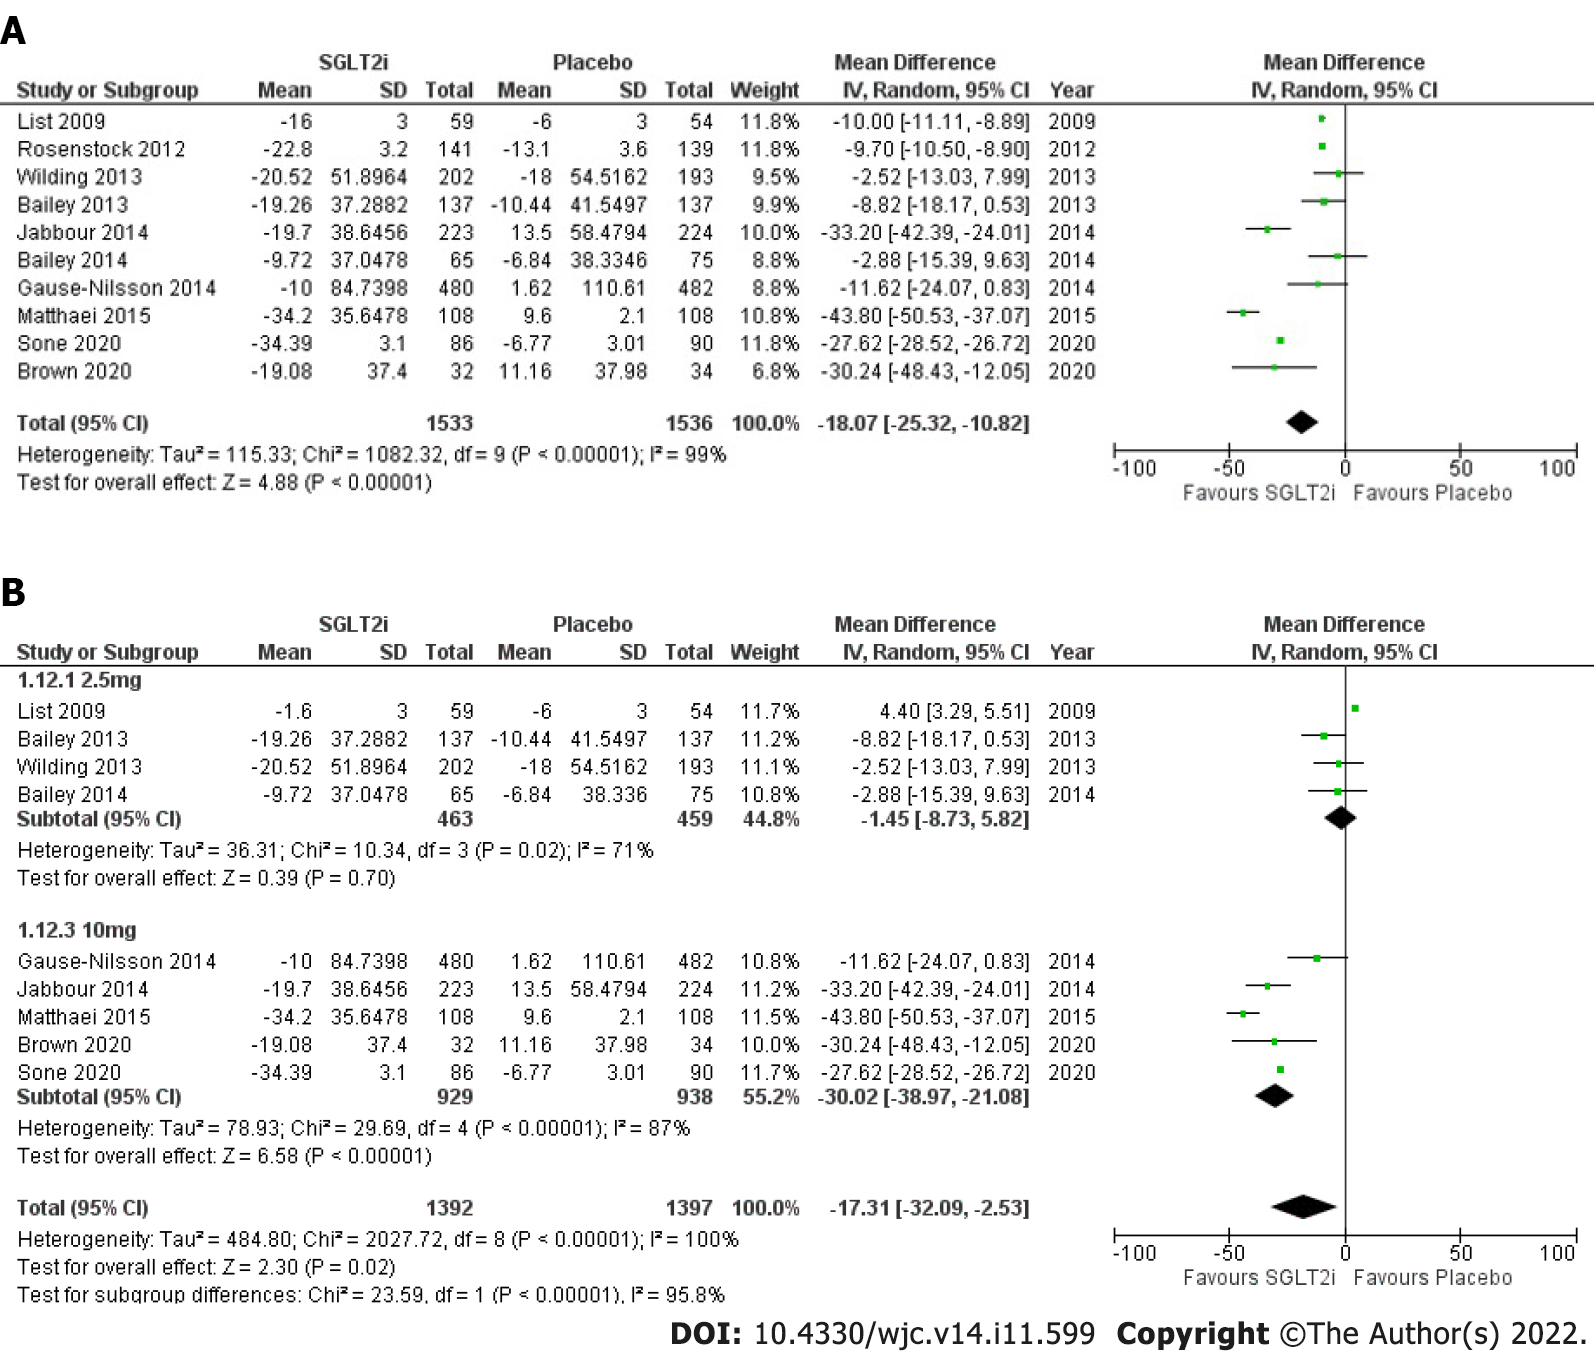
Figure 2 Forest plot.
A: Highlighting impact of SGLT2-I on FPG compared to placebo; B: SGLT2-I dose subgroup analysis performed for FPG. SGLT2-I: Sodium-glucose cotransporter 2 inhibitor; FPG: Fasting plasma glucose.
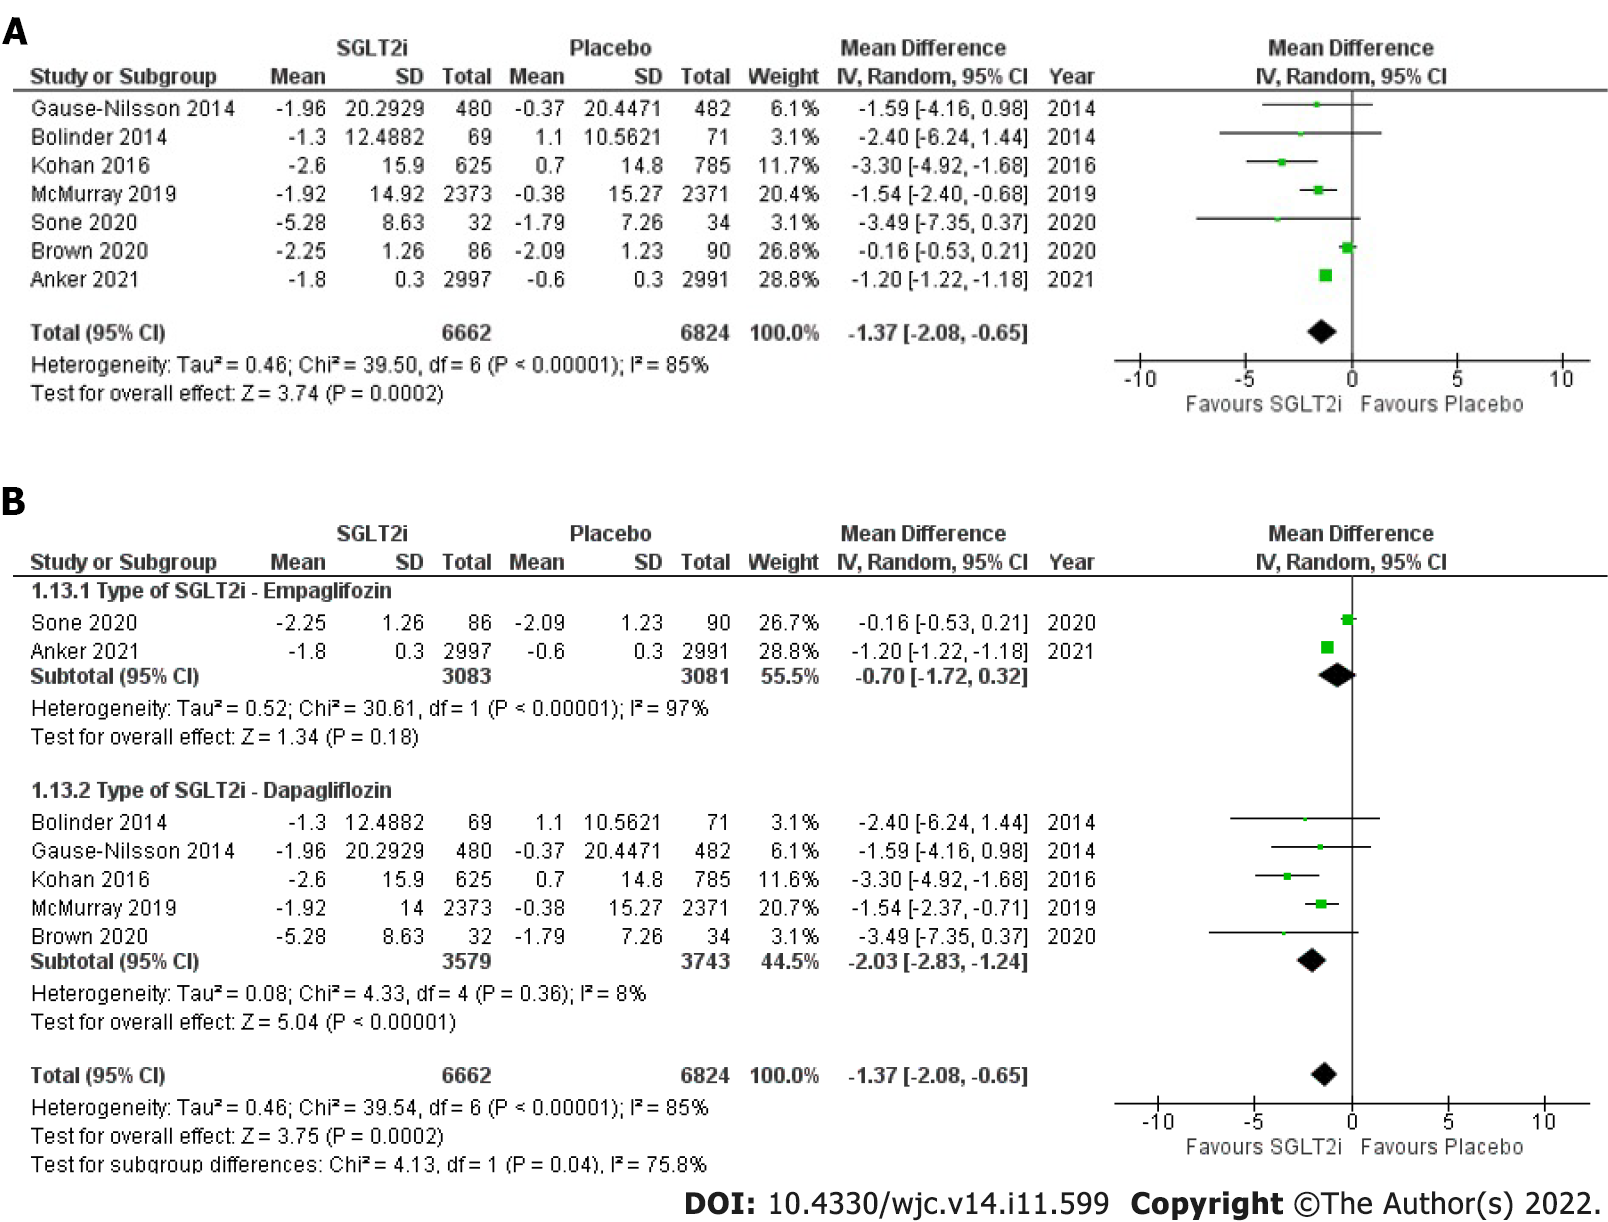
Figure 3 Forest plot.
A: Highlighting impact of SGLT2-I on SBP compared to placebo; B: SGLT2-I Type subgroup analysis performed for SBP. SGLT2-I: Sodium-glucose cotransporter 2 inhibitor; SBP: Systolic blood pressure.
Figure 4 Forest plot highlighting impact of SGLT2-I on DBP compared to placebo.
SGLT2-I: Sodium-glucose cotransporter 2 inhibitor; DBP: Diastolic blood pressure.
Figure 5 Forest plot highlighting impact of SGLT2-I on WC compared to placebo.
SGLT2-I: Sodium-glucose cotransporter 2 inhibitor; WC: Waist circumference.
Figure 6 Forest plot highlighting the absence of significant impact of SGLT2-I on HDL compared to placebo.
SGLT2-I: Sodium-glucose cotransporter 2 inhibitor; HDL: High-density lipoprotein.
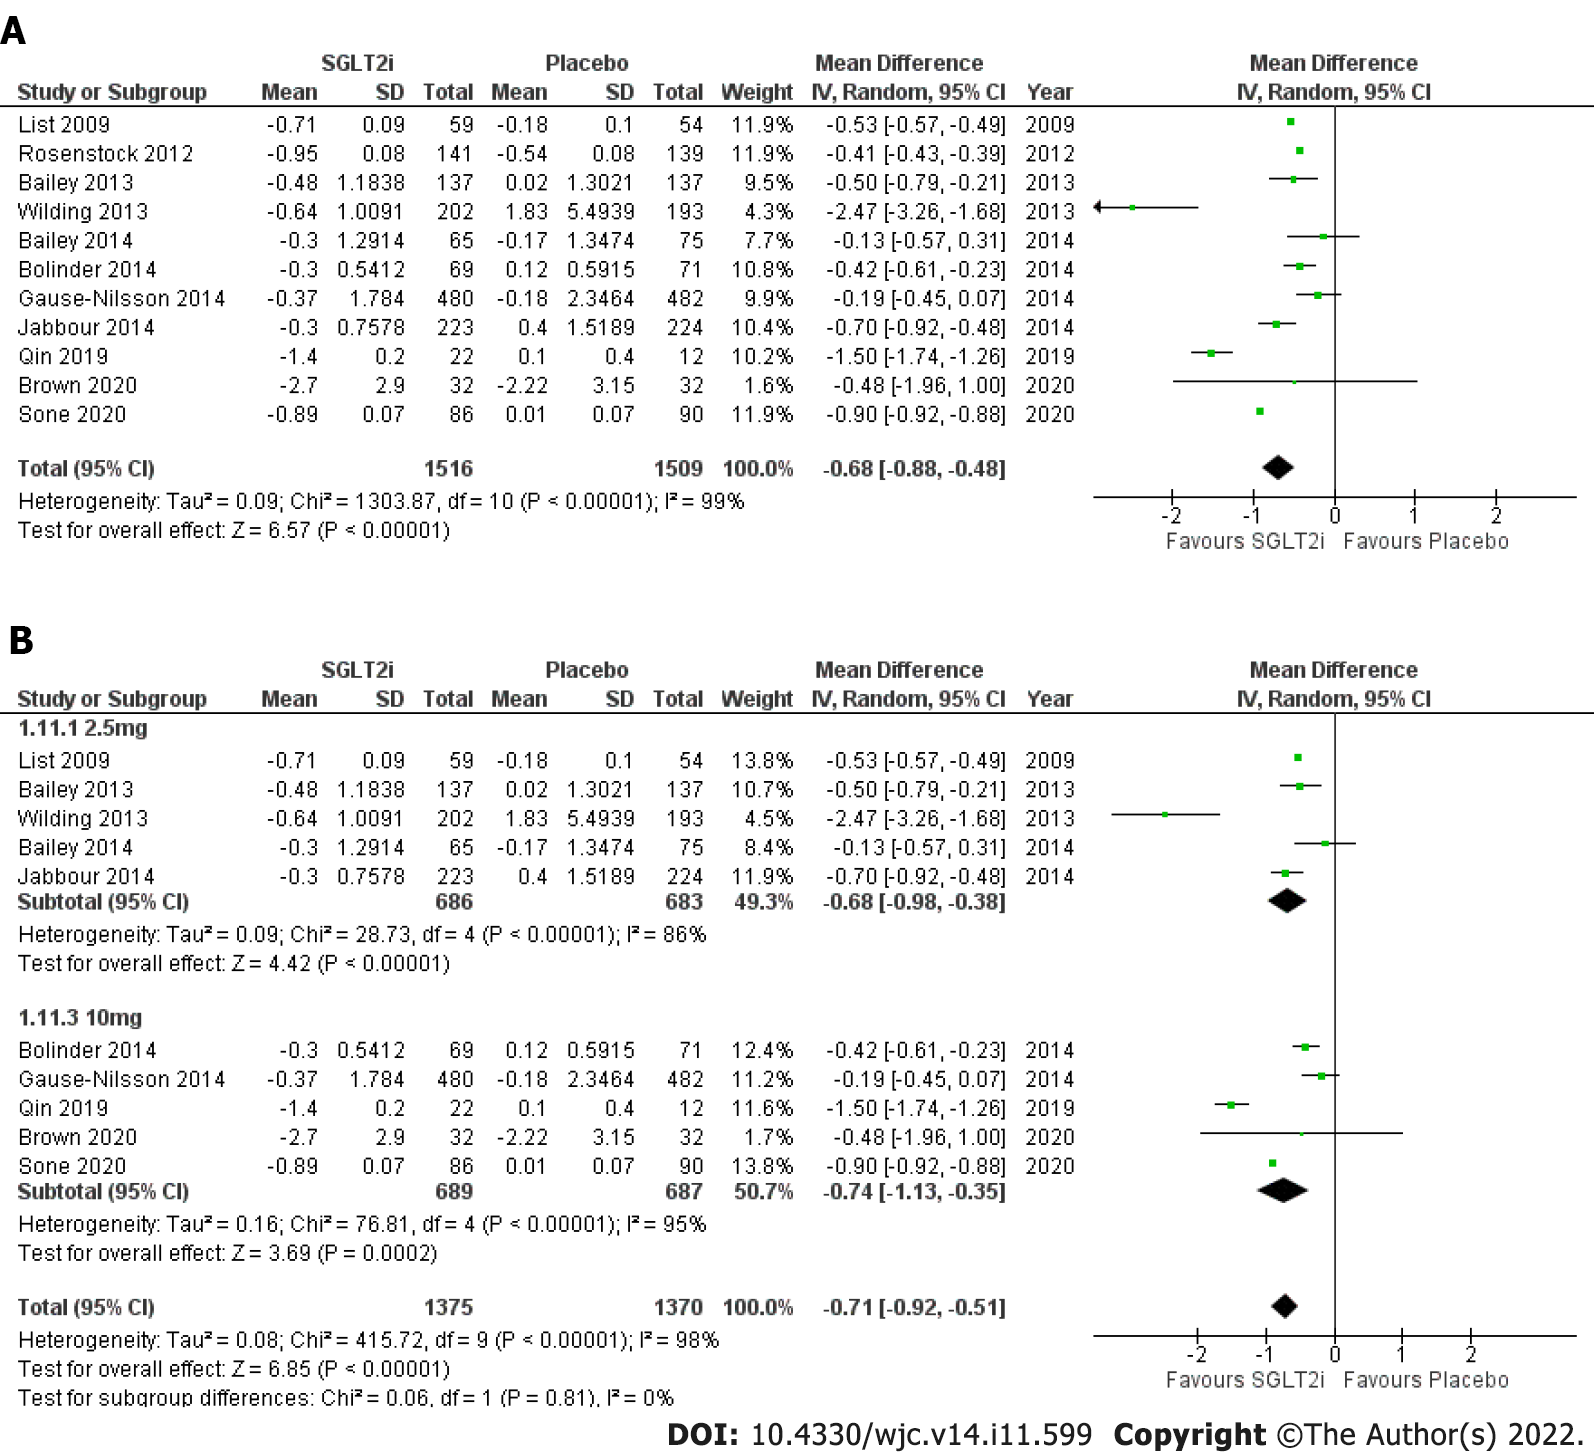
Figure 7 Forest plot.
A: Highlighting impact of SGLT2-I on HgbA1C compared to placebo; B: SGLT2-I Dose subgroup analysis performed for HgbA1C. SGLT2-I: Sodium-glucose cotransporter 2 inhibitor.
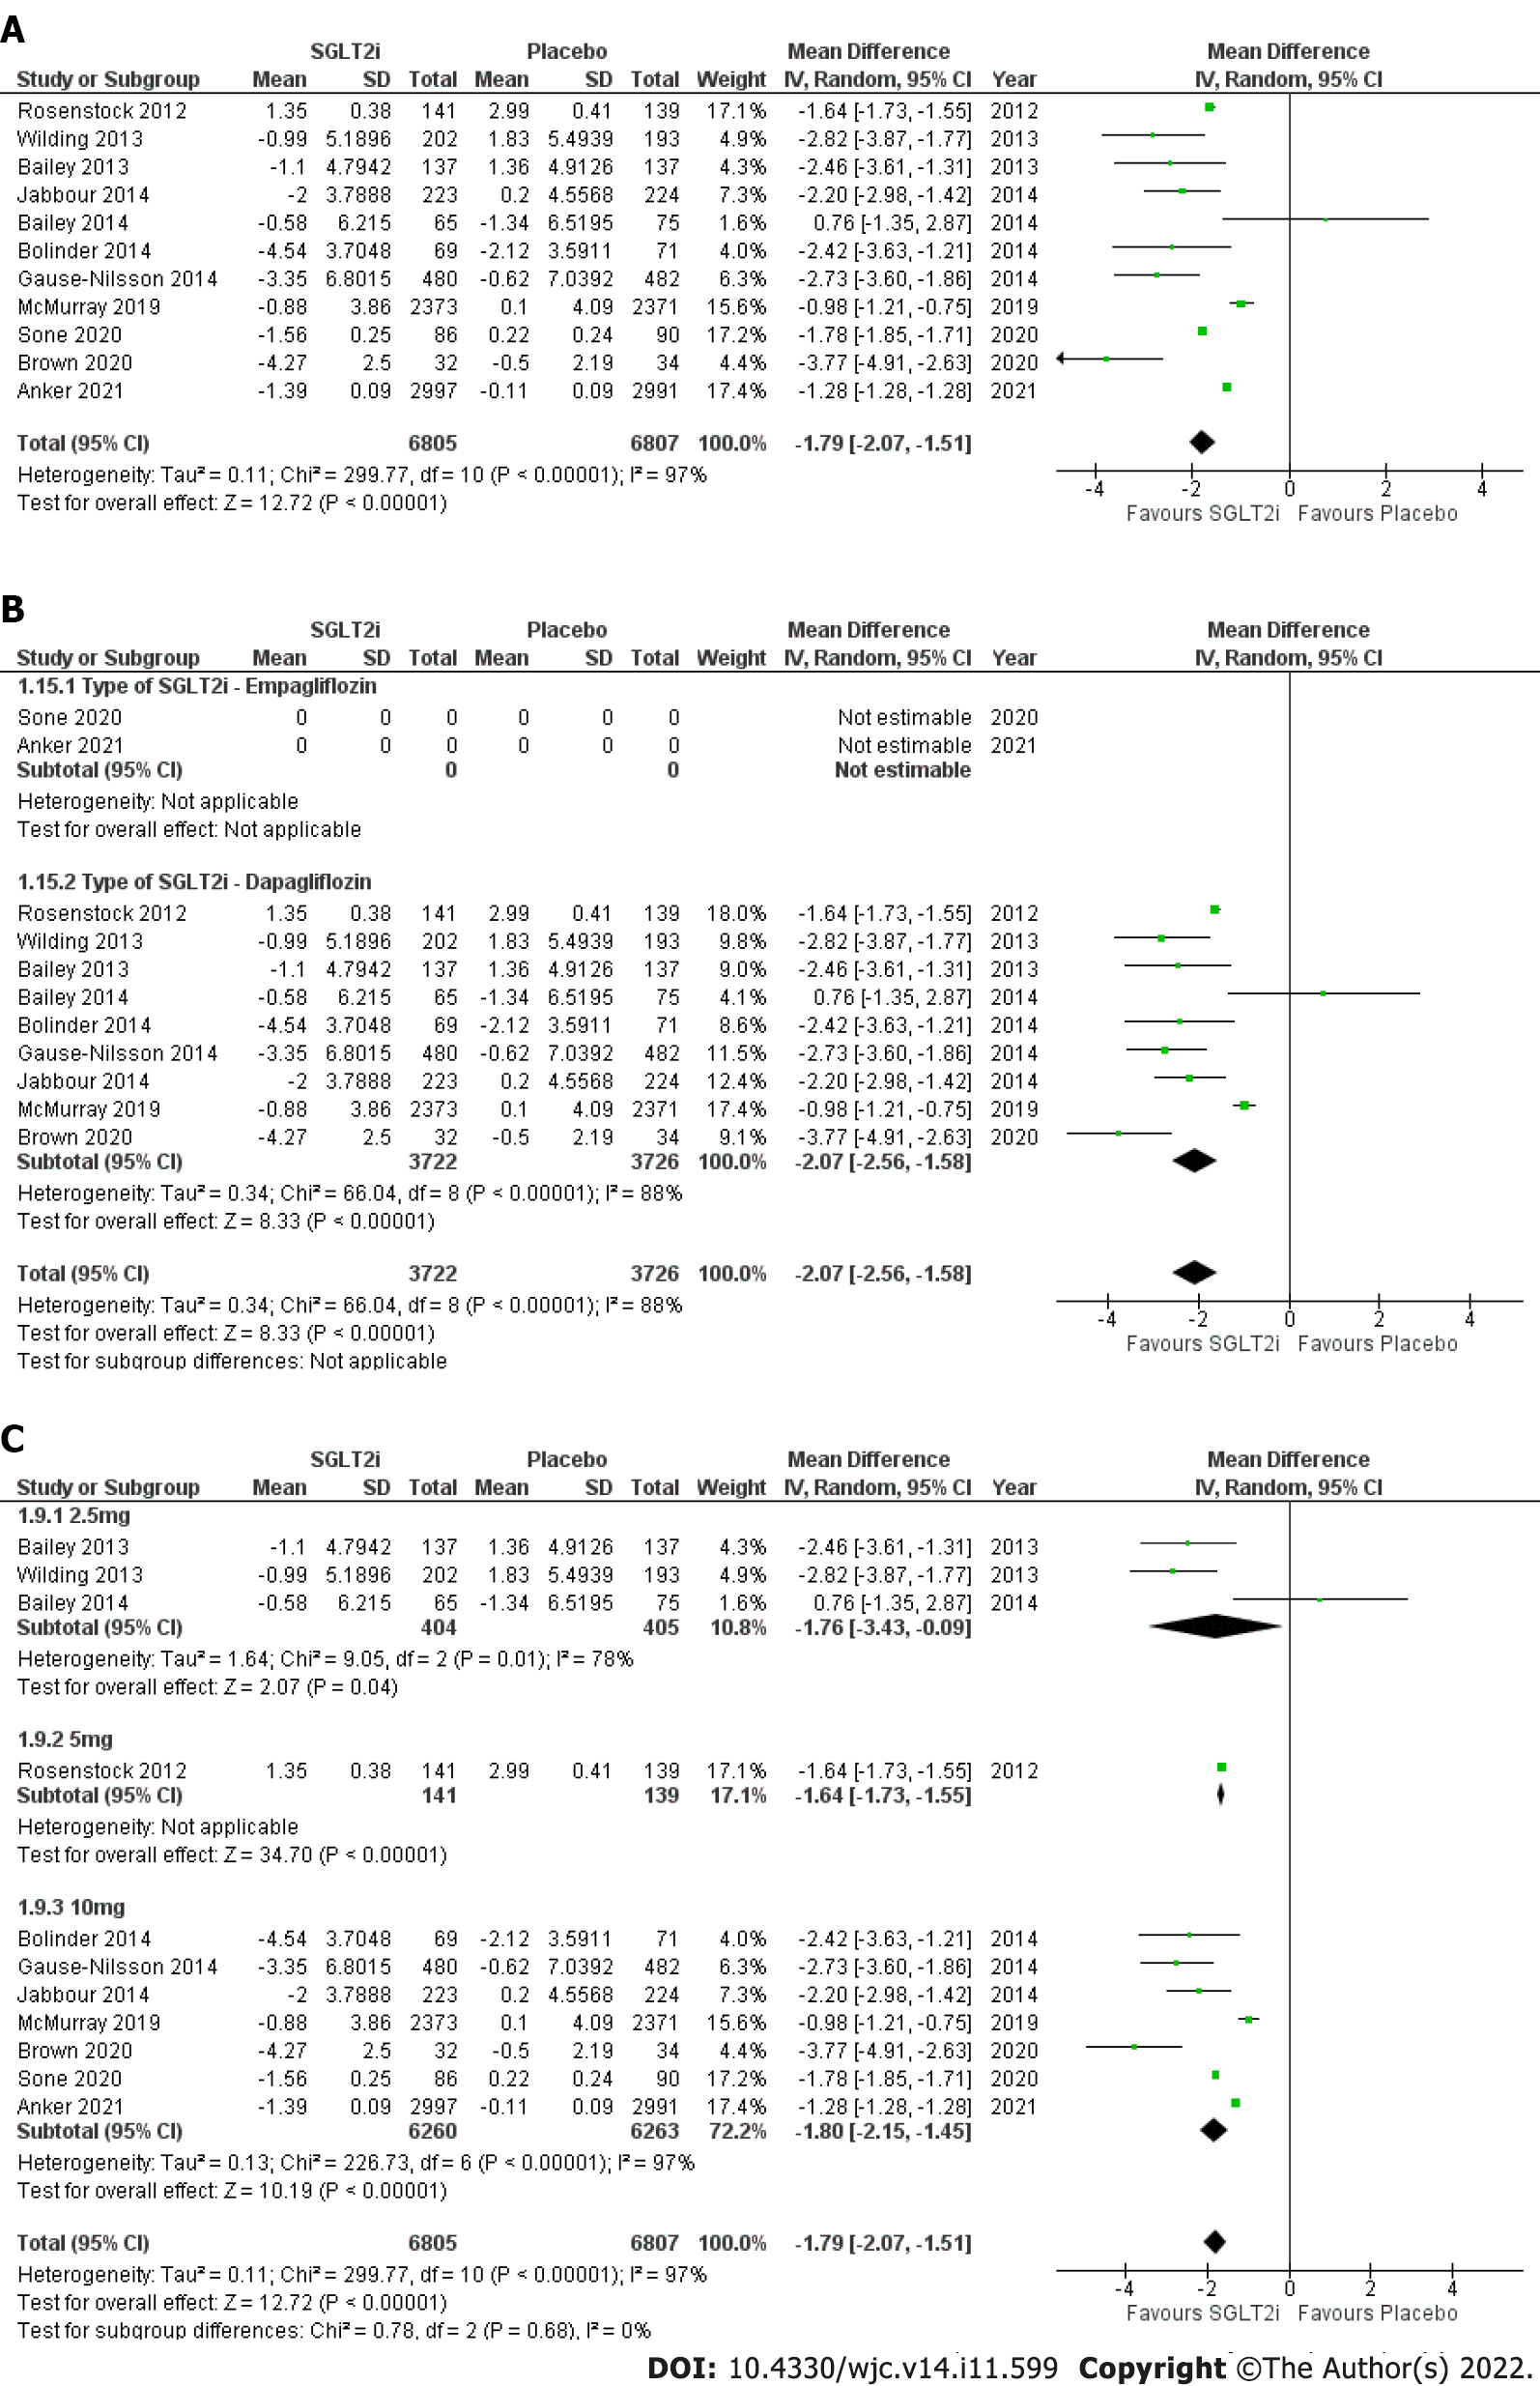
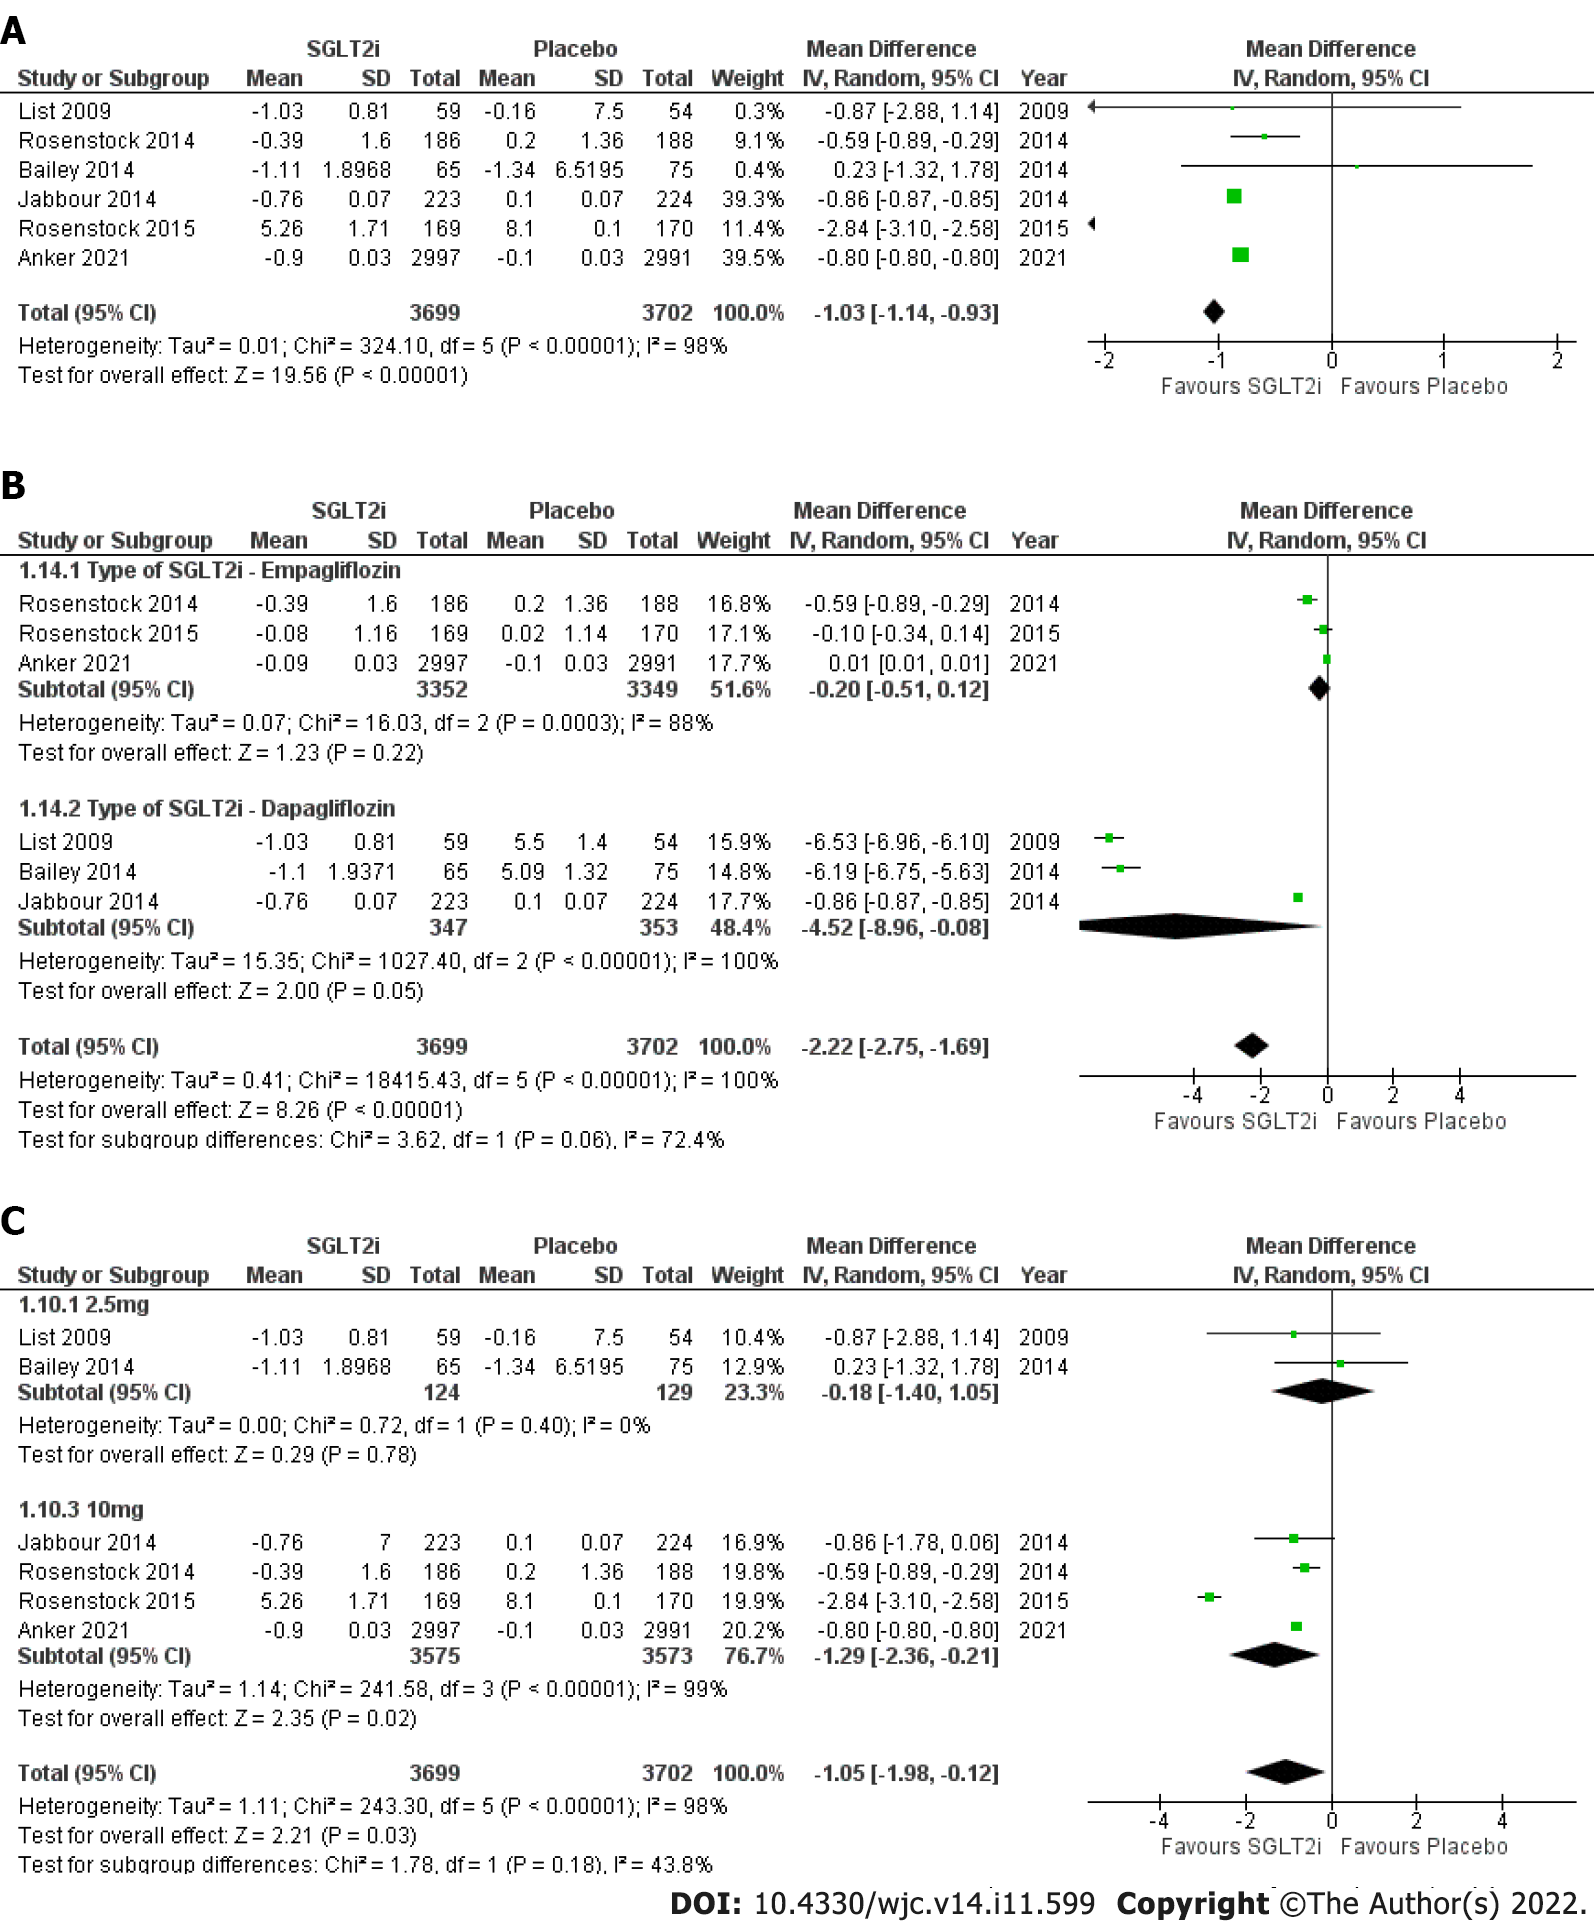
Figure 8 Forest plot.
A: Highlighting impact of SGLT2-I on BW compared to placebo; B: SGLT2-I Type subgroup analysis performed for BW; C: SGLT2-I Dose subgroup analysis performed for BW. SGLT2-I: Sodium-glucose cotransporter 2 inhibitor; BW: Body weight.
Figure 9 Forest plot.
A: Highlighting impact of SGLT2-I on UA compared to placebo; B: SGLT2-I Type subgroup analysis performed for UA; C: SGLT2-I Dose subgroup analysis performed for UA. SGLT2-I: Sodium-glucose cotransporter 2 inhibitor; UA: Uric acid.
- Citation: Olagunju A, Yamani N, Kenny D, Mookadam M, Mookadam F, Unzek S. Potential for sodium-glucose cotransporter-2 inhibitors in the management of metabolic syndrome: A systematic review and meta-analysis. World J Cardiol 2022; 14(11): 599-616
- URL: https://www.wjgnet.com/1949-8462/full/v14/i11/599.htm
- DOI: https://dx.doi.org/10.4330/wjc.v14.i11.599


