Copyright
©The Author(s) 2021.
World J Cardiol. Sep 26, 2021; 13(9): 483-492
Published online Sep 26, 2021. doi: 10.4330/wjc.v13.i9.483
Published online Sep 26, 2021. doi: 10.4330/wjc.v13.i9.483
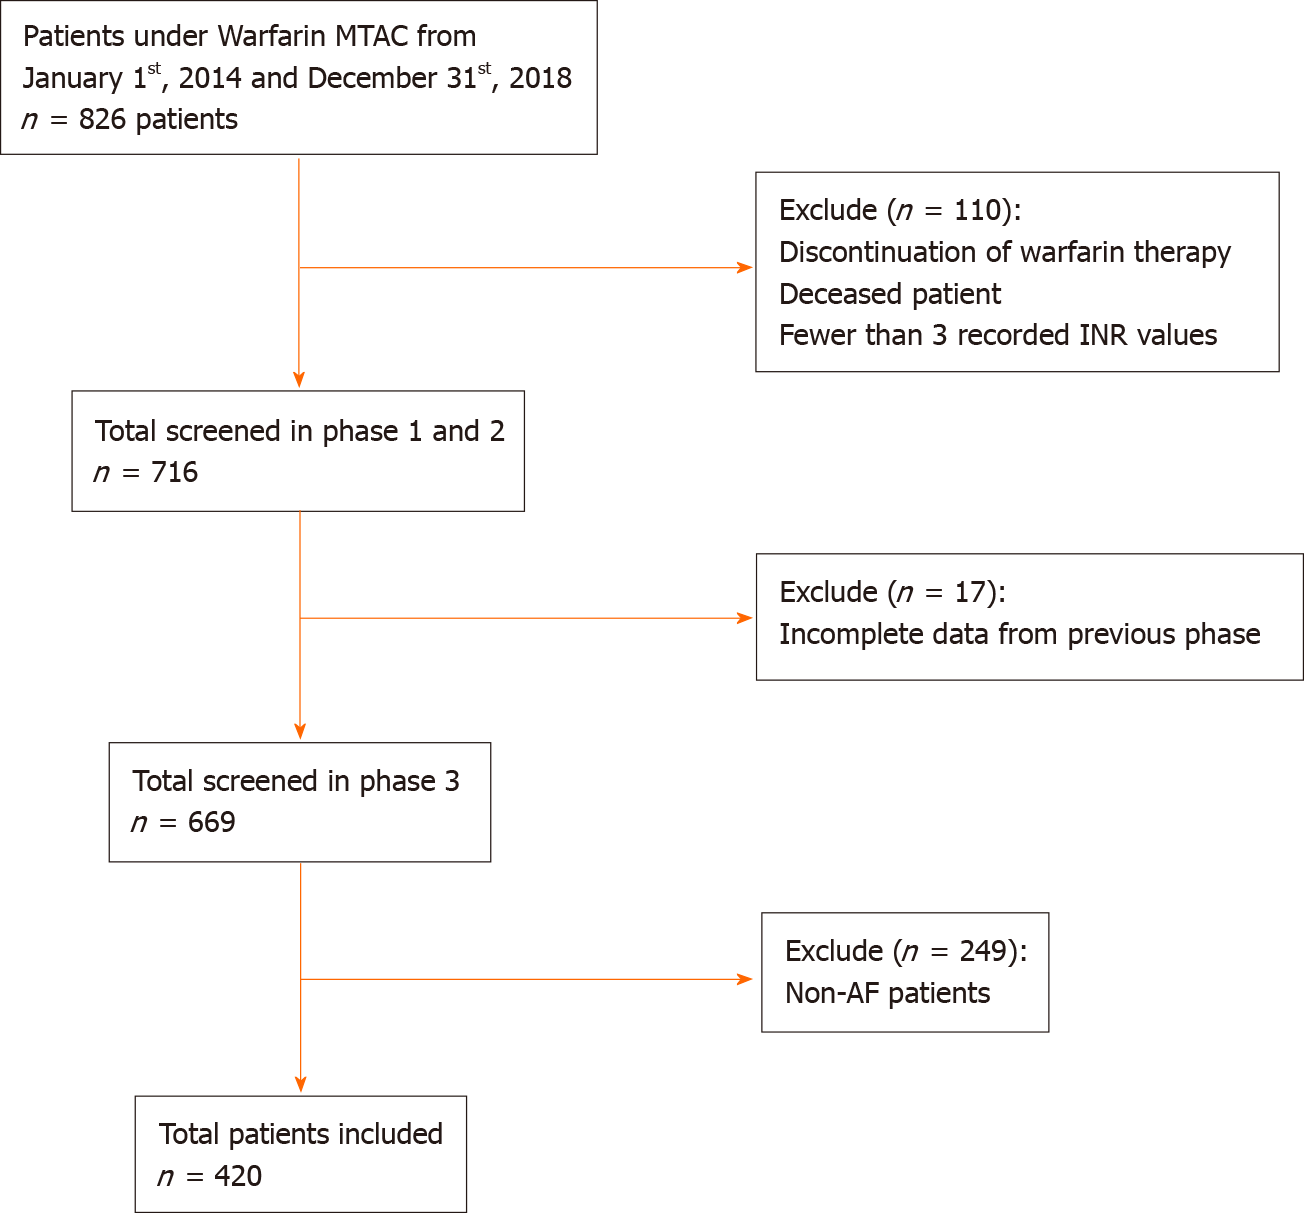
Figure 1 Flow diagram describing the selection of data for the analysis reported.
AF: Atrial fibrillation; INR: International normalized ratio; MTAC: Medication Therapeutic Adherence Clinic.
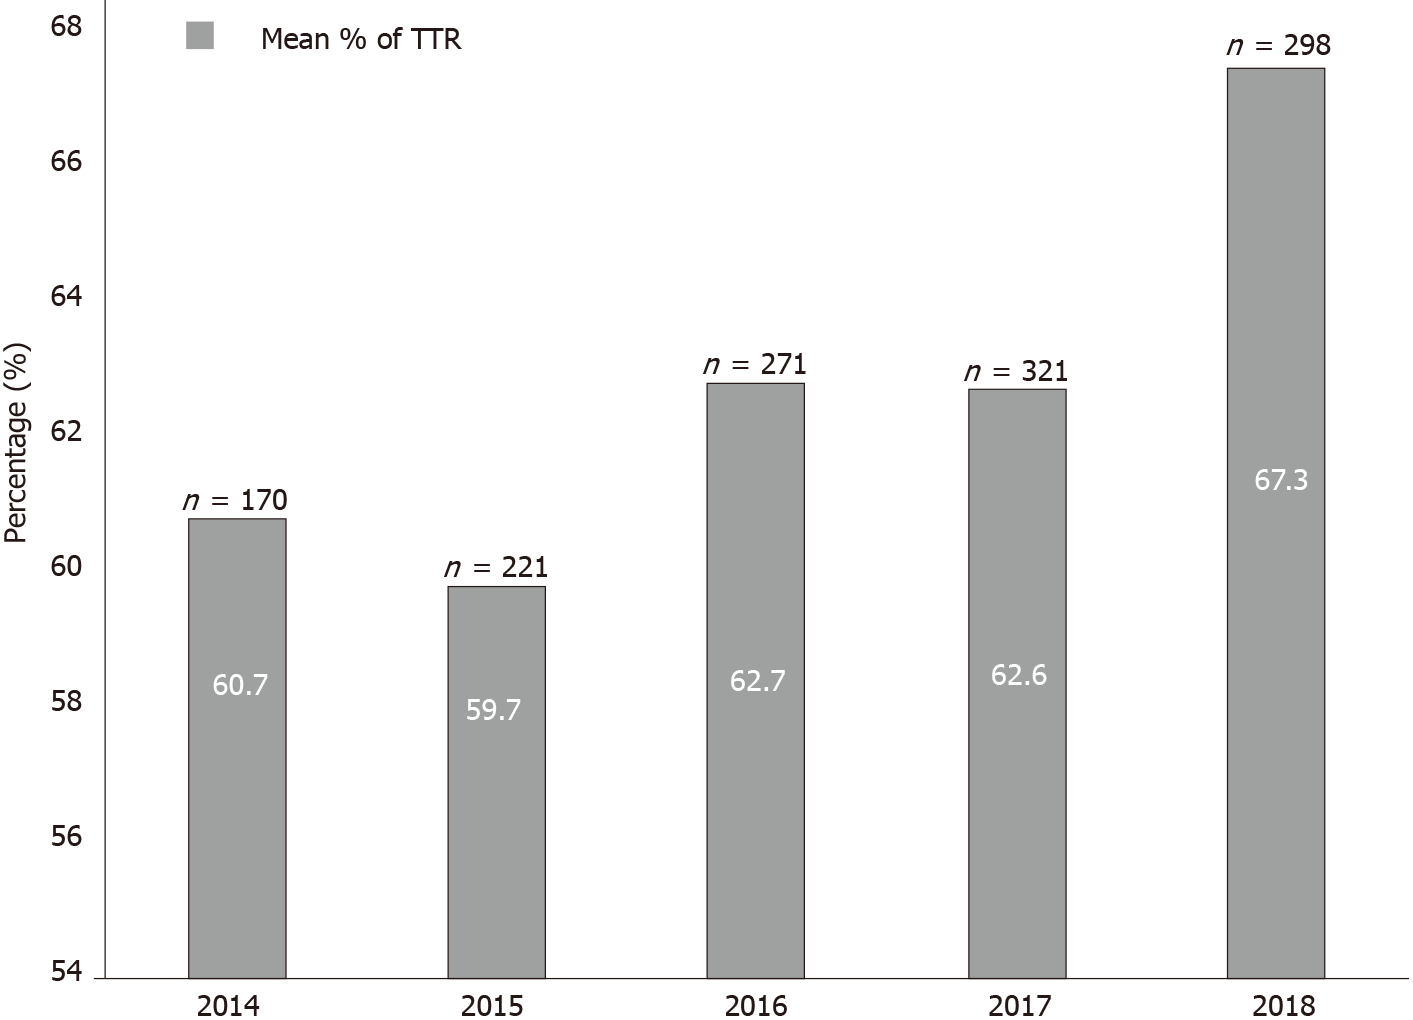
Figure 2 Mean percentage of the time in therapeutic range among atrial fibrillation patients.
TTR: Time in therapeutic range.
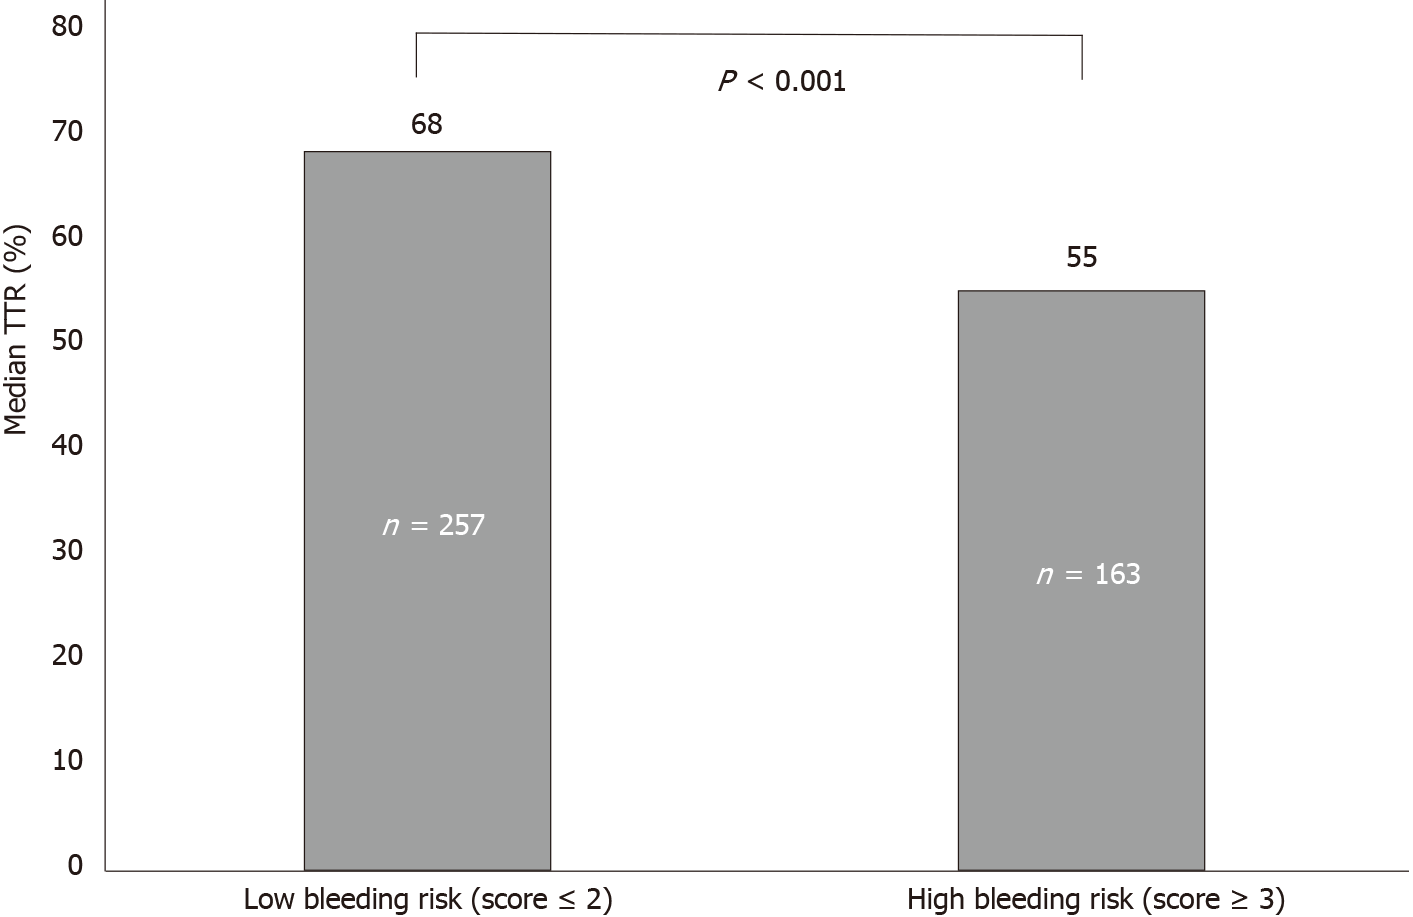
Figure 3 HAS-BLED score vs median time in therapeutic range (%).
TTR: Time in therapeutic range.
- Citation: Lee SL, Ong TJ, Mazlan-Kepli W, Mageswaran A, Tan KH, Abd-Malek AM, Cronshaw R. Patients’ time in therapeutic range on warfarin among atrial fibrillation patients in Warfarin Medication Therapy Adherence Clinic. World J Cardiol 2021; 13(9): 483-492
- URL: https://www.wjgnet.com/1949-8462/full/v13/i9/483.htm
- DOI: https://dx.doi.org/10.4330/wjc.v13.i9.483


