Copyright
©The Author(s) 2020.
World J Cardiol. Nov 26, 2020; 12(11): 571-583
Published online Nov 26, 2020. doi: 10.4330/wjc.v12.i11.571
Published online Nov 26, 2020. doi: 10.4330/wjc.v12.i11.571
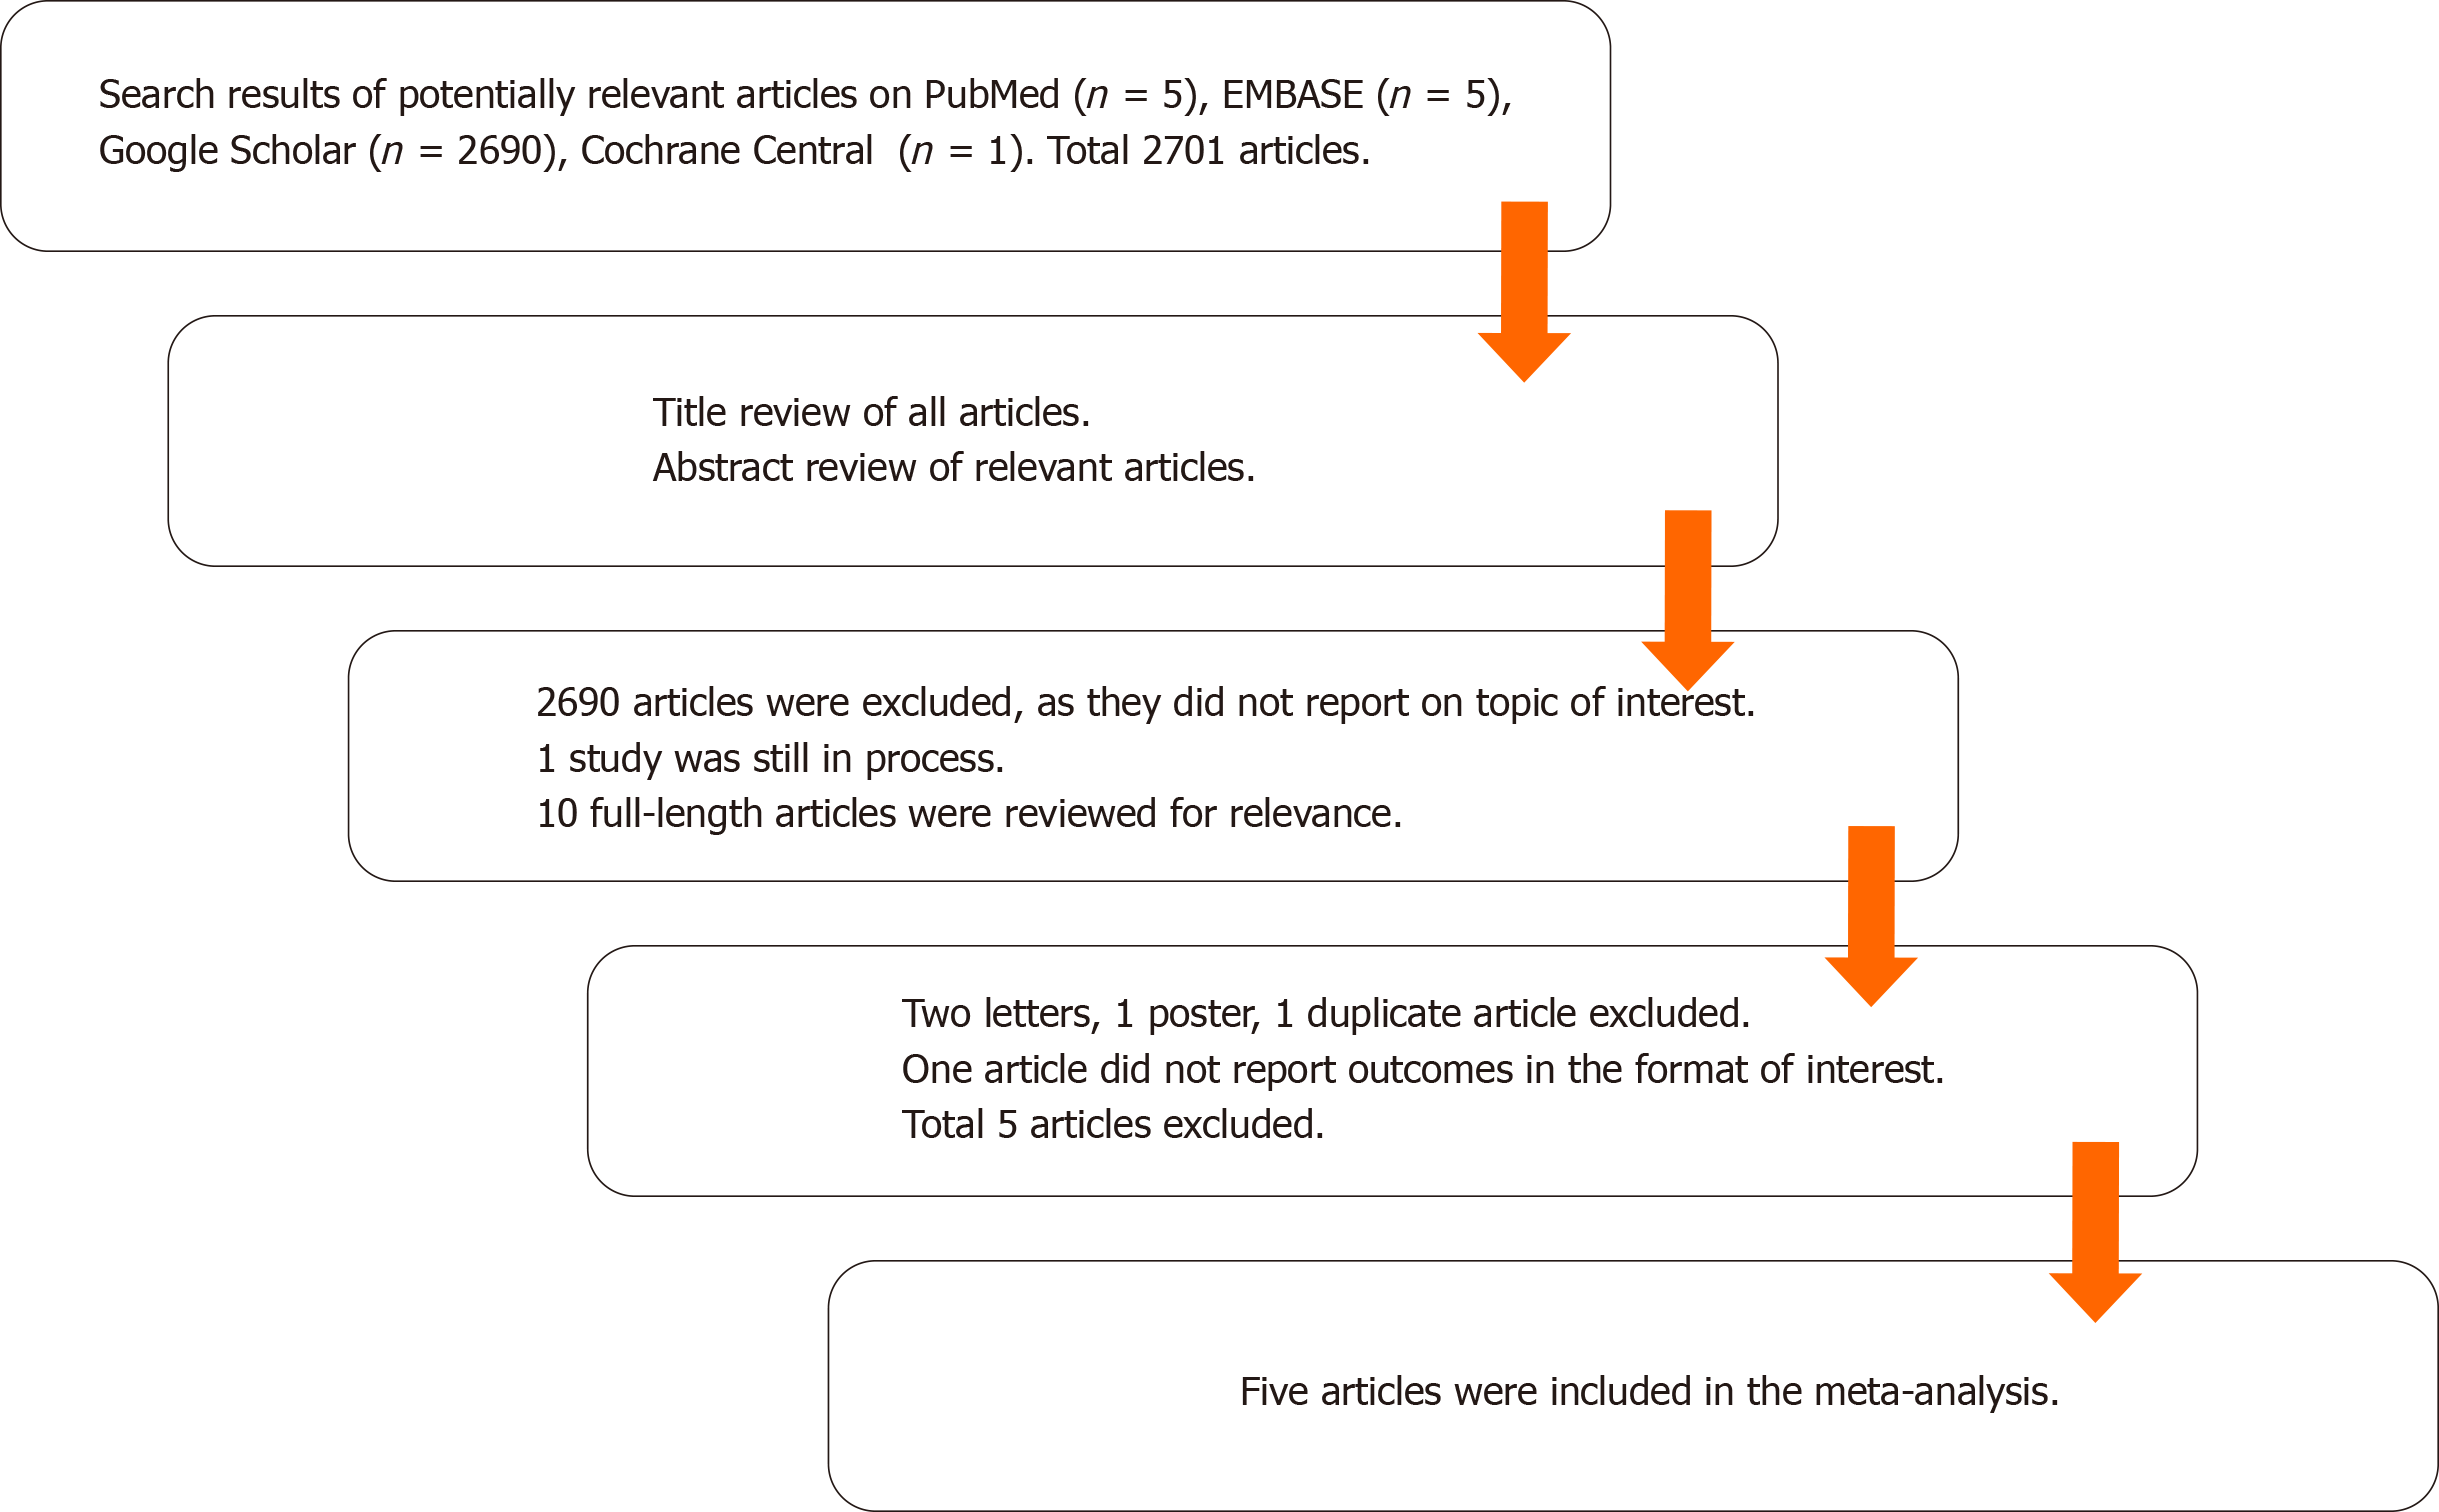
Figure 1 Flowchart outlining search strategy and article-selection process.
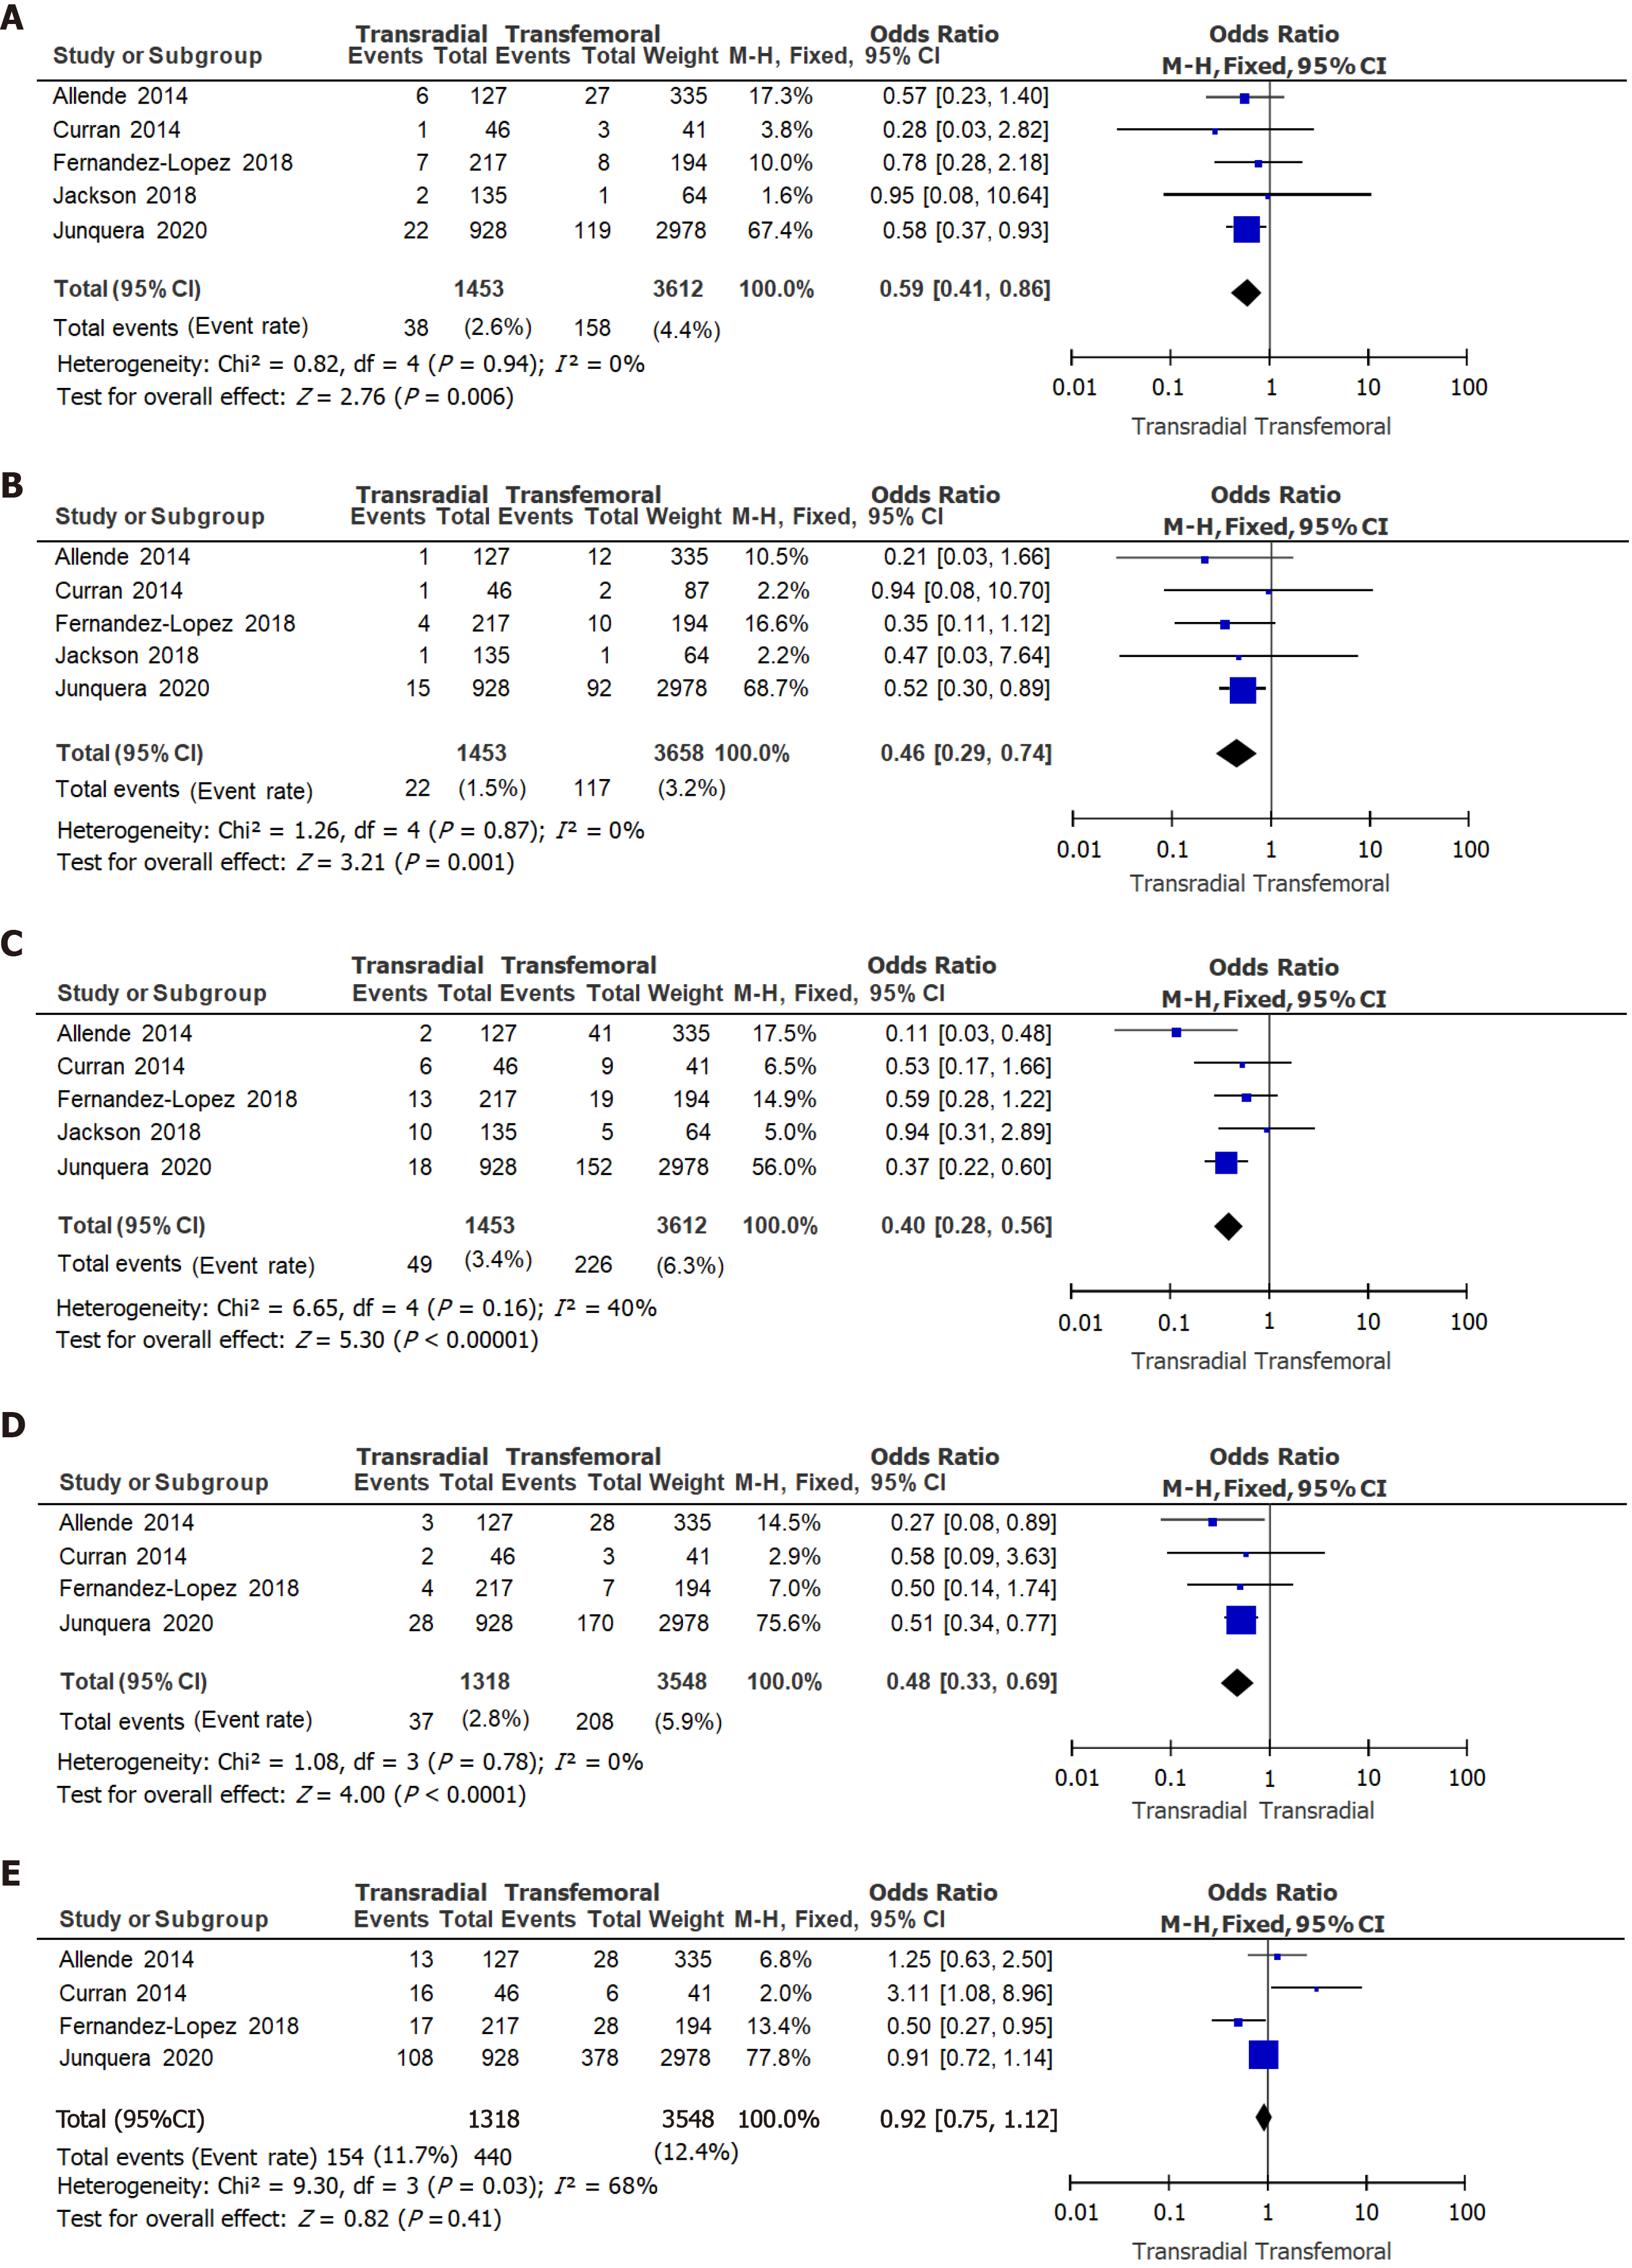
Figure 2 Forest plots for all primary access outcomes.
Transradial vs transfemoral secondary access. A: All primary access 30-d all-cause mortality; B: All primary access 30-d stroke/transient ischemic attack; C: All primary access 30-d major/life threatening bleeding complications; D: All primary access 30-d major vascular complications; E: All primary access 30-d minor vascular complications. CI: Confidence interval.
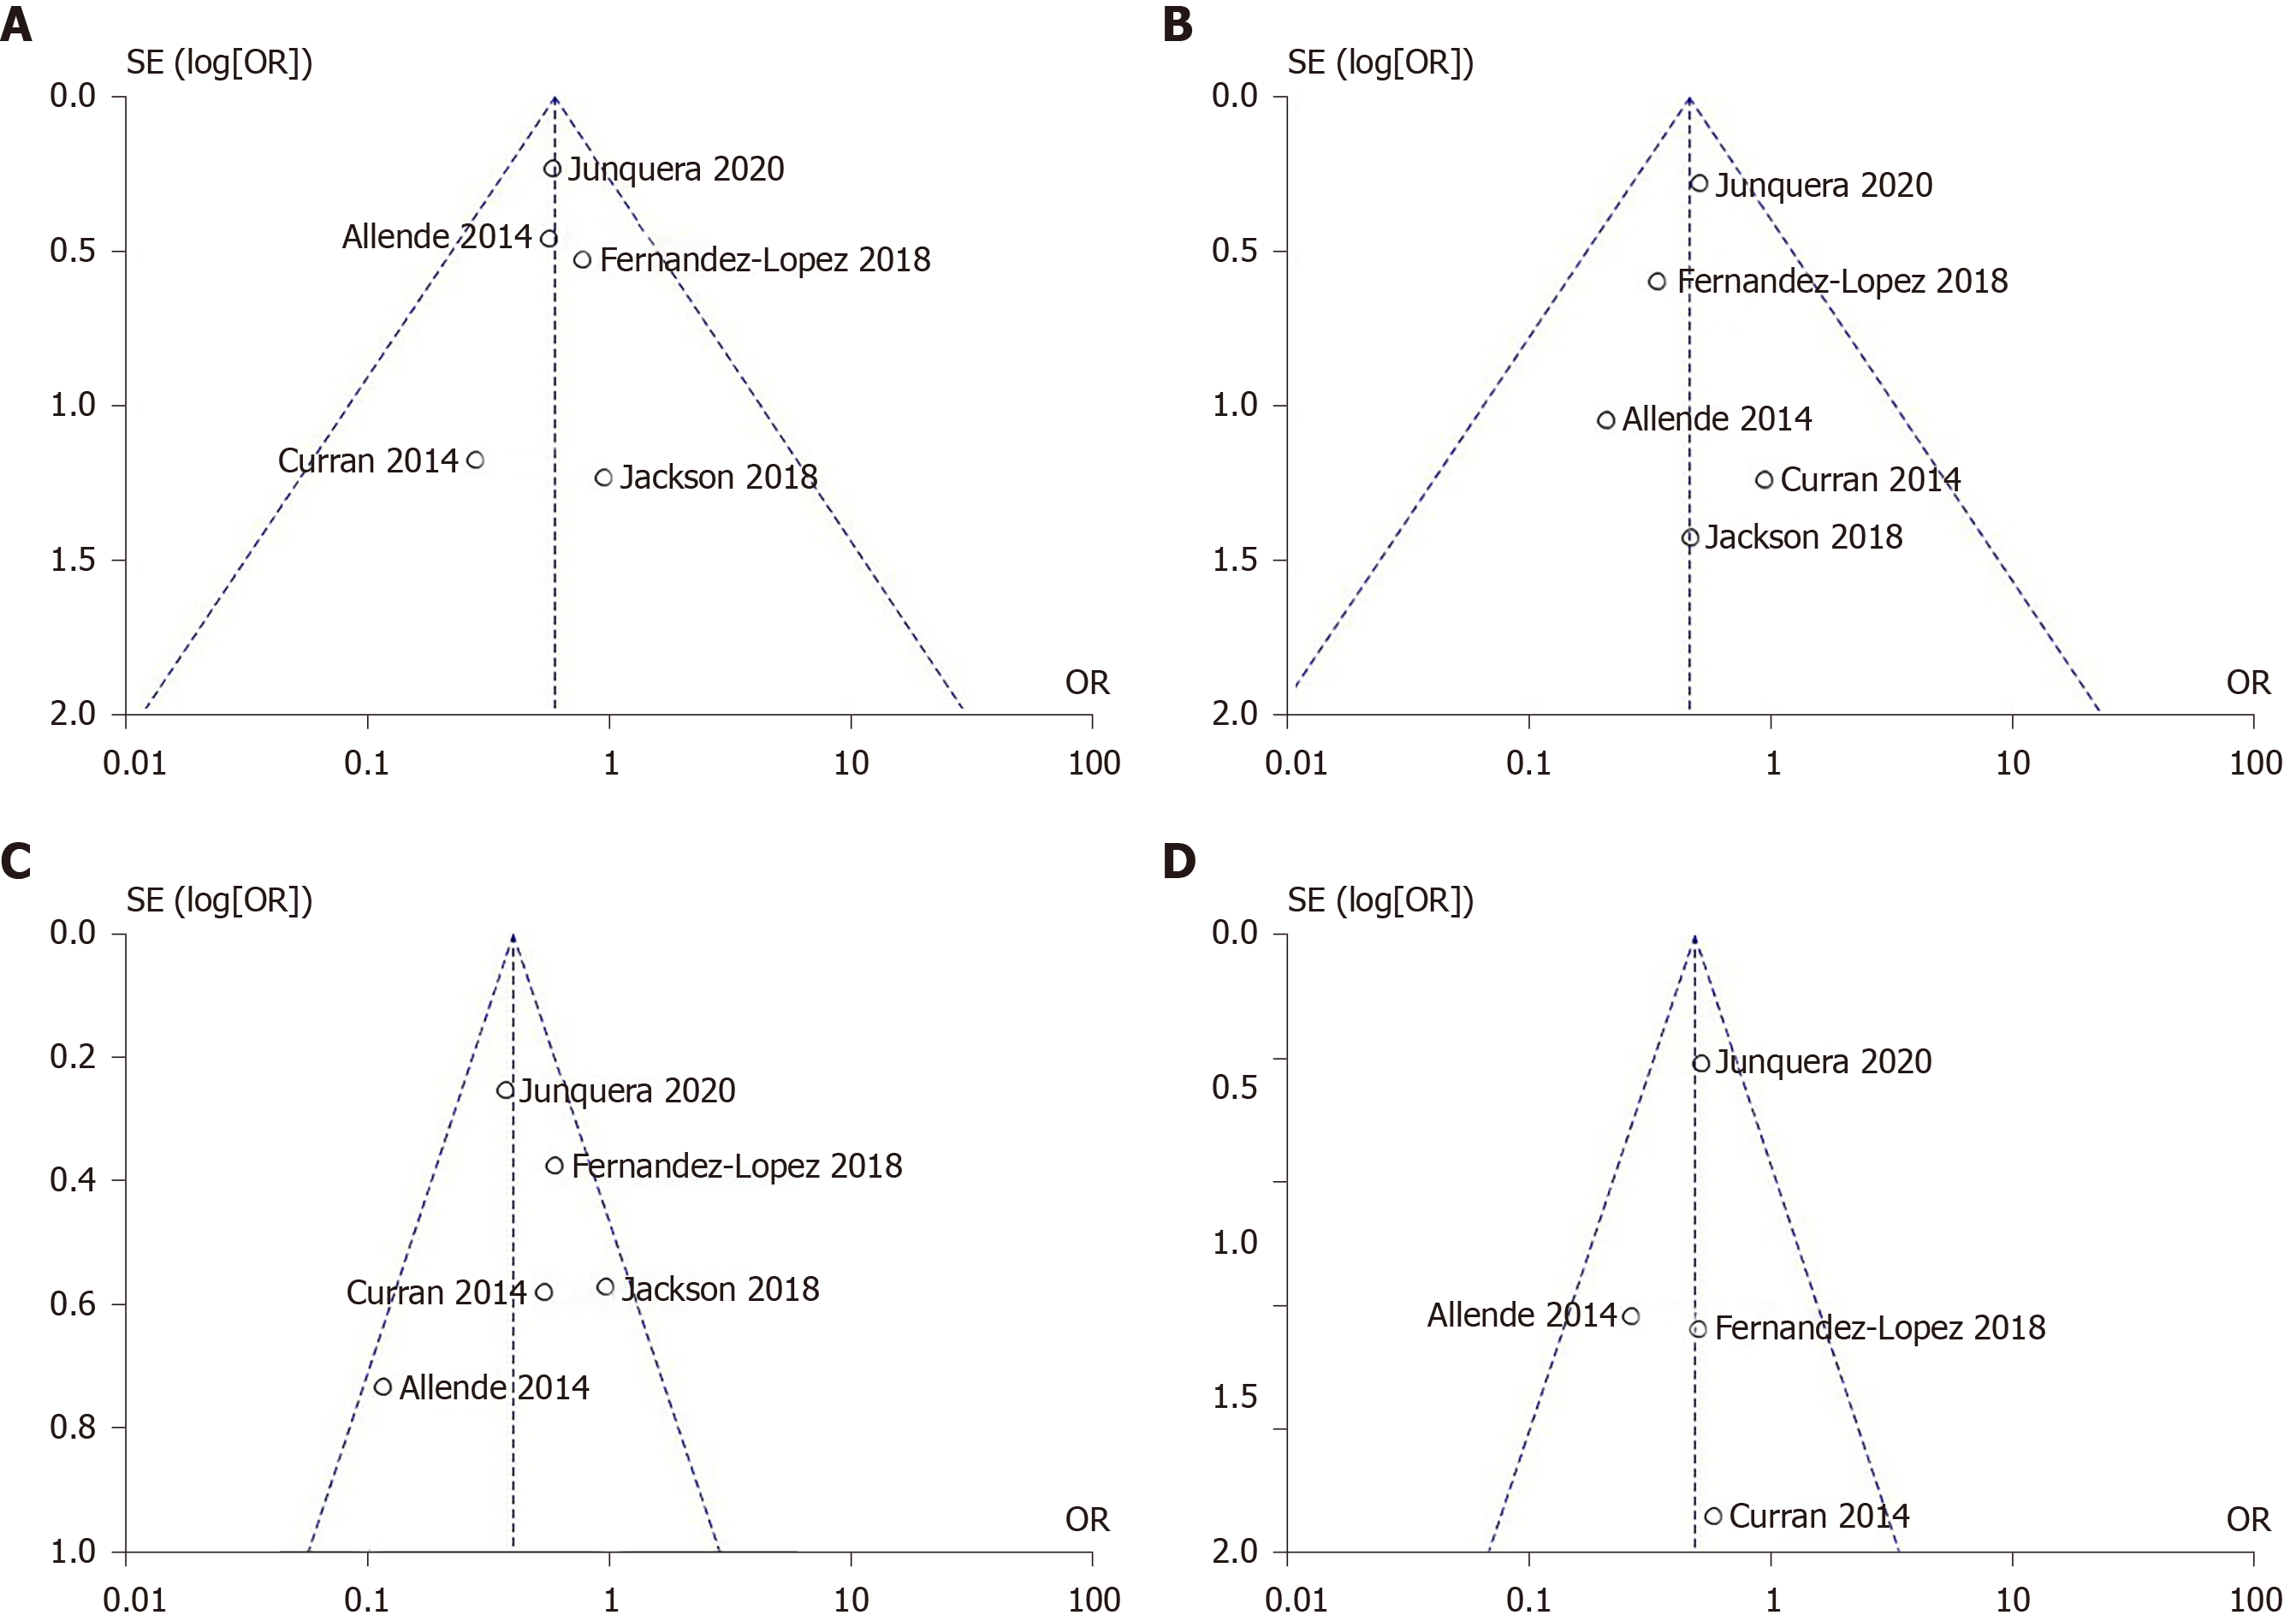
Figure 3 Funnel plot for all primary access outcomes.
Transradial vs transfemoral secondary access. A: 30-d all-cause mortality; B: 30-d stroke/transient ischemic attack; C: 30-d major/life threatening bleeding complications; D: 30-d major vascular complications. OR: Odds ratio.
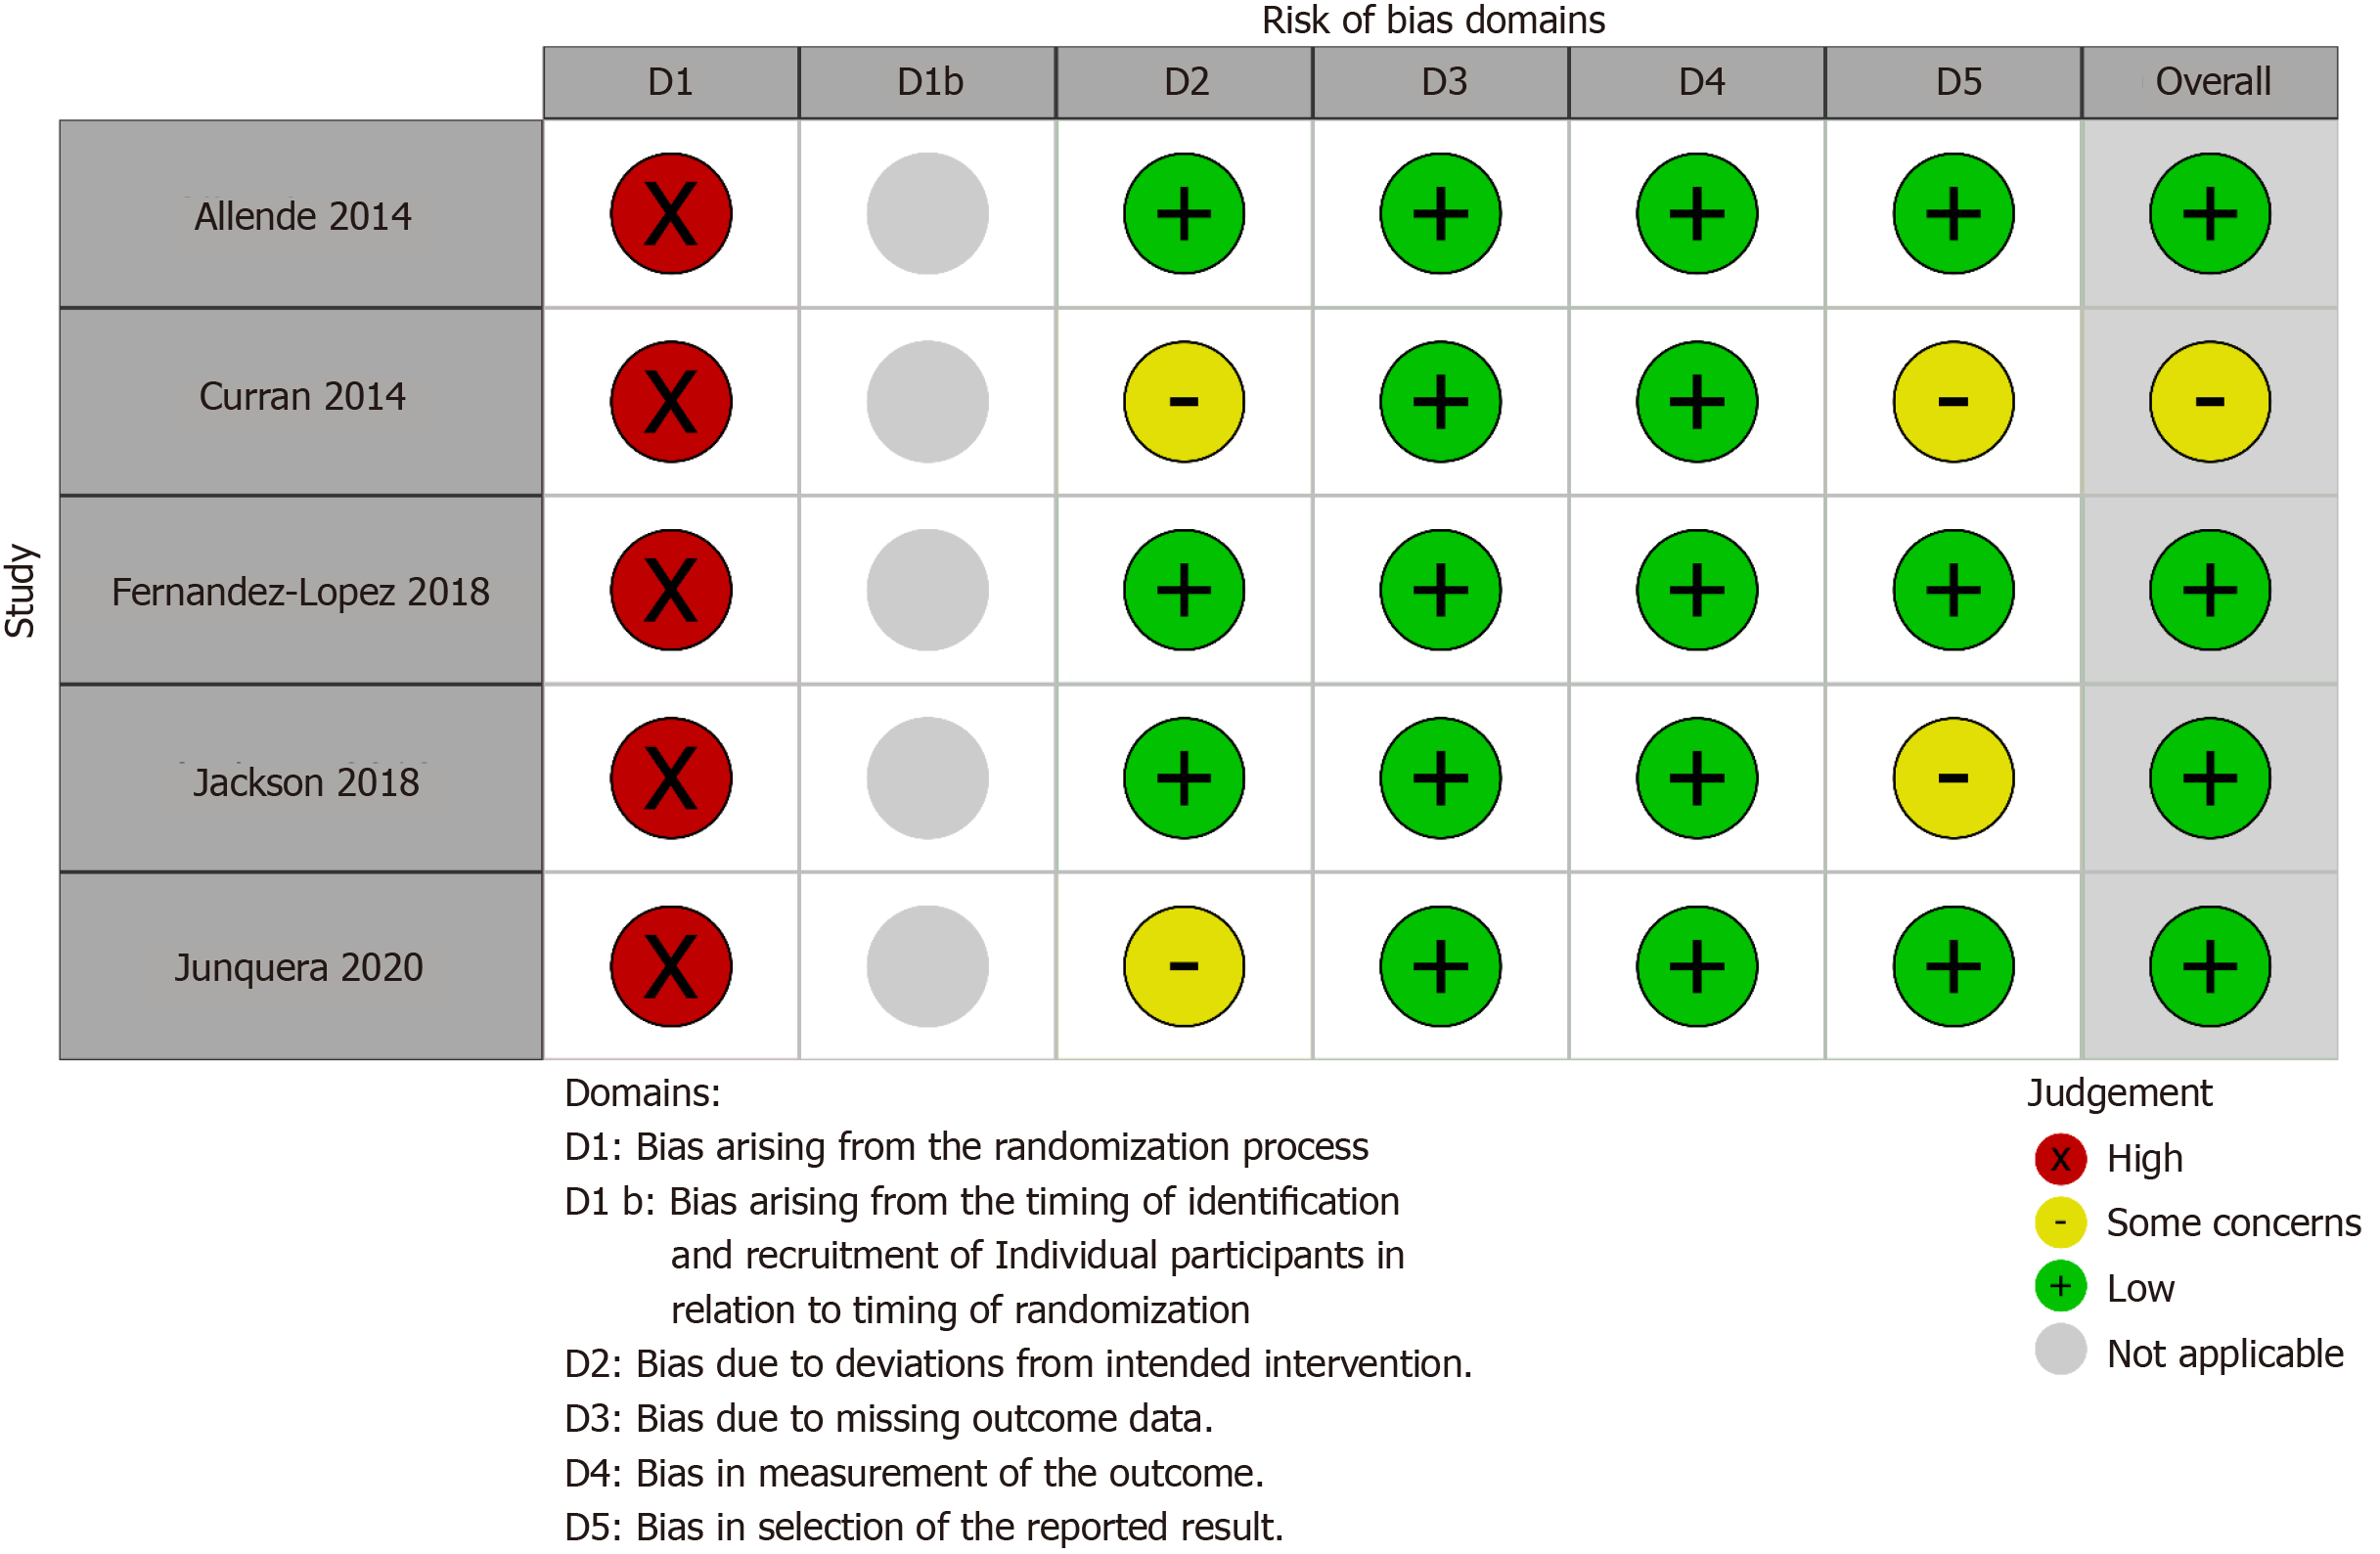
Figure 4 Traffic light plots of the domain-level judgements for each individual result to assess risk of bias.
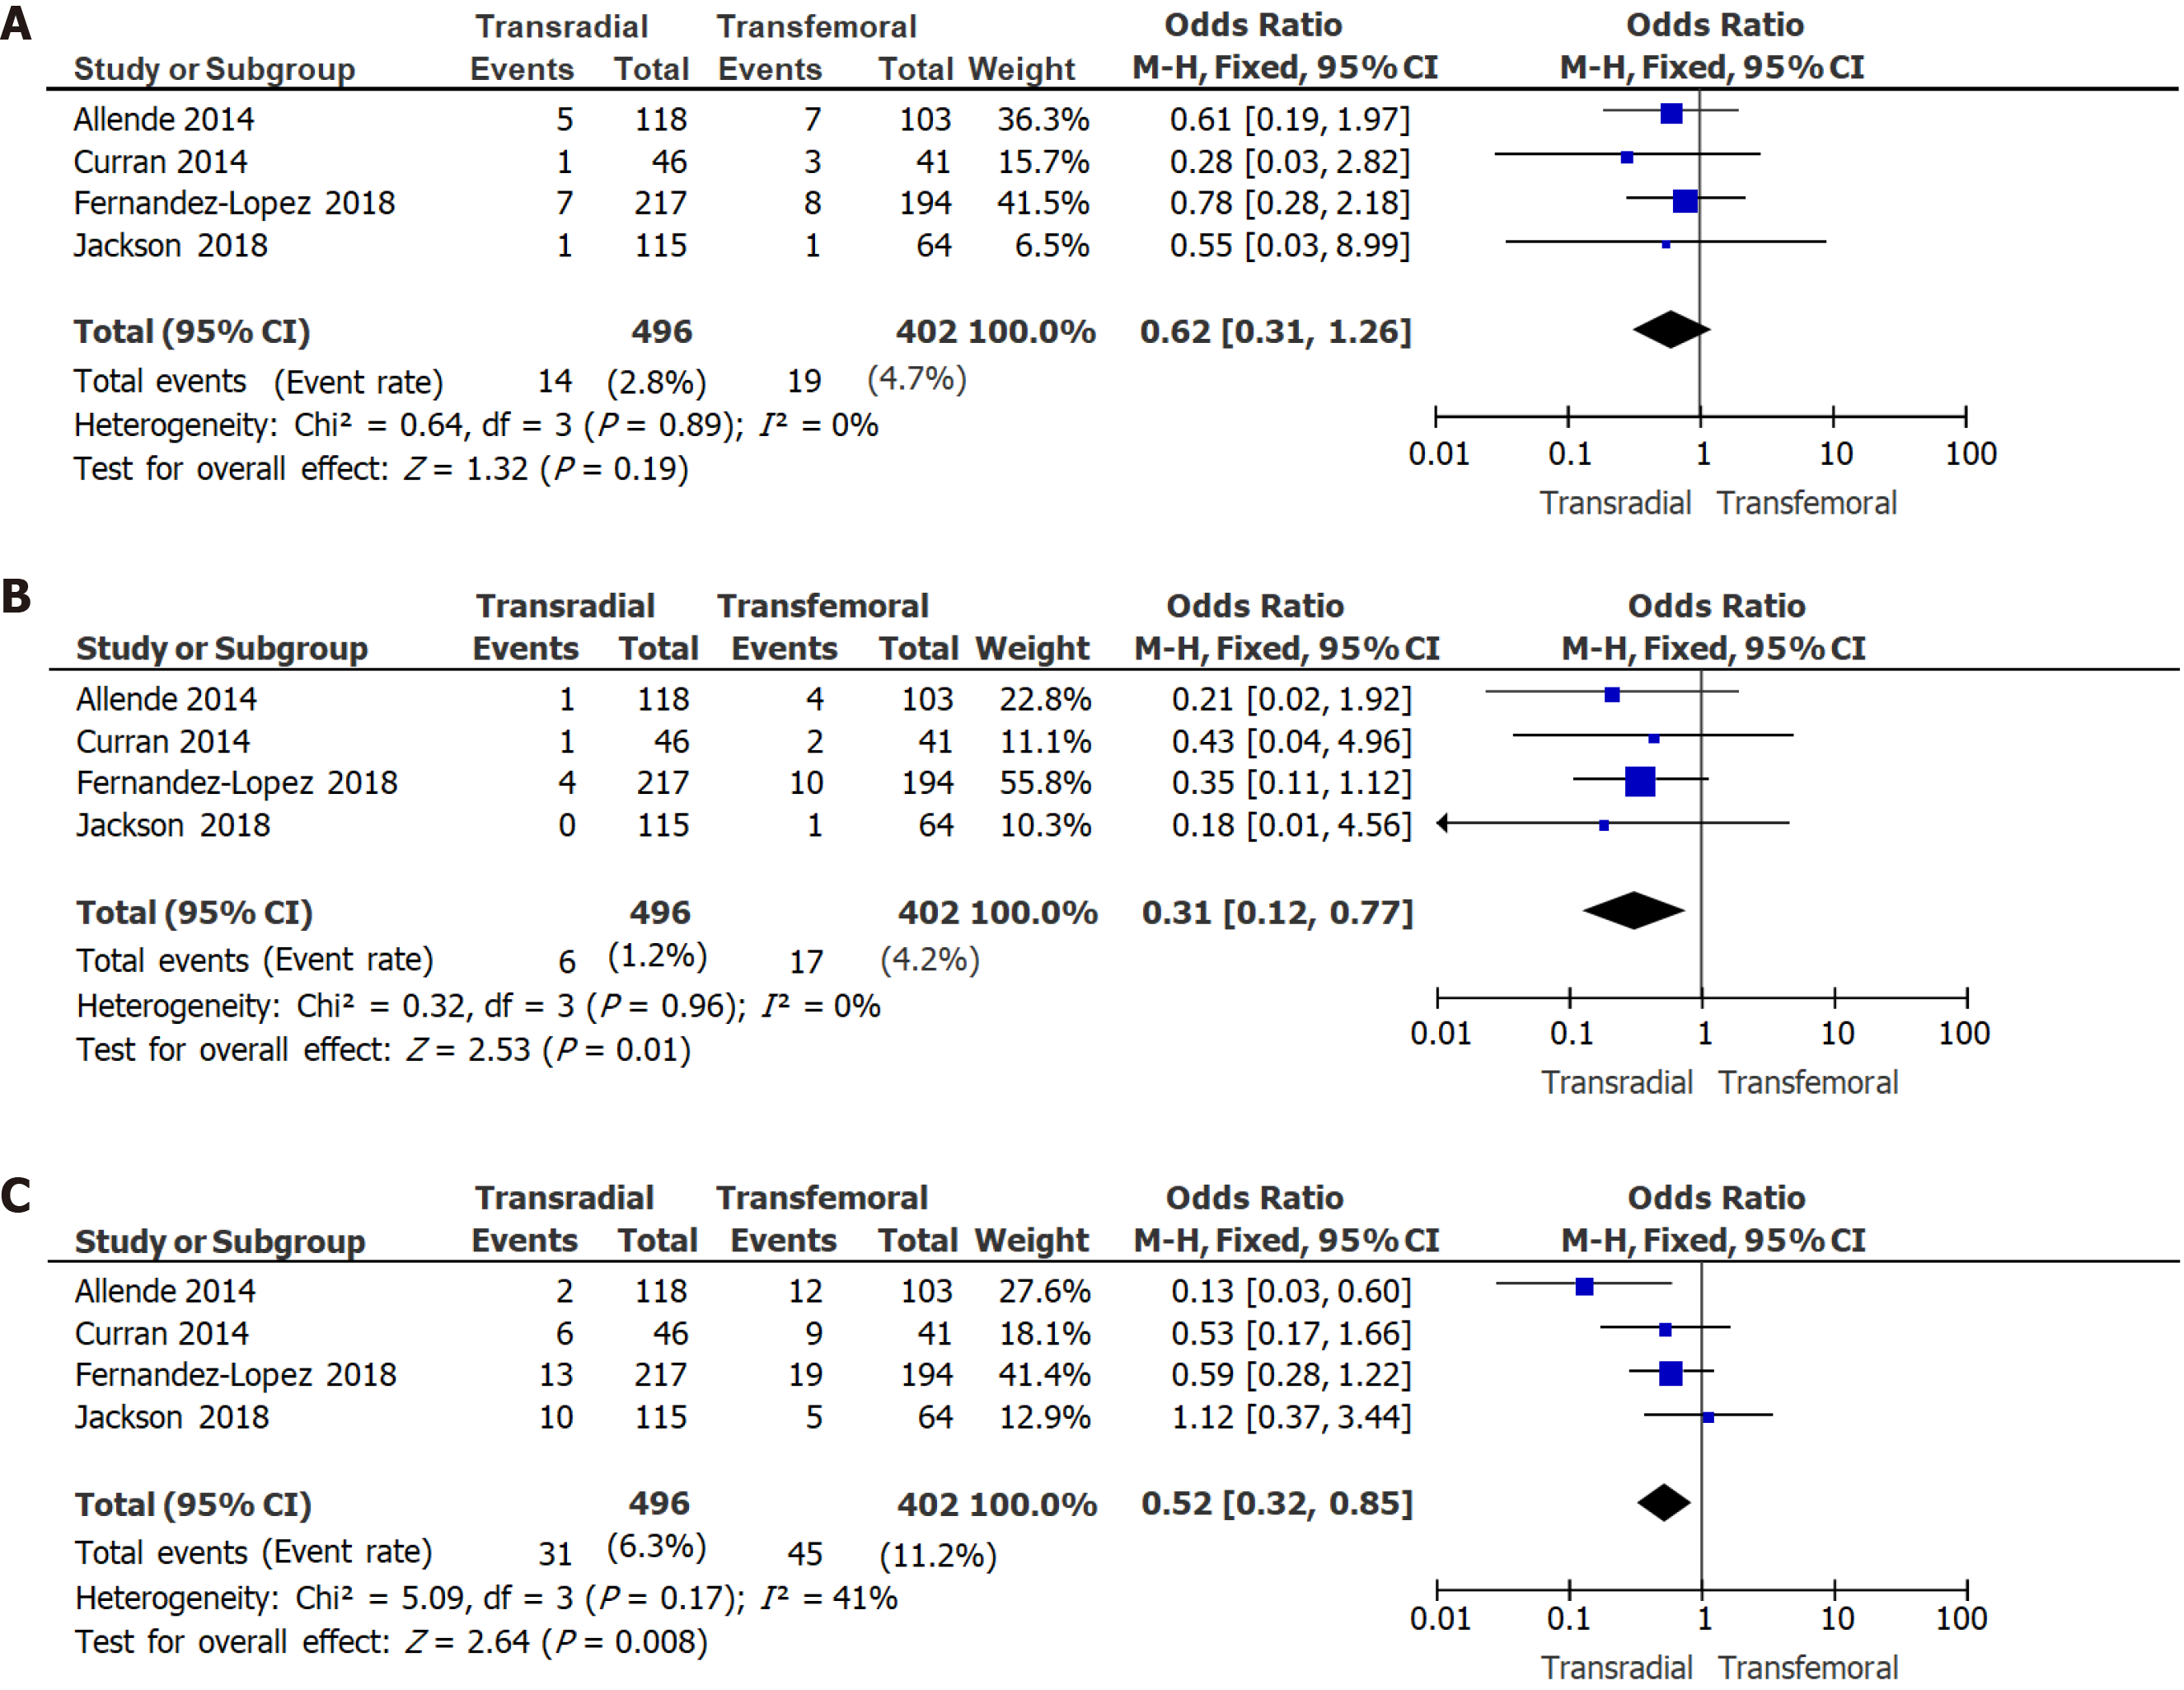
Figure 5 Forest plots for trans femoral primary access outcomes.
A: Transfemoral primary access (TFPA) 30-d all-cause mortality; B: TFPA 30-d stroke; C: TFPA 30-d major/life threatening bleeding complications. CI: Confidence interval.
- Citation: Radhakrishnan SL, Ho KKL. Transradial vs transfemoral secondary access outcomes in transcatheter aortic valve implantation: A systematic review and meta-analysis. World J Cardiol 2020; 12(11): 571-583
- URL: https://www.wjgnet.com/1949-8462/full/v12/i11/571.htm
- DOI: https://dx.doi.org/10.4330/wjc.v12.i11.571


