Copyright
©The Author(s) 2019.
World J Cardiol. Oct 26, 2019; 11(10): 236-243
Published online Oct 26, 2019. doi: 10.4330/wjc.v11.i10.236
Published online Oct 26, 2019. doi: 10.4330/wjc.v11.i10.236
Figure 1 Schematic representation of myograph setup for measuring isometric tension.
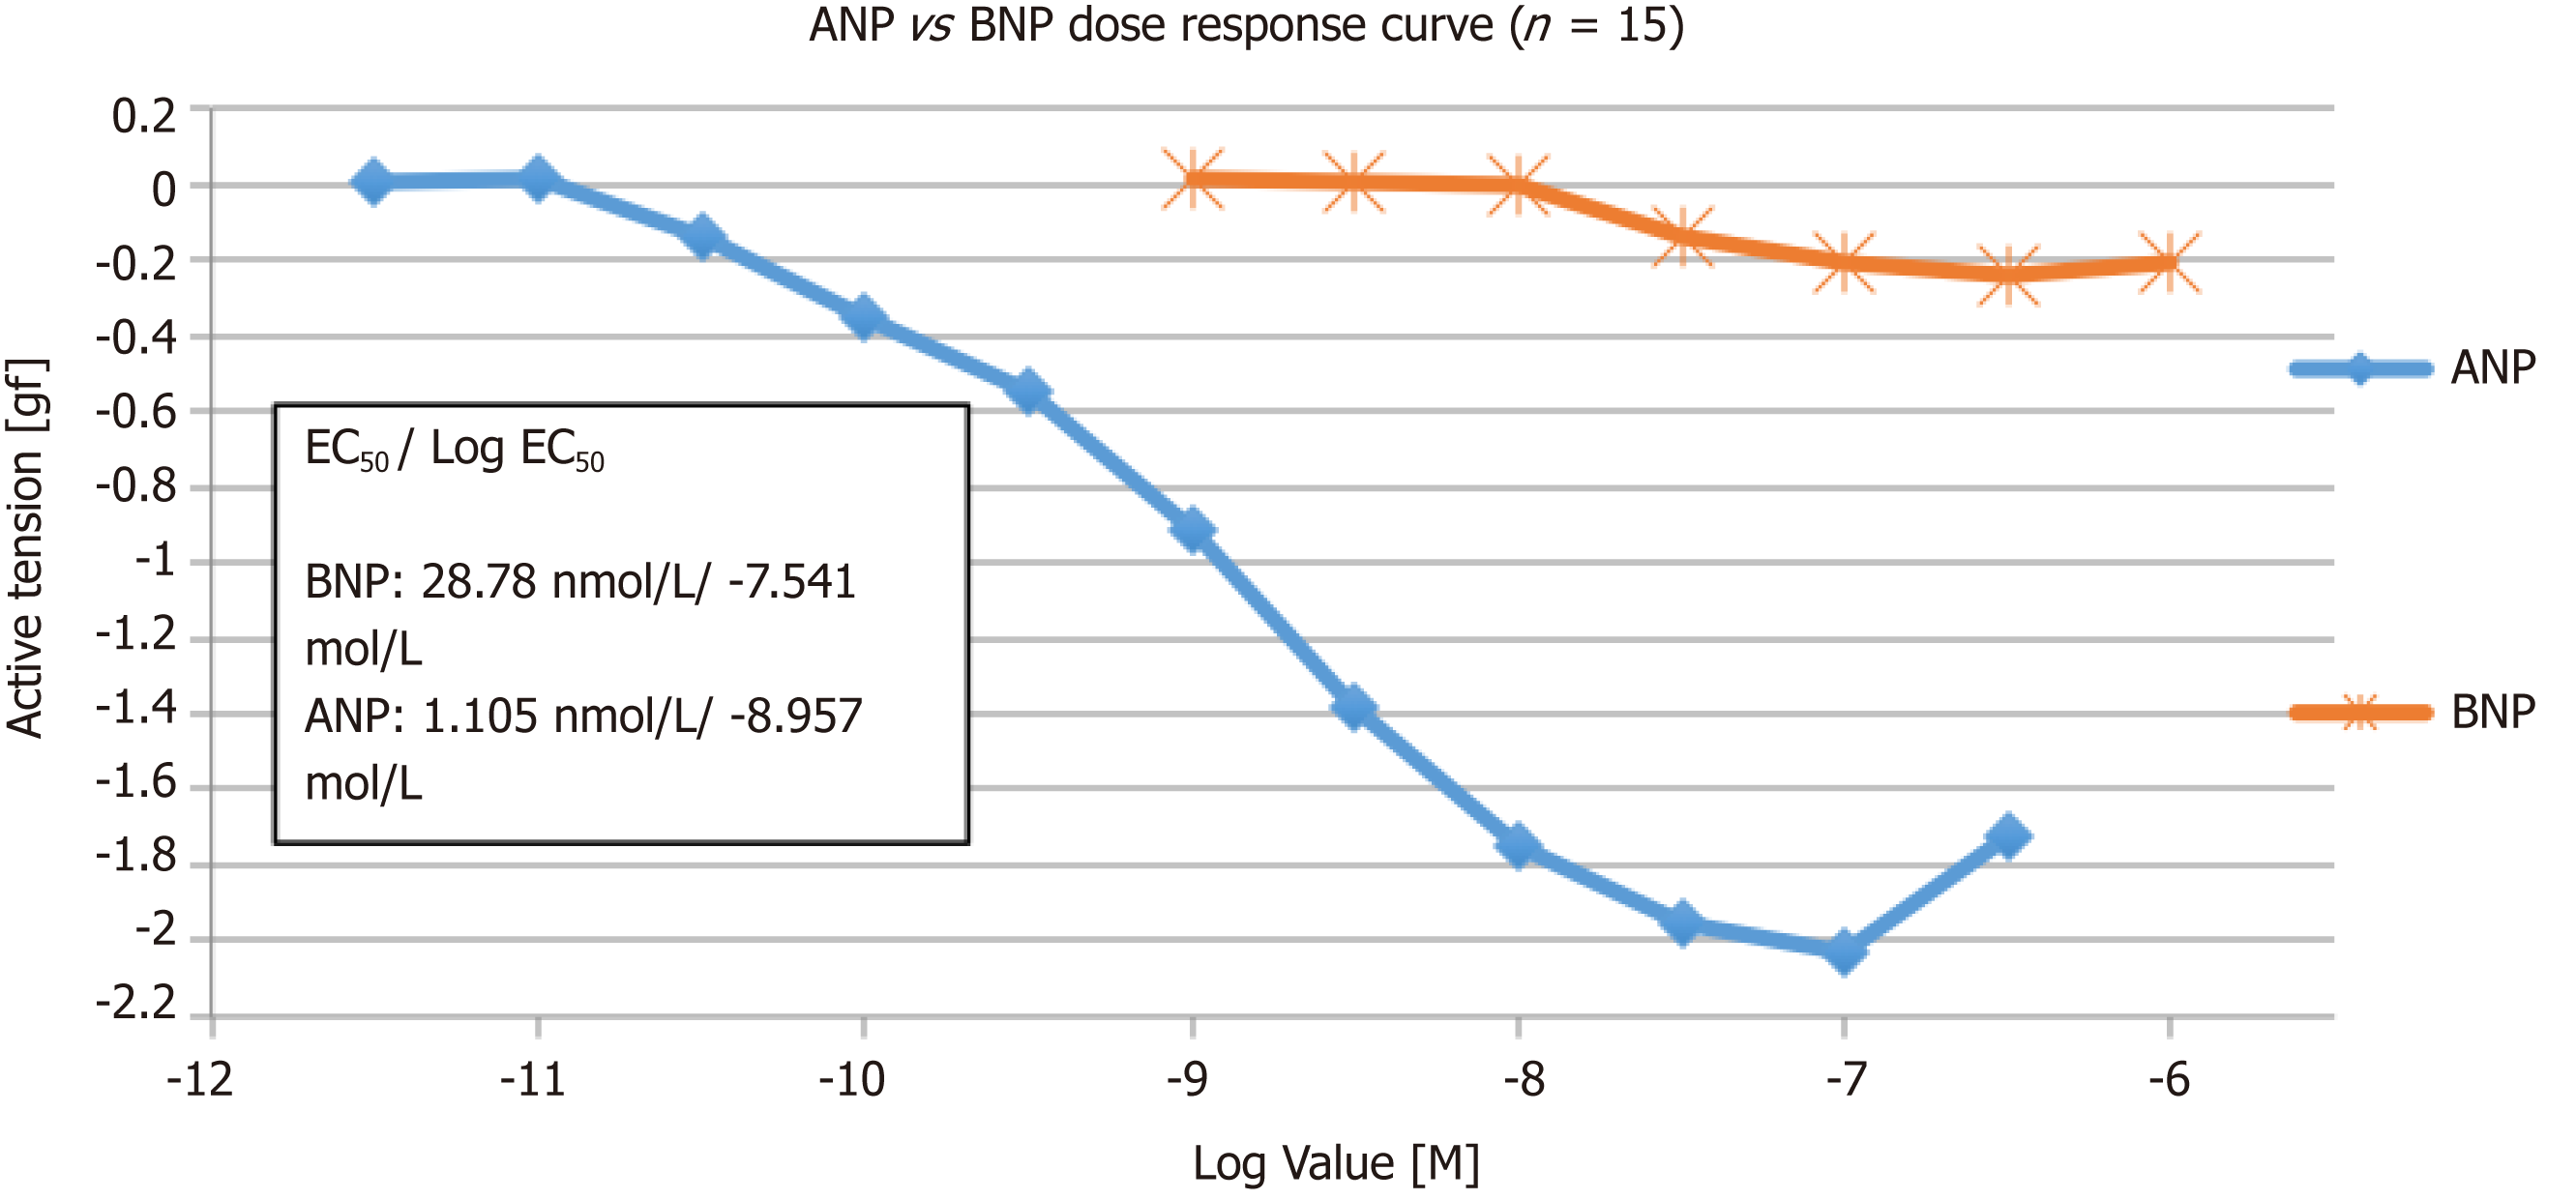
Figure 2 Cumulative concentration response curve to ANP and BNP (n = 15).
Findings show that both ANP and BNP cause vasodilation. ANP is more potent and efficacious than BNP. pEC50 of ANP and BNP were 8.96 ± 0.21 and 7.54 ± 0.18, respectively. ANP: Atrial natriuretic peptide; BNP: Brain natriuretic peptide.
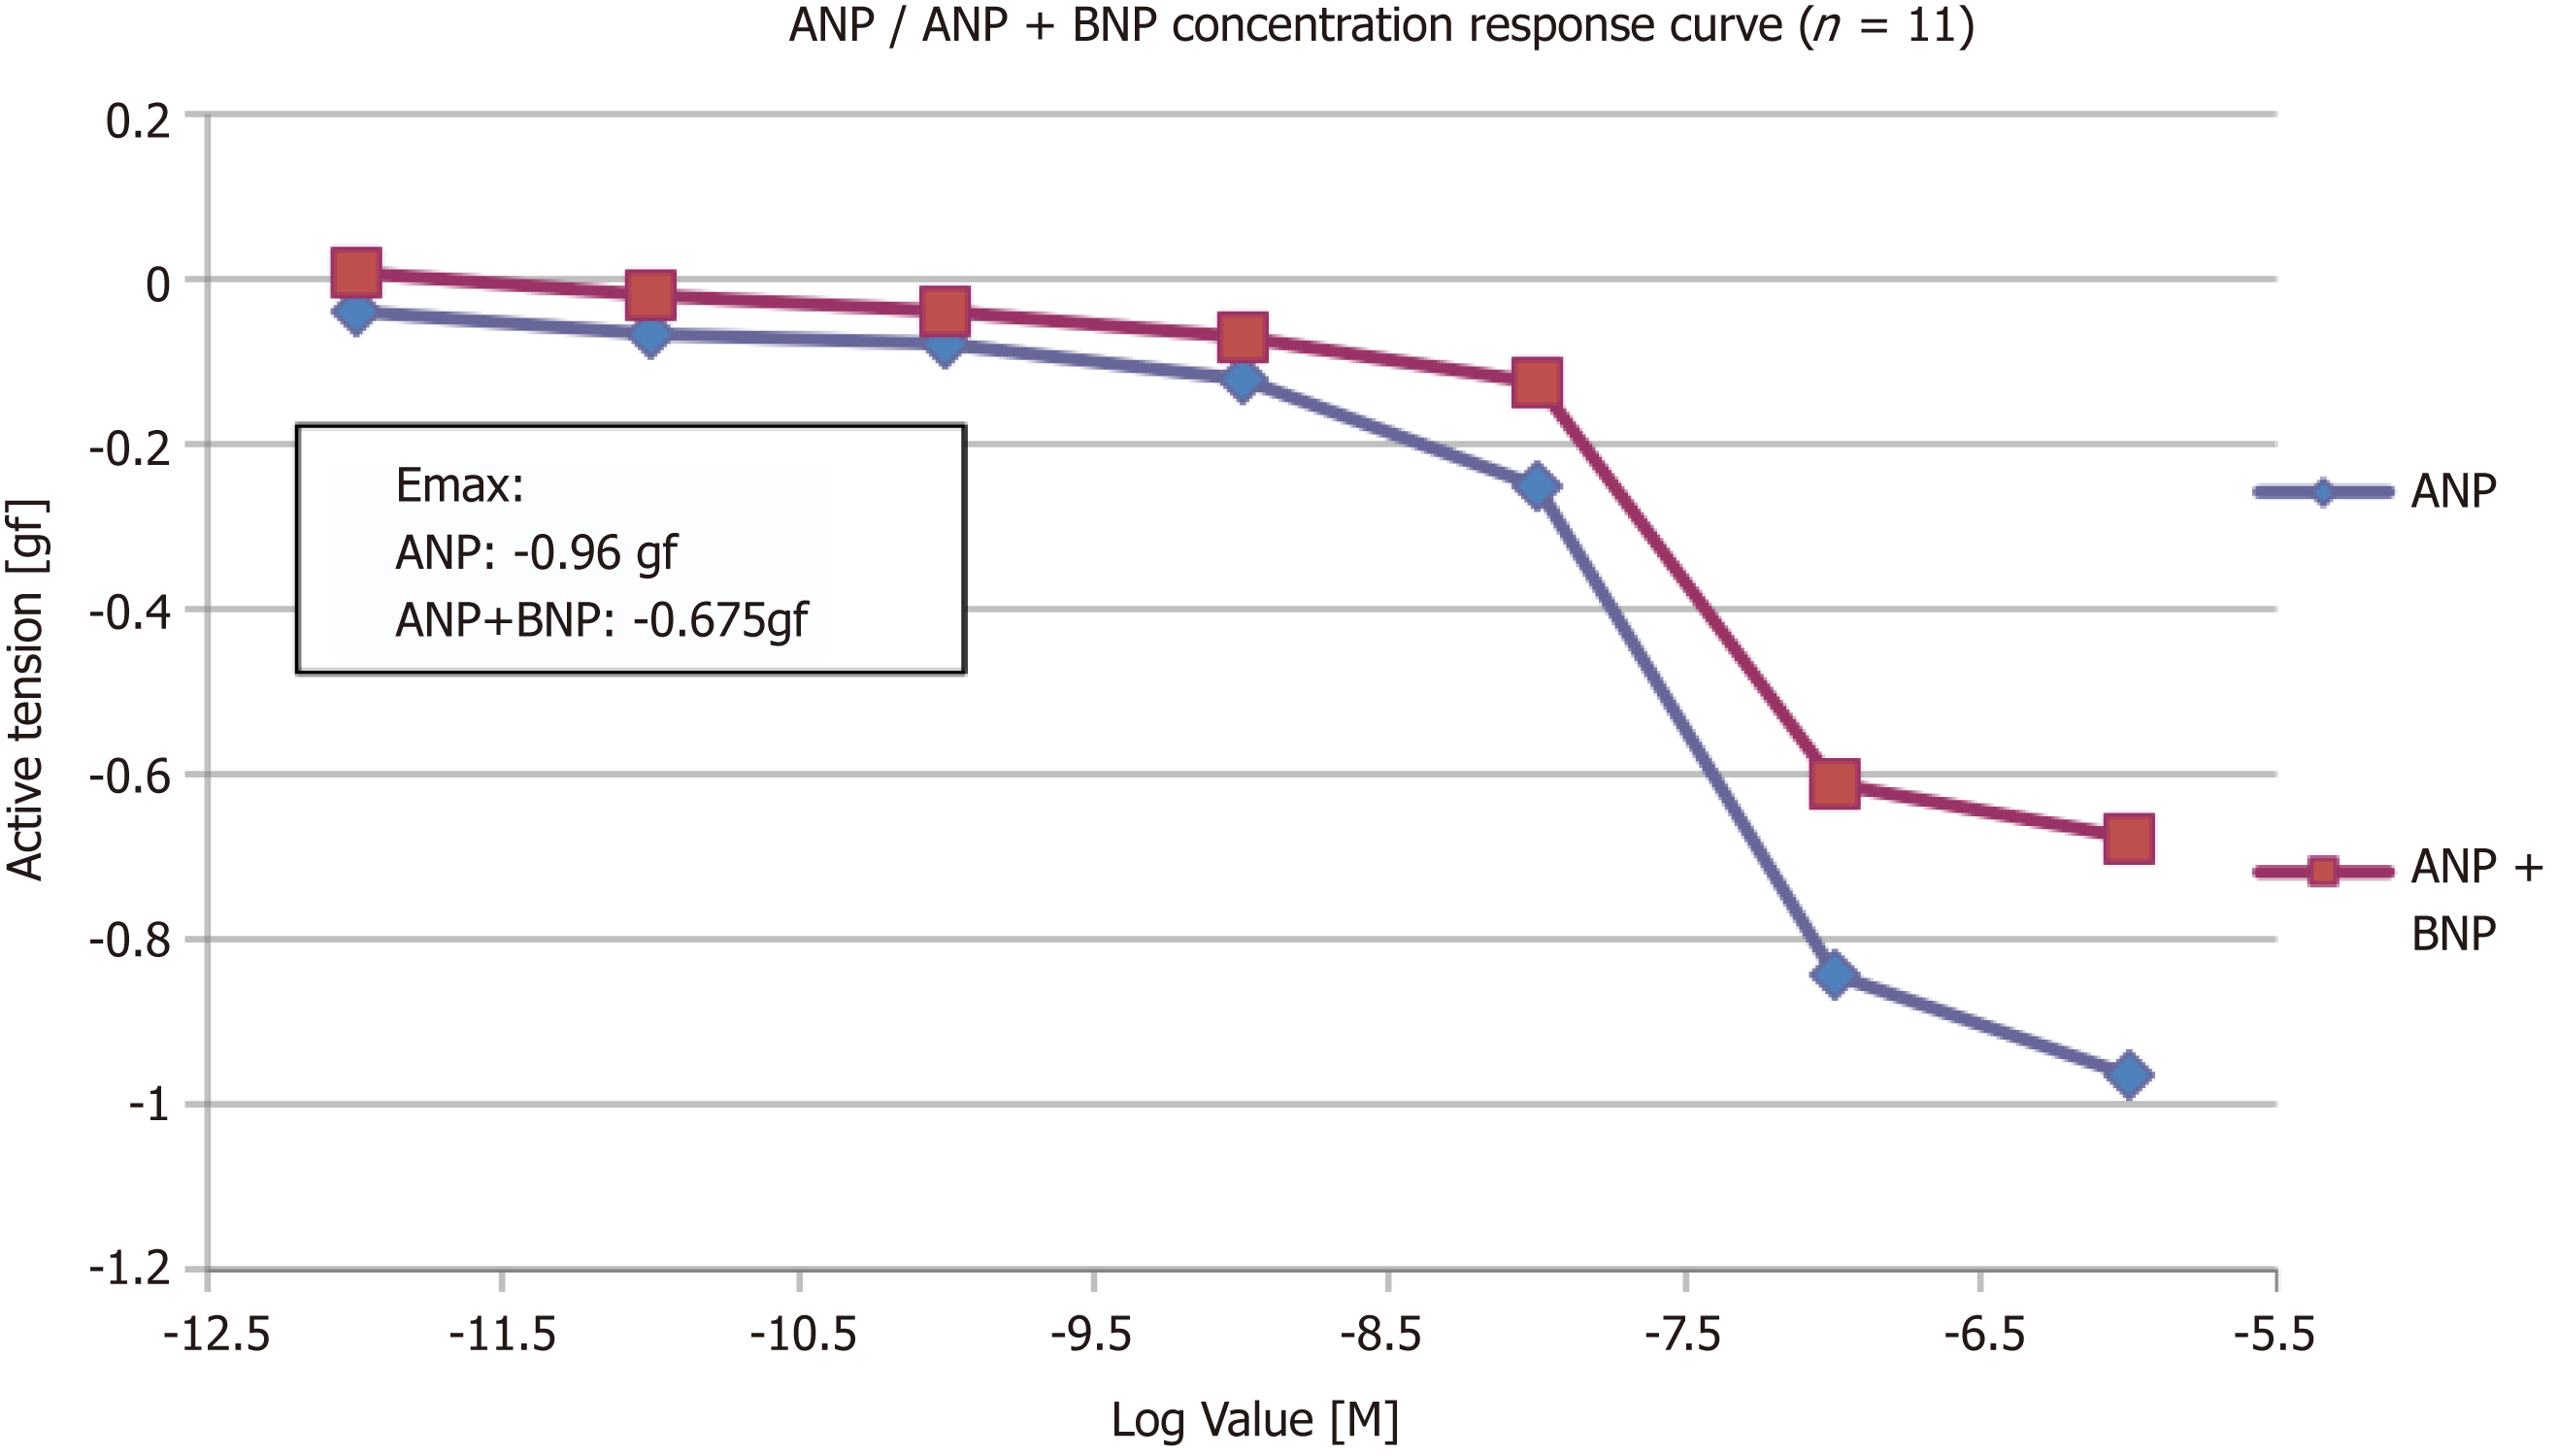
Figure 3 Concentration response curve to ANP alone and ANP + BNP (n = 11).
The Emax of ANP was 0.96 gf, which reduced to -0.675 gf when BNP was added. ANP: Atrial natriuretic peptide; BNP: Brain natriuretic peptide.
- Citation: Hussain A, Bennett RT, Tahir Z, Isaac E, Chaudhry MA, Qadri SS, Loubani M, Morice AH. Differential effects of atrial and brain natriuretic peptides on human pulmonary artery: An in vitro study. World J Cardiol 2019; 11(10): 236-243
- URL: https://www.wjgnet.com/1949-8462/full/v11/i10/236.htm
- DOI: https://dx.doi.org/10.4330/wjc.v11.i10.236


