Copyright
©The Author(s) 2018.
World J Cardiol. Nov 26, 2018; 10(11): 222-233
Published online Nov 26, 2018. doi: 10.4330/wjc.v10.i11.222
Published online Nov 26, 2018. doi: 10.4330/wjc.v10.i11.222
Figure 1 Box plot diagrams comparing reference area, minimum luminal area and % area stenosis parameters obtained from two-dimensional quantitative coronary angiography and frequency-domain optical coherence tomography imaging in the optical coherence tomography-guided percutaneous coronary intervention and optical coherence tomography-guided optimal medical therapy groups.
2D-QCA: Two-dimensional quantitative coronary angiography; FD-OCT: Frequency-domain optical coherence tomography; PCI: Percutaneous coronary intervention; OMT: Optimal medical therapy.
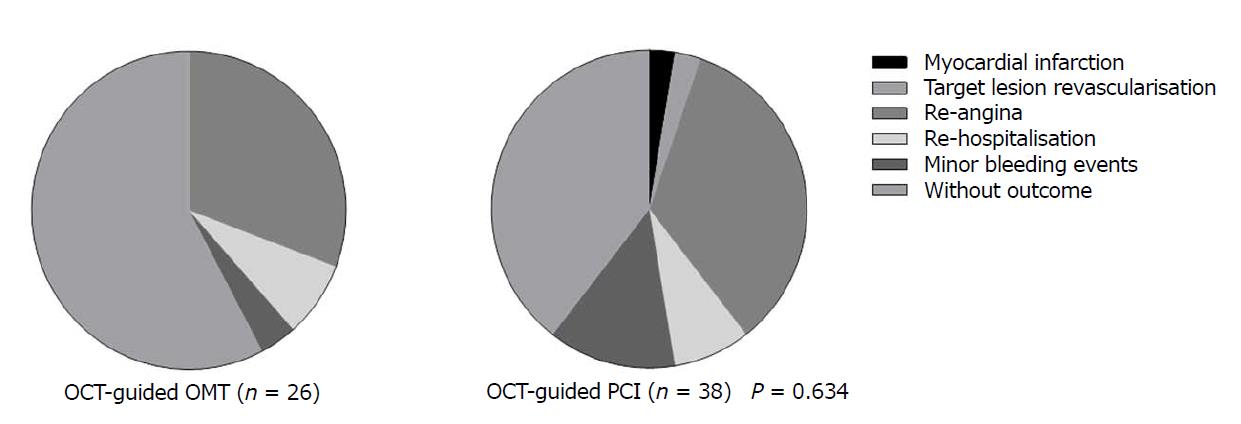
Figure 2 Pie charts comparing outcome at 12 mo between the optical coherence tomography-guided percutaneous coronary intervention and optical coherence tomography-guided optimal medical therapy groups.
OCT: Optical coherence tomography; PCI: Percutaneous coronary intervention; OMT: Optimal medical therapy.
- Citation: Khurwolah MR, Meng HY, Wang YS, Wang LS, Kong XQ. Safety and efficacy of frequency-domain optical coherence tomography in evaluating and treating intermediate coronary lesions. World J Cardiol 2018; 10(11): 222-233
- URL: https://www.wjgnet.com/1949-8462/full/v10/i11/222.htm
- DOI: https://dx.doi.org/10.4330/wjc.v10.i11.222


