INTRODUCTION
Alcoholic liver disease (ALD) patients frequently display evidence of iron overload[1-4]. Even moderate alcohol consumption can elevate serum iron indices[5]. Both iron and alcohol individually cause oxidative stress, which culminate in liver injury[6]. Hepcidin is an antimicrobial peptide, which is synthesized in the hepatocytes of the liver[7,8]. It plays a central role in the regulation of iron metabolism by inhibiting intestinal iron transport and the release of iron from macrophages[9,10]. Hepcidin achieves this by binding to the iron exporter ferroportin and inducing its internalization and degradation[11]. We have previously demonstrated that short-term and moderate alcohol exposure is sufficient to suppress hepcidin synthesis in the liver, which in turn causes an increase in the expression of intestinal iron transporters in vivo[12]. Vitamin E and N-acetylcysteine (NAC) administration in vivo abolishes the effect of alcohol on both liver hepcidin and duodenal iron transporters[12]. Vitamin E is a peroxyl radical scavenger and inhibits lipid peroxidation of cellular membranes[13]. NAC can either directly interact with reactive oxygen species (ROS) via its free thiol group or exert an indirect antioxidant effect as a precursor of reduced glutathione (GSH)[14,15]. Our findings therefore suggest that early changes in free radical scavenging and antioxidant defense mechanisms induced by alcohol are involved in the inhibition of hepcidin expression and alcohol-induced accumulation of iron.
Superoxide (O2•-) can initiate lipid peroxidation, and iron can interact with O2•- and hydrogen peroxide to yield the highly reactive hydroxyl radical[16,17]. The antioxidant enzyme, superoxide dismutase (SOD) catalyzes the dismutation of O2•- into hydrogen peroxide and oxygen[18-20]. Mammalian cells express three types of SOD with different subcellular localization and metal requirements. CuZnSOD (SOD1) is primarily localized in the cytoplasm, but is also found in mitochondria and the nucleus. MnSOD (SOD2) is strictly targeted to the mitochondrial matrix and SOD3 (EC-SOD) is secreted into the extracellular space. The effect of short-term alcohol intake on SOD expression and O2•- production in the liver is unclear. Chronic alcohol consumption however has been shown to elevate SOD2 expression in livers of monkeys and in sera of ALD patients[21,22]. Another study with liver biopsies from ALD patients reported a decrease in SOD1 expression, which correlated with liver fibrosis[23]. Rats with chronic ethanol ingestion also exhibited a decrease in liver SOD1 activity[24]. Delivery of adenoviral SOD1 into rats with chronic alcohol exposure has been reported to reduce alcohol-induced liver injury[25]. Kessova et al[26] reported necrosis, inflammation and apoptosis in the livers of knockout mice homozygous for Sod1 (Sod1-/-) following alcohol exposure. In patients with ALD or in other experimental models of ALD, alcohol induces lipid accumulation and elevates GSH in the liver[27,28]. In contrast, Sod1-/- mice exhibited milder lipid accumulation and decreased GSH in the liver compared to alcohol-fed wildtype control mice[26]. Curry-McCoy et al[29] also reported atypical responses to chronic alcohol consumption in Sod1-/- mice.
Mitochondria play a key role in iron biogenesis, and alcohol metabolism[30]. In mitochondria, O2•- is mainly produced from complex I (NADH-ubiquinone oxidoreductase) and complex III (ubiquinol-cytochrome oxidoreductase) of the electron transport chain. Both complex I and complex III have been shown to be involved in alcohol-mediated ROS production[31]. Separate clinical studies with French alcoholic cirrhosis patients suggested that a genetic polymorphism in the mitochondrial targeting sequence of SOD2, which enhances the mitochondrial import of SOD2, increases the risk for iron accumulation in hepatocytes and hepatocellular carcinoma[32,33]. However, another independent study with ALD patients did not find an association between SOD2 genetic polymorphisms and alcohol-induced oxidative stress or liver fibrosis[34]. Over expression of SOD2 by recombinant adenovirus has been reported to prevent liver injury induced by intragastric chronic alcohol feeding in rats[35]. In contrast, another study with mice has shown that elevated SOD2 expression worsens the effect of prolonged alcohol consumption but is protective when mice receive a single intragastric dose of alcohol (i.e., an alcohol binge)[36]. Larosche et al[37] have reported that an alcohol binge further decreases SOD2 activity in mice lacking one Sod2 allele but further increases it in mice overexpressing SOD2.
The effect of moderate short-term alcohol exposure on SOD2 expression and O2•- generation, and the role of O2•- in the regulation of hepcidin transcription in the liver requires further investigation. This study aims to address these questions by using knockout mice heterozygous for Sod2 and control mice as a model.
MATERIALS AND METHODS
Animal experiments
Animal experiments were approved by the Institutional Animal Care and Use committee at the University of Nebraska Medical Center. Manganese superoxide dismutase (MnSOD) knockout mice lacking the expression of Sod2 gene, on a C57BL/6 genetic background, were generated, as described[38]. We employed knockout mice heterozygous for Sod2 gene expression (Sod2+/-) and age-matched littermate control mice (LMC) expressing Sod2 gene on both alleles. All mice were maintained on a regular chow diet (Harlan Teklad 7012). For alcohol experiments, 6-8 wk old male mice were housed in individual cages and exposed to either 10% (w/v) ethanol in the drinking water or plain water (control) for 7 d, as described previously[12,39], at which time livers were collected. Before harvesting, livers were perfused with warm phosphate-buffered saline (PBS) buffer (pH 7.4) to eliminate blood. Livers isolated from mice were snap frozen in liquid nitrogen and stored at -80 °C until further use. For electron paramagnetic resonance (EPR) spectroscopy, fresh livers were subjected to a standard perfusion protocol to isolate viable hepatocytes, as described below.
Liver perfusion
To isolate viable hepatocytes, mice livers were perfused, as described[40]. Briefly, livers were perfused (7 mL/min) via the inferior vena cava with warm and gassed KRH buffer (250 mmol/L HEPES, 1149 mmol/L NaCl, 45 mmol/L KCl, 10 mmol/L KH2PO4, 0.5 mmol/L EGTA, pH 7.6) followed by KRH buffer containing 2 mmol/L Ca2+ and collagenase (0.214 mg/mL, Sigma C5138). Hepatocytes, isolated by centrifugation (50 g, 2 min), were washed thrice with ice-cold KRH buffer containing 2 mmol/L Ca2+ and 2% BSA. Dead hepatocytes were discarded by Percoll centrifugation (129 g, 5 min 4 °C) and cell viability was determined by Trypan Blue staining. Hepatocytes with ≥ 78% viability were employed for experiments.
Electron paramagnetic resonance spectroscopy
Electron paramagnetic resonance (EPR) was used to measure total cellular O2•- levels in hepatocytes isolated from the livers of Sod2+/- and control littermate mice fed either with plain (control) or ethanol-supplemented water, as described above. 0.5 × 10⁶ cells were incubated with the cell permeable and O2•- sensitive spin probe, 1-hydroxy-3-methoxycarbonyl-2,2,5,5-tetramethylpyrrolidine (CMH, 200 μmol/L) for 15 min at 37 °C in EPR buffer (99 mmol/L NaCl, 4.69 mmol/L KCl, 2.5 mmol/L CaCl2, 1.2 mmol/L MgSO4, 25 mmol/L NaHCO3, 1.03 mmol/L KH2PO4, 5.6 mmol/L D(+)-glucose, 20 mmol/L Na-Hepes, pH 7.4) freshly supplemented with metal chelators, 5 μmol/L diethyldithiocarbamic (DETC) acid (sodium salt) and 25 μmol/L deferoxamine methanesulfonate. 50 μL of cell suspension was loaded into a glass capillary tube, which was then inserted into the capillary holder of a Bruker e-scan EPR spectrometer. The following EPR settings were used for all experiments: field sweep width, 60 G; microwave frequency, 9.75 kHz; microwave power, 21.90 mW; modulation amplitude, 2.37 G; conversion time, 10.24 ms; time constant, 40.96 ms. The EPR amplitude, which is directly proportional to the levels of O2•- in the sample, were normalized to the number of hepatocytes in each sample.
Flow cytometry with MitoSOX
MitoSOX Red fluorescence was used to measure mitochondrial-localized O2•- levels in hepatocytes isolated from the livers of Sod2+/- and control littermate mice fed either with plain water (control) or ethanol, as described above. 0.5 × 10⁶ viable cells were incubated with 2 μmol/L MitoSOX™Red dye (Invitrogen) or buffer for 10 min in a 37 °C shaker in the dark. Samples were washed to eliminate free dye and MitoSOX Red fluorescence was collected using a FACSCalibur flow cytometer and analyzed with Cell Quest Pro (BD Biosciences, San Jose, CA, United States). Standard instrument configuration was used as follows: excitation at 488 nmol/L and the fluorescence collected at 585/42 (FL2) and 670LP (FL3) channel. Analysis of the FL2 signal is presented here and data are expressed as mean channel number compared to an unstained (buffer control) sample.
RNA isolation, cDNA synthesis, real-time quantitative polymerase chain reaction, and reverse transcription-polymerase chain reaction analysis
RNA isolation, cDNA synthesis and real-time quantitative polymerase chain reaction (PCR) were performed, as published previously[12,41]. Primers (sense 5’-ACTCGGACCCAGGCTGC-3’; antisense 5’-AGATAGGTGGTGCTGCTCAGG-3’) and Taqman fluorescent probe [5’ 6-(FAM)-TGTCTCCTGCTTCTCCTCCTTGCCA-3’ (TAMRA-Q)] flanking about 70 base pairs of open reading frame sequences of mouse hepcidin genes, Hamp1 and Hamp2 were designed by the Primer Express 1.5 program (Applied Biosystems). Glyceraldehyde-3-phosphate dehydrogenase (gapdh) gene probe was used as the endogenous control. For reverse transcription-polymerase chain reaction (RT-PCR), cDNA was amplified using primers for Sod1 (sense 5’-ATGGCGATGAAAGCGGTGT-3’; antisense 5’-CCTTGTGTATTGTCCCCATACTG-3’), Sod2 (sense 5’-CAGACCTGCCTTACGACTATGG-3’; antisense 5’-CTCGGTGGCGTTGAGATTGTT-3’), or gapdh (sense 5’-GTGGAGATTGTTGCCATCAACGA-3’; antisense 5’-CCCATTCTCGGCCTTGACTGT-3’) by Taq polymerase for 23 cycles (95 °C for 1 min, 60 °C for 30 s, 72 °C for 30 s and a final extension at 72 °C for 5 min) following the initial denaturation step at 95 °C for 5 min. PCR products separated on 2% agarose gel were stained with ethidium bromide and visualized under UV transillumination.
Mitochondria and cell lysate preparation, and western blotting
To isolate mitochondria-enriched fractions, mice livers were homogenized in ice-cold mitochondria buffer [20 mmol/L Hepes, 10 mmol/L KCl, 1.5 mmol/L MgCl2, 1 mmol/L EGTA, 1 mmol/L EDTA, 1 mmol/L DTT, 250 mmol/L Sucrose, 0.1 mmol/L PMSF, pepstain A, protease inhibitor cocktail (Sigma P2714), pH 7.5] and centrifuged at 800 g for 10 min at 4 °C. The resultant supernatant was centrifuged at 16000 g for 20 min at 4 °C. The pellet was collected and washed twice in ice-cold mitochondria buffer by centrifugation (16000 g for 20 min). The washed pellet fraction was subsequently lysed in Buffer B [10 mmol/L Tris-HCl, 5 mmol/L CaCl2, 0.5% Triton X-100, 0.1 mmol/L PMSF, pepstain A, protease inhibitor cocktail (Sigma P2714), pH 8.0] on ice for 10 min The lysates were centrifuged briefly (100 g, 3 min, 4 °C) to discard cellular debris and the supernatants were kept frozen until further use. To isolate total cell lysates, mice livers were homogenized in a cell lysis buffer [10 mmol/L Tris-HCl, 100 mmol/L NaCl, 5 mmol/L EDTA, 10% glycerol, 0.1 mmol/L PMSF, pepstain A, protease inhibitor cocktail (Sigma P2714), phosphatase inhibitor cocktail A (Santa Cruz, sc-45044), 1% Triton-X-100, (pH 7.4)]. The homogenates were subsequently incubated on ice for 20 min and centrifuged (3000 g) for 5 min at 4 °C. Supernatants were employed for western blotting. Anti-MnSOD (SOD2), anti-CuZnSOD (SOD1), anti-cytochrome C, anti-COX4, and anti-gapdh antibodies were obtained commercially (Santa Cruz). Standard Western blots analysis was performed, as described previously[41,42].
Caspase-3 assay
Mice livers were homogenized in lysis buffer (20 mmol/L KCl, 20 mmol/L MOPS, 2 mmol/L MgCl2, 1 mmol/L EDTA, 0.5% Triton X-100, pH 7.2) and incubated on ice for 30 min. Following centrifugation (14500 g, 30 min, 4 °C), the supernatants were collected and used for the assay. Caspase-3 enzyme activity was measured by using Ac-DEVD-AMC caspase-3 fluorogenic substrate (BD Biosciences) and quantifying the amount of AMC released with a Perkin-Elmer Luminescence Spectrophotometer LS 55. Commercially obtained free AMC (Sigma) was used to create a standard curve. Caspase-3 enzyme activity is expressed as nmoles of AMC released per mg of protein. The protein concentrations in liver lysates were determined by the Bradford protein assay.
Statistical analysis
Statistical analysis of differences in treatment groups was performed using the parametric Anova, non-parametric Mann-Whitney tests, and unpaired two-tailed Student’s t test. P value less than 0.05 was considered statistically significant.
RESULTS
Hepatic Sod1 and Sod2 mRNA expression in MnSOD (Sod2) knockout mice
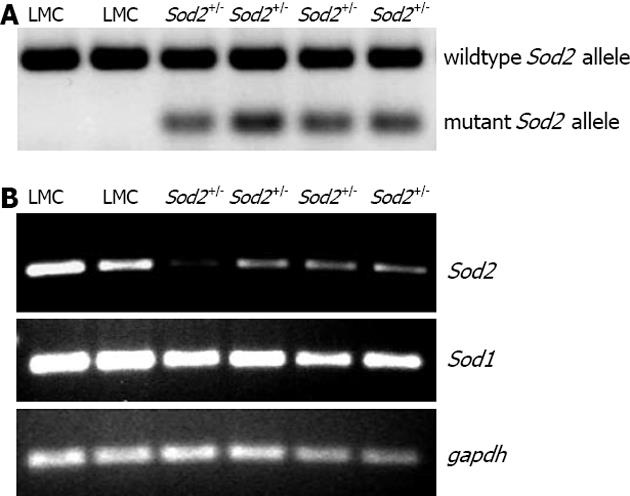
We have previously shown the involvement of acute alcohol-induced oxidative stress in the regulation of hepcidin transcription in the liver in vivo[12]. In order to study the effect of mitochondrial-produced O2•- in this process, we employed Sod2 transgenic mice (see methods). Knockout mice homozygous for Sod2 (Sod2-/-) are not viable while heterozygous (Sod2+/-) mice, which express 48%-55% of mitochondrial MnSOD activity, are viable[38]. Sod2+/- mice expressing both mutant and wildtype Sod2 alleles, and littermate control (LMC) mice expressing only wildtype Sod2 allele were identified by genotyping, as described (Figure 1A)[38]. To determine the hepatic Sod1 and Sod2 gene expression levels, hepatocytes from the livers of Sod2+/- and LMC mice were isolated by a standard perfusion protocol, as described in Materials and Methods. The expression level of Sod2 mRNA, in Sod2+/- mice was significantly lower than that in LMC (control) mice, as determined by RT-PCR (Figure 1B). In contrast, the mRNA expression level of Sod1 in Sod2+/- mice was similar to that in LMC mice (Figure 1B). RT-PCR analysis with the whole liver tissues isolated from Sod2+/- and LMC mice yielded similar results (data not shown).
Figure 1 Genotyping and expression.
A: Genotyping of mice. Genomic DNA, isolated from the tails of mice by using a commercial kit (Promega), was employed to amplify wild type and mutant Sod2 allele by PCR, as described[38]. Heterozygous (Sod2+/-) mice were expressing both mutant (197 bp) and wildtype (457 bp) Sod2 alleles whereas littermate control (LMC) mice were expressing only wildtype (457 bp) Sod2 allele, as shown by the agarose gel stained by ethidium bromide; B: Hepatic Sod1 and Sod2 mRNA expression in Sod2+/- and LMC mice were determined by RT-PCR, as described in Methods. Gapdh was used as the endogenous control gene. PCR: Polymerase chain reaction; RT-PCR: Reverse transcription-polymerase chain reaction.
Effect of alcohol and O2•- on hepcidin expression in the liver
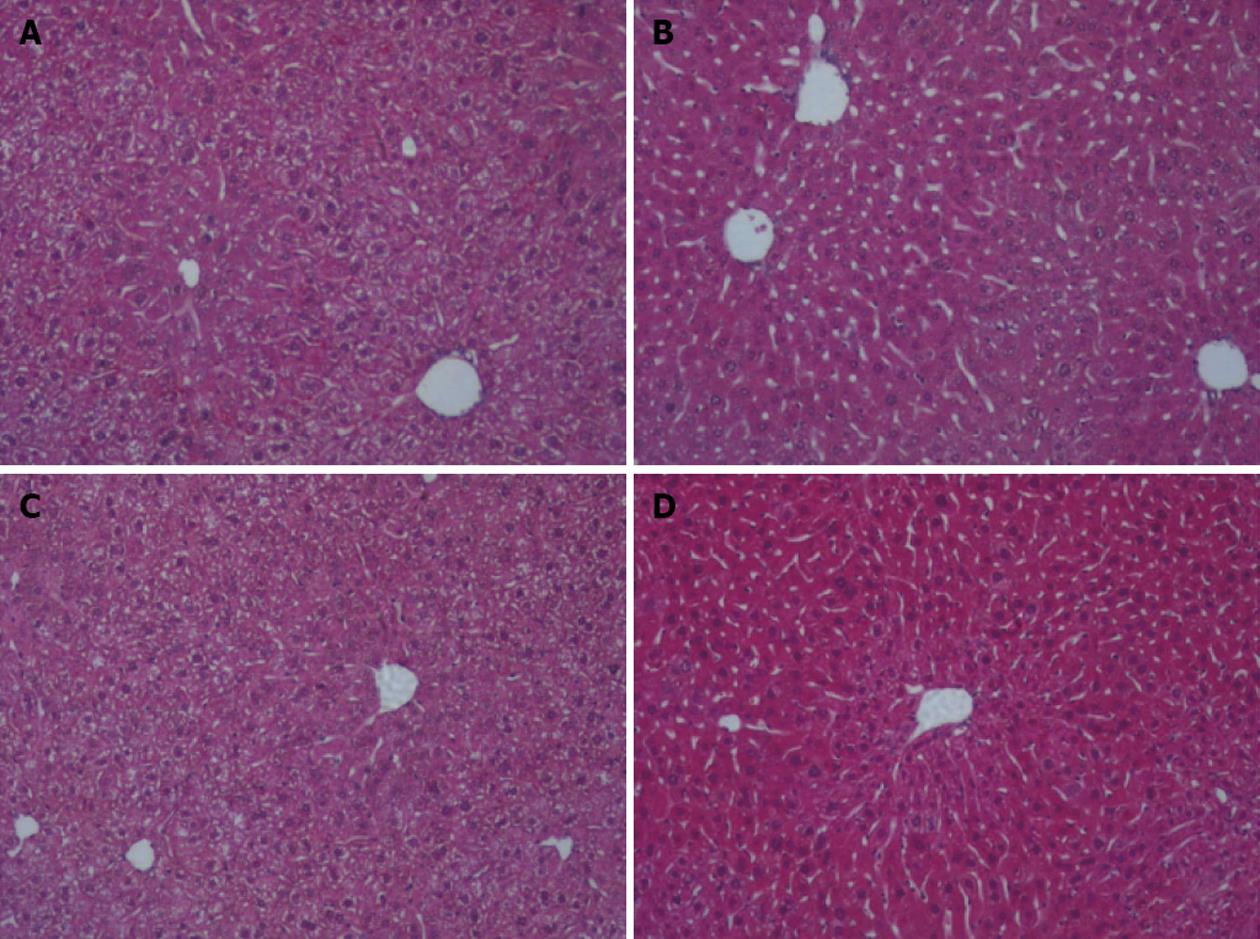
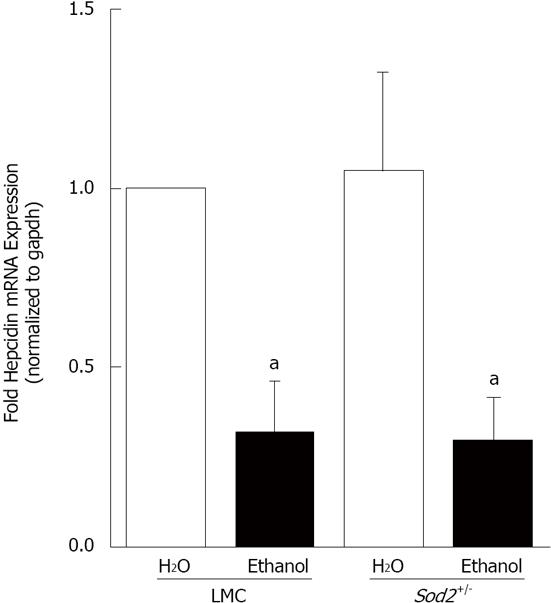
For alcohol studies, Sod2+/- and LMC mice were administered 10% ethanol in the drinking water or plain water (as control) for 1 wk, as described in Materials and Methods. Short-term alcohol exposure did not induce any lipid accumulation or other histological changes in the livers of both Sod2+/- and LMC mice, as determined by HE staining of liver sections (Figure 2). Real-time quantitative PCR experiments were performed to determine the expression of hepcidin mRNA in the livers of control and alcohol-fed Sod2+/- and LMC mice. In alcohol-fed LMC mice, hepcidin mRNA expression was significantly inhibited three-fold (0.313 ± 0.144), compared to water-fed LMC mice (Figure 3). As compared to untreated LMC mice, basal hepcidin expression in the livers of Sod2+/- mice (1.05 ± 0.276) was unchanged (Figure 3). Alcohol also decreased hepcidin mRNA expression in Sod2+/- mice three-fold (0.297 ± 0.121), compared to water-fed LMC and Sod2+/- mice (Figure 3).
Figure 2 Liver histology.
Fixed liver sections of littermate control (LMC) and heterozygous (Sod2+/-) mice fed with plain water (H2O) or 10% ethanol for 1 wk were stained with hematoxylin and eosin (original magnification ×10). A: LMC H2O; B: LMC ethanol; C: Sod2+/- H2O; D: Sod2+/- ethanol.
Figure 3 Alcohol and hepcidin mRNA expression.
cDNA, synthesized from RNA isolated from the livers of Sod2+/- and littermate control mice (LMC) mice fed with 10% ethanol or plain water (H2O) for one week, was used as a template for real-time quantitative polymerase chain reaction. Hepcidin mRNA expression in alcohol-treated LMC and Sod2+/- mice was expressed as fold expression of that in water-treated LMC mice. The letter a indicates statistical significance (aP < 0.05).
Short-term alcohol exposure and O2•- levels in hepatocytes
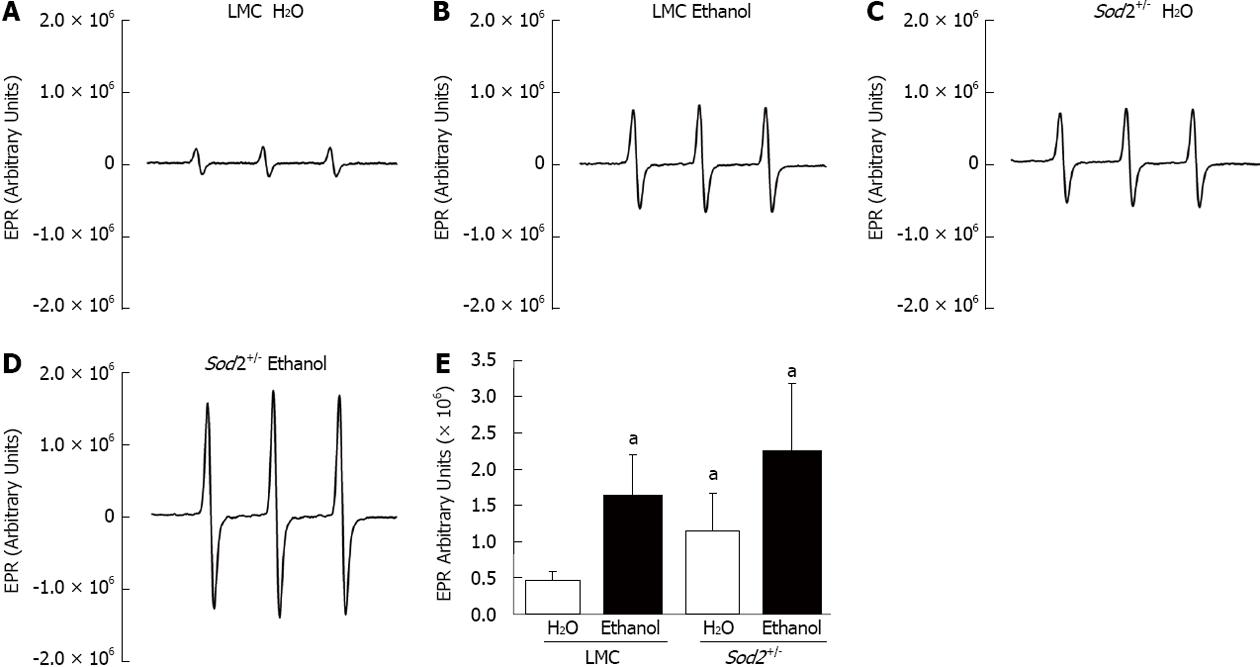
Hepcidin is primarily synthesized in hepatocytes of the liver[7]. In order to study the effect of acute alcohol exposure on O2•- levels, hepatocytes from the livers of in Sod2+/- and LMC mice were isolated. Superoxide levels were quantified by EPR spectroscopy, as described in materials and methods. Levels of O2•- in untreated Sod2+/- mice (1.2 × 10⁶ arbitrary units) were elevated three-fold as compared to untreated LMC mice (0.46 × 10⁶ arbitrary units) (Figure 4A, C and E). Alcohol treatment for 1 wk was sufficient to significantly elevate O2•- levels in hepatocytes collected from both Sod2+/- (2.24 × 10⁶ arbitrary units) and LMC (1.62 × 10⁶ arbitrary units) mice (Figure 4B, D and E). Alcohol intake induced a four-fold (3.63 ± 1.1) increase in the levels of O2•- in LMC mice as compared to untreated LMC mice. The levels of O2•- in alcohol-fed Sod2+/- mice were two-fold (2.06 ± 0.33) higher than in untreated Sod2+/- mice (Figure 4E).
Figure 4 Effect of alcohol on superoxide levels.
Hepatocytes, isolated by perfusion from the livers of littermate control (LMC) and Sod2+/- mice fed with 10% ethanol or plain water (H2O), were subjected to electron paramagnetic resonance (EPR) spectroscopy, as described in Methods. A-D: Representative EPR spectra; E: Summary of data presented as mean ± SD, n = 6. The letter a indicates statistical significance (aP < 0.05).
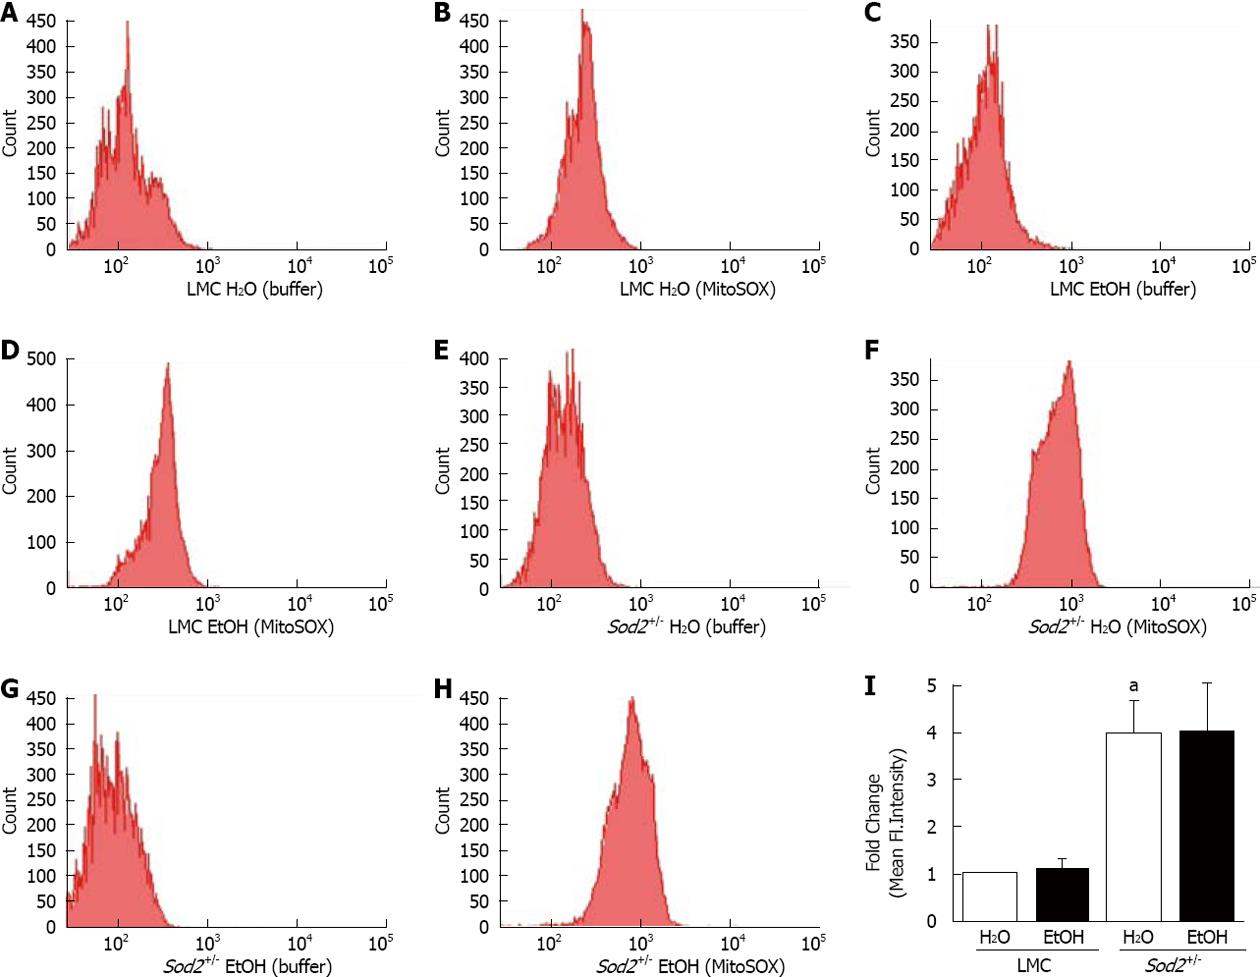
To specifically measure O2•- in mitochondria, the mitochondrial-targeted, O2•--sensitive fluorogenic probe, MitoSOX Red and flow cytometry were utilized. FACS analysis histograms and quantification of mean fluorescent intensities show that alcohol did not significantly alter fluorescent intensity of MitoSOX in hepatocytes of alcohol-treated LMC mice compared to untreated LMC mice fed with plain water (Figure 5A-D and I). The deletion of one allele of Sod2 gene elevated MitoSOX fluorescence four-fold in untreated Sod2+/- mice (3.967 ± 0.71) compared to untreated LMC control mice (1 ± 0) (Figure 5E, F and I), thus, indicating an increase in basal mitochondrial O2•- levels. Similar to LMC mice, 1 wk long alcohol intake did not further increase MitoSOX fluorescence in hepatocytes of Sod2+/- mice (Figure 5E-I).
Figure 5 Alcohol and mitochondrial superoxide production.
Hepatocytes, isolated from the livers of LMC (A-D) and Sod2+/- (E-H) mice fed with plain water (H2O; A, B, E, F) or 10% ethanol (EtOH; C, D, G, H), were incubated with buffer, as control (A, C, E, G) or MitoSOX Red (B, D, F, H) and analyzed by flow cytometry, as described in Methods. A-H: Representative histograms; I: Quantitative analysis showing fold changes in mean fluorescent intensity in hepatocytes of water-fed Sod2+/-, and alcohol-treated LMC and Sod2+/- compared to that of littermate control (LMC) mice fed with plain water. Samples incubated with MitoSOX Red were normalized for background fluorescence by subtracting the values of control (buffer only) incubations. The letter a indicates statistical significance (aP < 0.05).
Alcohol and SOD protein expression
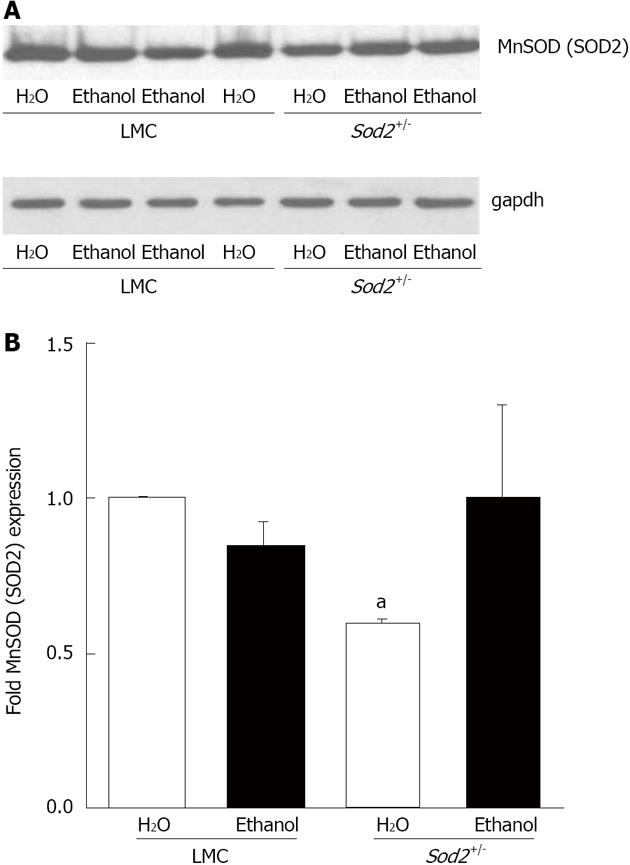
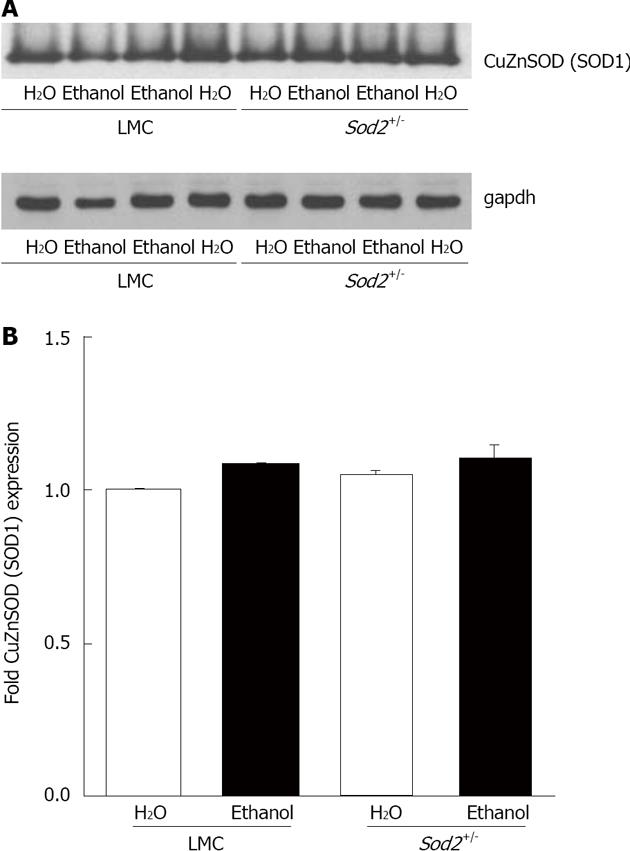
In order to determine the effect of alcohol on MnSOD protein (SOD2) expression, we performed western blot analysis with whole cell lysates isolated from the hepatocytes of untreated or alcohol-fed Sod2+/- and LMC mice livers, as described in Materials and Methods (Figure 6A). The level of SOD2 expression in hepatocytes of Sod2+/- mice was 40% lower than that in LMC mice (Figure 6A and B). One week long alcohol exposure did not alter SOD2 protein expression in hepatocytes of LMC mice (Figure 6A and B). Alcohol induced an increase in SOD2 protein expression in Sod2+/- mice, which was, however, not significant (Figure 6). Hepatic Sod2 mRNA levels were also not significantly altered by alcohol exposure in LMC or Sod2+/- mice, as determined by real-time quantitative PCR (data not shown). CuZnSOD protein (SOD1) is mainly expressed in the cytosol and chronic alcohol consumption has been suggested to decrease SOD1 protein expression[23,24]. Western blot analysis revealed that short-term alcohol administration does not have an effect on SOD1 protein expression in hepatocytes of both Sod2+/- and LMC mice (Figure 7).
Figure 6 Manganese superoxide dismutase (SOD2) expression.
A: Whole cell lysate proteins, isolated from the hepatocytes of Sod2+/- and littermate control mice (LMC) mice livers treated with 10% ethanol or plain water (H2O) for 1 wk, were resolved by SDS-Polyacrylamide gel electrophoresis and subjected to western blotting by using an antibody against mouse SOD2. An anti-gapdh antibody was used as control to confirm equal protein loading; B: Autoradiographs were scanned, and SOD2 expression was quantified by normalizing to gapdh protein expression. Normalized protein expression in water-fed Sod2+/- and alcohol-fed Sod2+/- or littermate control mice was expressed as fold expression of that in water-fed littermate control mice. The letter a indicates statistical significance (aP < 0.05).
Figure 7 CuZn superoxide dismutase (SOD1) expression.
A: Whole cell lysate proteins, isolated from the hepatocytes of Sod2+/- and littermate control mice livers treated with 10% ethanol or plain water (H2O) for 1 wk, were resolved by SDS-Polyacrylamide gel electrophoresis and subjected to western blotting by using an antibody against mouse SOD1. An anti-gapdh antibody was used as the loading control; B: Autoradiographs were scanned, and SOD1 expression was quantified by normalizing to gapdh expression. Normalized protein expression in water-fed Sod2+/- and alcohol-fed Sod2+/- and control mice was expressed as fold expression of that in water-fed control mice. LMC: Littermate control mice.
The role of alcohol and O2•- in apoptosis in the liver
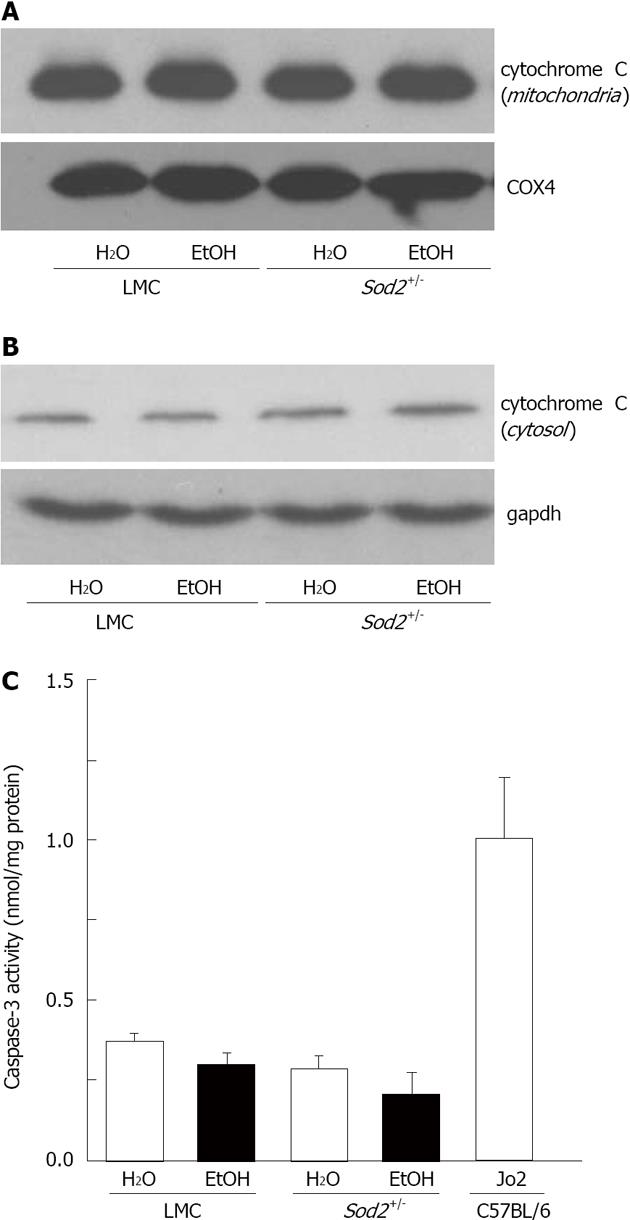
Mitochondria and O2•- are known to play a role in cell death. We therefore examined levels of apoptosis in livers from untreated and alcohol-treated Sod2+/- and LMC mice by measuring cytochrome C release from mitochondria and caspase-3 enzyme activity, as described in Materials and Methods. Liver mitochondria and cytosolic fractions isolated from Sod2+/- and LMC mice were employed to measure cytochrome C release by western blotting. Levels of cytochrome C protein in mitochondria from untreated and alcohol-treated LMC mice were similar (Figure 8A). The deletion of Sod2 gene or administration of alcohol did not induce cytochrome C release from mitochondria in Sod2+/- mice livers (Figure 8A). A negligible amount of cytochrome C protein was detected in cytosolic fractions, which was similar in all the samples (Figure 8B). The deletion of Sod2 gene on one allele and O2•- accumulation in mitochondria did not significantly induce caspase-3 enzyme activity in the livers of Sod2+/- mice, compared to untreated LMC mice (Figure 8C). Similarly, 1 wk long alcohol exposure did not significantly activate caspase-3 enzyme in the livers of LMC or Sod2+/- mice (Figure 8C). However, the livers of C57BL/6 wildtype mice injected with Fas-agonist antibody, Jo2, which were used as internal control, exhibited a significant increase in caspase 3 activity (Figure 8C).
Figure 8 Detection of apoptosis in Sod2+/- mice with alcohol exposure.
Liver protein lysates, isolated from mitochondria (A) or cytosol (B) of littermate control (LMC) and Sod2+/- mice fed with 10% ethanol (EtOH) or plain water (H2O), were resolved by SDS-Polyacrylamide gel electrophoresis and subjected to western blotting by using an anti-cytochrome c antibody. Anti-COX4 (A) and gapdh (B) antibodies were used as loading controls; C: Whole cell lysate (WCL) proteins isolated from the livers of LMC and Sod2+/- mice fed with 10% ethanol or plain water were employed to measure caspase-3 activity, as described in Methods. WCL isolated from the livers of C57BL/6 strain wild-type male mice 6 h after the injection (ip) of anti-mouse Fas agonist antibody, Jo2 (0.32 μg/g. b.w., Millipore) were used as internal control for caspase-3 assays.
DISCUSSION
The liver is important for both iron and alcohol metabolism. It is the main site of synthesis for the key iron-regulatory hormone, hepcidin[7]. Transgenic mice deficient in hepcidin expression exhibit severe iron overload in the liver and other organs[43]. The oxidation of ethanol by alcohol dehydrogenase following alcohol consumption occurs in the liver. Alcohol and iron metabolism generate free radicals and lipid peroxidation products[28]. Similar to patients with alcoholic liver disease (ALD), mice with short-term alcohol exposure exhibit reduced hepcidin expression and increased intestinal iron absorption[12,44-46]. We have previously reported that the inhibition of the activity of transcription factor, C/EBPα in the liver is one of the mechanisms involved in the suppression of hepcidin transcription by alcohol[12,39]. We have also shown that 1 wk long alcohol exposure is sufficient to cause oxidative stress in the liver[12]. The administration of antioxidants, vitamin E or NAC reversed the effect of alcohol on the inhibition of both C/EBPα DNA-binding activity and hepcidin expression in the liver as well as on the induction of the intestinal iron transporter expression[12]. The current study investigates the role of O2•- in the inhibition of hepcidin transcription by alcohol.
Mitochondria are important for iron homeostasis and are involved the pathogenesis of ALD. Alcohol consumption has been shown to increase ROS generation by liver mitochondria[30,47,48]. Considering mitochondria are a primary source of O2•- production in cells, we employed knockout mice deficient in the expression of SOD2, a mitochondrial-targeted O2•- scavenging enzyme for these studies. A 1 wk long alcohol exposure model was chosen to study the regulation of hepcidin by mitochondrial O2•- for the following reasons: (1) The disturbances in the redox balance of the cell are one of the early events in the progression of ALD; (2) We have shown that this model causes oxidative stress and inhibits hepcidin expression in the absence of any lipid accumulation, inflammation or injury in the liver[12]; and (3) The effects of short-term alcohol consumption on O2•- levels in the liver are unclear.
Our previously published in vivo studies and other in vitro studies employed dihydroethidium staining or ROS-sensitive probe 2’,7’-dichlorofluorescin diacetate (DCFH-DA) to evaluate ROS production in the liver induced by short-term alcohol administration[12,48]. In this study, we quantified both total and mitochondrial O2•- levels by EPR analysis, and MitoSOX Red and flow cytometry, respectively. For these studies, hepatocytes freshly isolated from the livers of alcohol-treated and control mice were employed because hepcidin is primarily synthesized in hepatocytes of the liver.
The deletion of one Sod2 allele was sufficient to elevate both total and mitochondrial O2•- levels in hepatocytes by three-fold and four-fold, respectively. In addition, the administration of alcohol for one week caused a significant increase in the level of total O2•- in both Sod2+/- and LMC mice. When compared to untreated counterparts, alcohol-induced fold increases in total O2•- levels were higher in LMC mice than in Sod2+/- mice. However, 1 wk alcohol intake did not affect mitochondrial O2•- levels in both Sod2+/- and control mice, as shown by our MitoSOX Red and flow cytometry studies. Taken together, these findings suggest that short-term alcohol consumption elevates O2•- levels in cytoplasm and/or extracellular space, but not in mitochondria of hepatocytes. We can not however exclude the possibility of O2•- leaking out of mitochondria into the cytoplasm or alcohol-induced O2•- being rapidly converted to hydrogen peroxide, which is eliminated by glutathione peroxidase-1 in mitochondria and cytosol[15]. It is therefore possible that the livers of Sod2+/- mice are capable of preventing O2•- accumulation in mitochondria following short-term alcohol consumption.
Activated Kupffer cells (liver macrophages) are believed to be an important source of oxidants and play a pivotal role in the initial stages of ALD pathogenesis[28,49]. However, this study indicates that hepatocytes are also a significant contributor to the enhanced levels of free radical, particularly O2•-, in the very early stages of alcohol consumption. Furthermore, our previously published studies indicate that Kupffer cells or the cytokine, tumor necrosis factor-α are not involved in the inhibition of hepcidin transcription by short-term alcohol exposure[50]. Kupffer cells have also been shown not to play a role in the regulation of hepcidin expression by iron or endotoxin in vivo[51].
Chronic alcohol consumption has been shown to elevate liver SOD2 expression but the effect of short-term alcohol intake is unclear[22]. We observed an increase in SOD2 protein expression in hepatocytes isolated from the livers of Sod2+/- mice following one week alcohol administration. However, this increase, which was absent in alcohol-treated LMC control mice, was not significant. Similarly, alcohol did not induce any significant changes in SOD2 mRNA levels in LMC control or Sod2+/- mice. Published studies report conflicting results regarding the role of SOD2 expression in ALD pathogenesis. Adenoviral delivery of SOD2 into rats has been shown to prevent liver injury following prolonged intragastric infusion of alcohol[35]. In contrast, another study reported that SOD2 over expression in mice worsens liver mitochondrial DNA depletion following prolonged alcohol consumption but prevents it after a single intragastric dose of alcohol exposure (i.e., binge model)[36]. Accordingly, some dose-response studies have suggested that the addition or over expression of SOD can either be beneficial or detrimental by exacerbating cell injury or death (i.e., hormesis)[16].
Of note, mitochondria are involved in the intrinsic pathway of apoptosis leading to the release of cytochrome C and caspase activation[52]. Van Remmen et al[53] reported apoptosis in cardiac tissues of Sod2+/- mice. Despite significant O2•- accumulation, the livers of untreated or short-term alcohol-fed Sod2+/- mice did not exhibit any caspase activation or mitochondrial cytochrome C release. Similarly, the livers of both global and liver-specific Sod2 knockout mice have been shown not to exhibit any obvious morphological abnormalities[38,54]. Furthermore, studies by Cyr et al[55] using liver-specific Sod2 knockout mice strongly suggest that hepatocytes have a reserve capacity to cope with the presence of mitochondrial ROS. Our findings therefore suggest that the existing defense mechanisms in the liver are sufficient to prevent both the accumulation of mitochondrial O2•- and apoptosis following short-term alcohol exposure.
Short-term alcohol exposure inhibited hepcidin transcription by three-fold in the livers of both Sod2+/- and LMC control mice. The fact that alcohol induced a similar level of hepcidin inhibition despite its differential effects on total O2• production in LMC and Sod2+/- mice strongly suggests that O2•- is not involved in the regulation of hepcidin transcription by alcohol. Furthermore, the deletion of one allele of Sod2 significantly elevated both total and mitochondrial O2• levels but did not alter basal hepcidin expression in the livers of Sod2+/- mice compared to LMC mice. Hepcidin expression has been shown to be regulated by H2O2 in tissue culture cell models[56]. We can not exclude a role for other free radicals in the regulation of hepcidin and thereby iron metabolism in ALD, which will be investigated in future studies.
In a conclusion, Patients with ALD and animal models of ALD frequently exhibit iron overload. Hepcidin, which is primarily synthesized in the hepatocytes of the liver, is the pivotal regulator of iron homeostasis. We have previously demonstrated that the inhibition of liver hepcidin expression (and the accompanying increase in intestinal iron absorption) by short-term alcohol exposure can be prevented by antioxidants, vitamin E and N-acetylcysteine in vivo. This study investigates the role of mitochondrial O2•- in this process by using knockout mice heterozygous for Sod2 (Sod2+/-) and LMC mice. EPR analysis indicated that 1 wk of moderate alcohol consumption is sufficient to significantly elevate O2•- levels in hepatocytes freshly isolated from the livers of untreated and alcohol-treated Sod2+/-and LMC mice. This alcohol-mediated increase in O2•- did not however originate from mitochondria, as shown by MitoSOX and flow cytometry studies. Despite the significant differences in hepatic O2•- levels, Sod2+/- and LMC mice displayed a similar level of hepcidin inhibition following alcohol administration. O2•- accumulation in untreated Sod2+/- mice did not alter the basal expression level of hepcidin in the liver. Collectively, our studies strongly suggest that mitochondrial superoxide is not involved in the inhibition of liver hepcidin expression and thereby regulation of iron metabolism by alcohol. Further, our data indicate that hepatocytes are a significant source of oxidants in the very early stages of ALD progression.
COMMENTS
Background
Patients with alcoholic liver disease (ALD) and animal models of ALD frequently exhibit iron overload. However, the underlying mechanisms are not well understood. The authors’ laboratory and others have shown that both short-term and long-term alcohol intake inhibits the expression of hepcidin in the liver in vivo.
Research frontiers
Iron and alcohol act synergistically to induce liver injury. Hepcidin, which is primarily synthesized in the hepatocytes of the liver, is the pivotal regulator of iron homeostasis. Alcohol-induced oxidative stress in the liver is involved in the pathogenesis of ALD. It is therefore important to understand the regulation of hepcidin by alcohol-induced oxidative stress.
Innovations and breakthroughs
The authors have previously demonstrated that short-term and moderate alcohol consumption is sufficient to inhibit liver hepcidin expression leading to an increase in intestinal iron transporter expression in vivo. Interestingly, both of these processes were abolished by antioxidants, vitamin E and N-acetylcysteine, strongly suggesting a role for alcohol-induced oxidative stress. Several elegant studies have shown the importance of oxidative stress and mitochondria in alcohol-induced liver injury but the individual role of free radicals is unclear. This study investigates the role of alcohol-induced superoxide generation in the regulation of hepcidin in the liver.
Applications
The findings in this study suggest that hepatocytes are a significant source of oxidants in the very early stages of ALD progression. Moderate and short-term alcohol consumption is sufficient to significantly elevate hepatic superoxide levels, which do not however originate from mitochondria. Further, alcohol-induced superoxide is not involved in the inhibition of liver hepcidin expression. These findings will help us to further understand the mechanisms of liver injury with the ultimate aim of developing novel diagnostic and treatment strategies for ALD.
Terminology
Liver is important for both alcohol and iron metabolism. The generation of free radicals and lipid peroxidation plays a major role in the pathogenesis of ALD. The free radical, superoxide (O2•-) can initiate lipid peroxidation, and iron can interact with O2•- and hydrogen peroxide to yield hydroxyl radical, which is highly reactive and detrimental. The antioxidant enzyme, superoxide dismutase (SOD) plays a protective role by catalyzing the dismutation of O2•- into hydrogen peroxide and oxygen.
Peer review
This work utilizes Sod2+/- mice to address the role of SOD2 and superoxide in alcohol-mediated regulation of hepcidin and iron metabolism. The authors are pioneers in this field.


