Copyright
©The Author(s) 2017.
World J Biol Chem. Feb 26, 2017; 8(1): 86-94
Published online Feb 26, 2017. doi: 10.4331/wjbc.v8.i1.86
Published online Feb 26, 2017. doi: 10.4331/wjbc.v8.i1.86
Figure 1 Protection against menadione-induced mitochondrial depolarization with L-carnitine.
C2C12 cells were either untreated (white histogram) or pretreated with 500 μmol/L of L-carnitine (dark histogram) and incubated for 24 h with desired concentration of menadione (from 0 to 12 μmol/L). Mitochondria integrity was evaluated using DiOC6(3) probe staining; fluorescent cells were counted using a cytometer. Results are presented as the mean value ± SD. Two different values (P < 0.005) are indicated by a star above the two histograms.
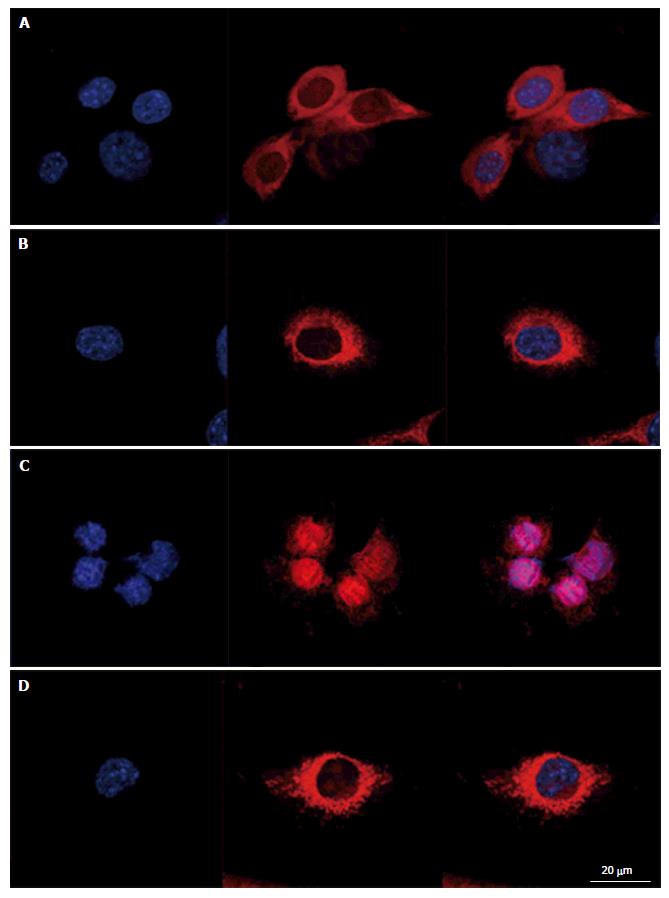
Figure 2 Prevention of menadione-induced mitochondrial distribution with L-carnitine.
C2C12 cells were either untreated or pretreated with 500 μmol/L of L-carnitine and incubated for 24 h with menadione (0 and 9 μmol/L). Nucleus and mitochondria morphology was evaluated after staining with Hoechst 33342 and MitoSoxRed, respectively. From left to right, staining with nuclei, mitochondria and both. Cells mounted in fluorescence medium were observed with a LSM confocal microscope. A: C2C12 untreated with menadione and untreated with L-carnitine; B: C2C12 pretreated with L-carnitine and untreated with menadione; C: C2C12 untreated with L-carnitine and treated with 9 μmol/L of menadione; D: C2C12 pretreated with L-carnitine and treated with 9 μmol/L of menadione.
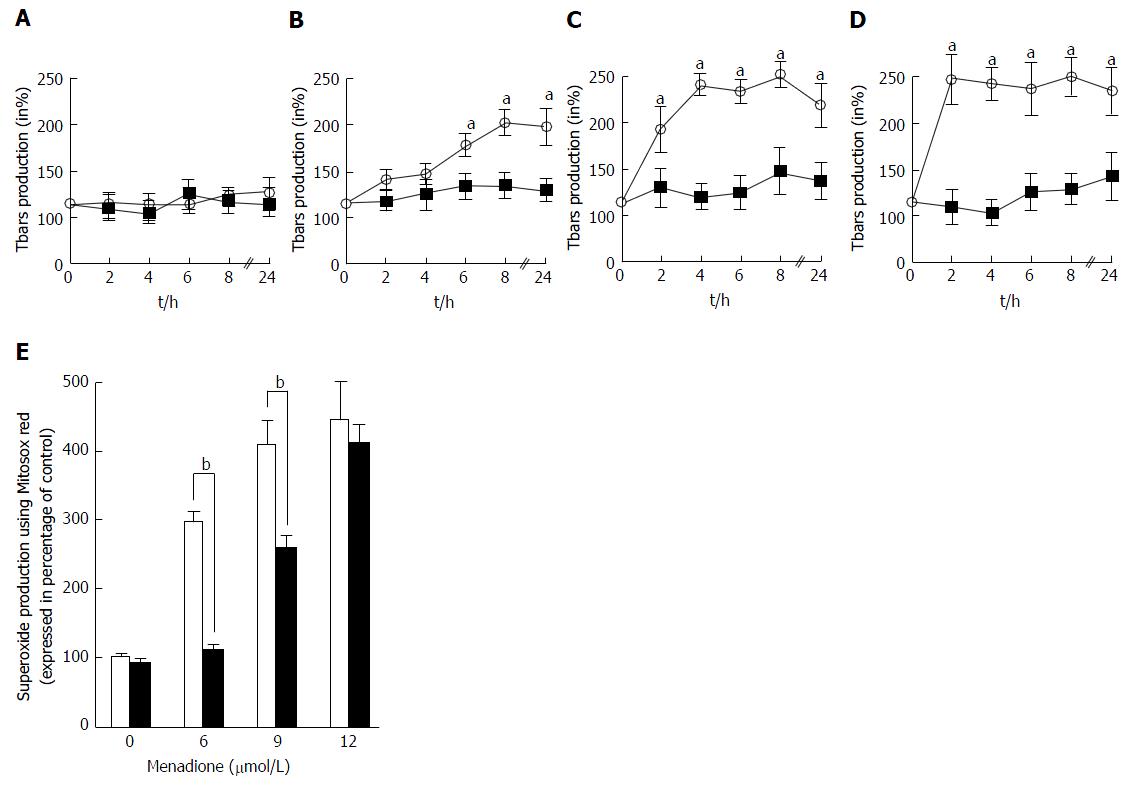
Figure 3 Characterization of reactive oxygen species production.
A-D: Tbars production was determined in C2C12 cells in the presence of various amounts of menadione from 1 to 24 h. Results were expressed in percentage of the control cell Tbars production. Tbars production was analyzed in the presence of 0 (A), 6 (B), 9 (C) and 12 μmol/L (D) of menadione in control cells (empty circles and dashed line) and in cells pre-treated with 500 μmol/L of carnitine (black squares and full line). An asterisk on top of a symbol indicates a significant difference (P < 0.05); E: Superoxide anion production at the mitochondrial level on menadione-treated C2C12 cells with MitoSoxRed. C2C12 cells were either untreated (white histogram) or pretreated with 500 μmol/L of L-carnitine (black histogram) and incubated for 24 h with desired concentration of menadione (from 0 to 12 μmol/L). MitoSoxRed (MSR) is a cell permeable dye that is targeted to the mitochondria, it is oxidized by superoxide and exhibit red fluorescence. Superoxide production was measured by cytometry after staining with MSR. Results are presented as the mean value ± SD. A star on the top of two histograms indicates statistical difference (P < 0.005) between these two values (Untreated vs L-carnitine treated cells).
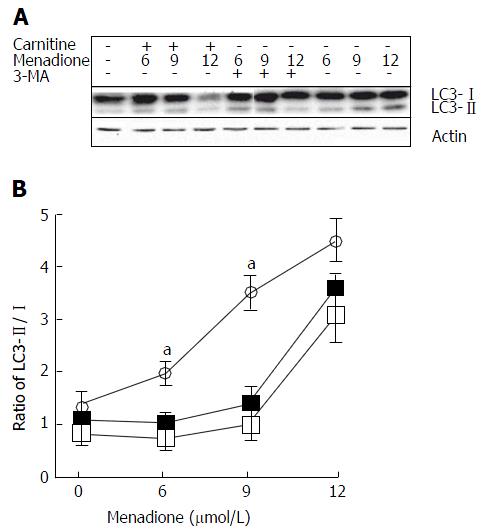
Figure 4 Menadione induces autophagy in C2C12 cells.
A: Western blot for the determination of LC3 I and II forms. Initial cells were either treated with L-carnitine, menadione or 3-MA; B: LC3-I and II isoforms were detected by western blotting and quantified. The ratio between I and II forms was calculated and plotted in this figure. The black squares represent L-carnitine treated cells whereas empty circles represent C2C12 cells that were not pretreated with L-carnitine. Empty squares represent cells treated with 5 mmol/L of 3-MA. Each point is the mean of 4 independent experiments (± standard values). For each concentration of menadione, a star indicates a significant difference between untreated and L-carnitine treated cells (P < 0.05).
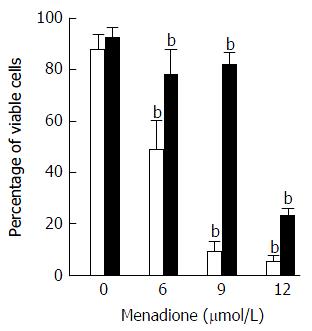
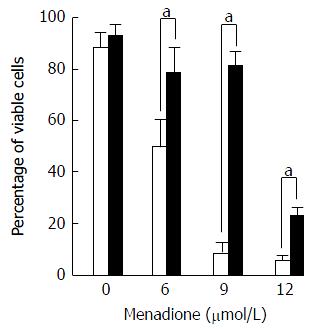
Figure 5 Protection of menadione-induced C2C12 cell death by L-carnitine.
C2C12 cells were either untreated (white histogram) or pretreated with 500 μmol/L of L-carnitine (dark histogram) and incubated for 24 h with desired concentration of menadione (from 0 to 12 μmol/L). Cell survival was evaluated by the analysis of membrane permeability to PI measured by flow cytometry. Each value represents the average percentage of viable cells remaining in the total population ± standard values. Black histograms indicate the proportion (%) of C2C12 that was not PI positive. White histograms indicate the proportion (%) of C2C12 pretreated with L-carnitine that was not PI positive. A star on top of two histograms indicates a significant difference between untreated and L-carnitine treated cells (P < 0.05).
- Citation: Le Borgne F, Ravaut G, Bernard A, Demarquoy J. L-carnitine protects C2C12 cells against mitochondrial superoxide overproduction and cell death. World J Biol Chem 2017; 8(1): 86-94
- URL: https://www.wjgnet.com/1949-8454/full/v8/i1/86.htm
- DOI: https://dx.doi.org/10.4331/wjbc.v8.i1.86


