Copyright
©2014 Baishideng Publishing Group Inc.
World J Biol Chem. Nov 26, 2014; 5(4): 437-456
Published online Nov 26, 2014. doi: 10.4331/wjbc.v5.i4.437
Published online Nov 26, 2014. doi: 10.4331/wjbc.v5.i4.437
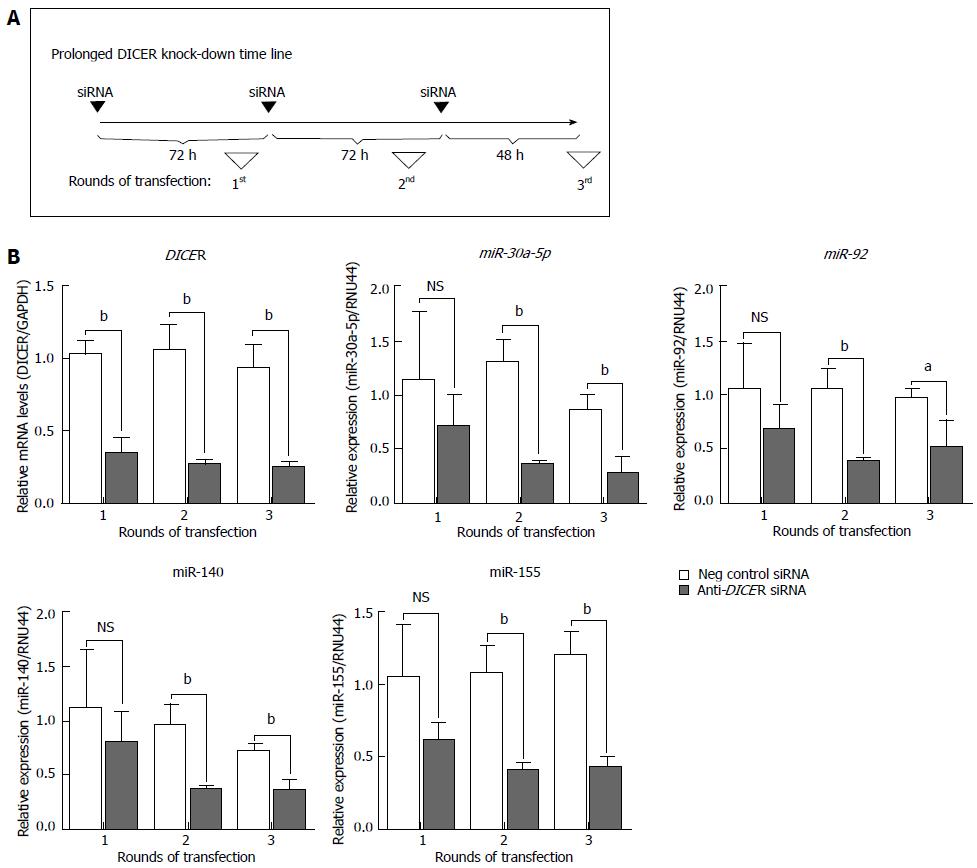
Figure 1 Prolonged knock-down of DICER is necessary in order to effectively lower the levels of mature microRNAs.
Thirty nmol/L of either anti-DICER or negative control siRNA were used. A: Global timeline of the experiment; B: DICER mRNA or expression of the indicated microRNAs (miR-30a-5p, -92, -140, 155) was quantified by reverse transcription-quantitative polymerase chain reaction. The values plotted represent the mean ± SD, of three independent experiments. For all graphs, unpaired t test was used to calculate the P values for anti-DICER vs negative control siRNA samples. aP < 0.05; bP < 0.01. NS: Not significant.
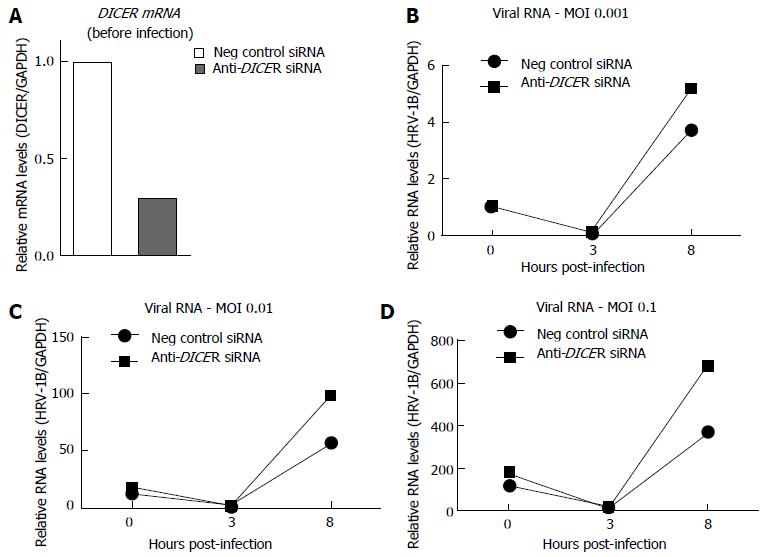
Figure 2 Prolonged DICER knock-down enhanced human rhinovirus-1B replication (preliminary experiments).
BEAS-2B cells were transfected for three rounds with either a negative control siRNA or anti-DICER siRNA. Forty-eight hours after the third transfection, cells were infected with the indicated amount of HRV-1B, expressed as MOI (multiplicity of infection). Reverse transcription-quantitative polymerase chain reaction was used to quantify (A) DICER mRNA levels before infection or (B-D) HRV-1B RNA at 0, 3 or 8 h post-infection (HPI). The plotted values represent the average of qPCR duplicates from one experiment. The 0 HPI sample at MOI 0.001 was used as calibrator for all samples.
Figure 3 Prolonged DICER knock-down leads to higher levels of viral RNA.
BEAS-2B cells were transfected for three rounds (using 30 nmol/L of siRNA) and then infected with human rhinovirus (HRV)-1B at MOI 0.01. Cells collected just before infection were used to measure DICER mRNA levels (A) and miR-30a-5p expression (B) by reverse transcription-quantitative polymerase chain reaction (RT-qPCR). HRV-1B RNA (C) and IFNB1 mRNA (D) levels in infected cells were measured by RT-qPCR at the indicated time points. In (D) the time point “-1” refers to uninfected cells, collected just before infection. In (C) all the samples were normalised as done for data in Figure 2 [0 h post-infection (HPI), MOI 0.001 sample as calibrator]. Plotted values represent the mean ± SD, of three independent experiments. For all panels, unpaired t test was used to calculate the P values for anti-DICER vs negative control siRNA samples.aP < 0.05; bP < 0.01. NS: Not significant; MOI: Multiplicity of infection.
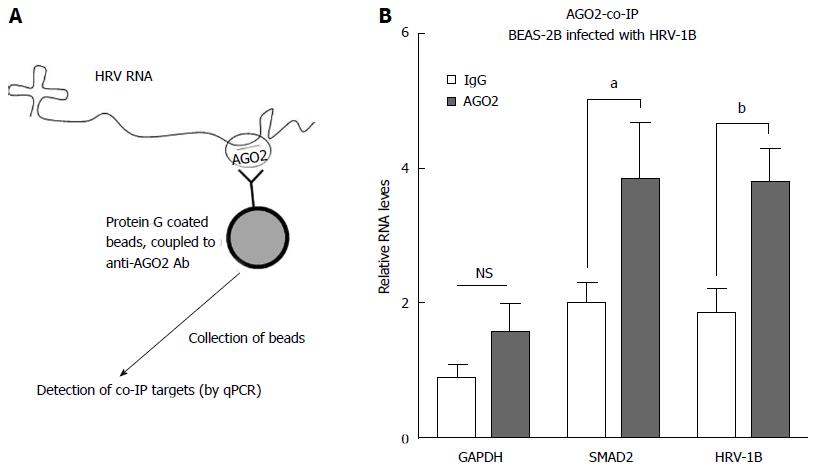
Figure 4 Human rhinovirus-1B RNA co-immunoprecipitates with AGO2 protein in BEAS-2B cells.
A: Schematic representation of the rationale behind AGO2 co-IP experiments; B: BEAS-2B cells were infected with HRV-1B at MOI 0.01. Six hours post-infection cells were collected and AGO2 co-IP was performed. Plotted values represent the mean ± SD, of three independent experiments. The formula used takes into account the abundance of the RNAs before immunoprecipitation (see materials and methods). Unpaired t test was used to calculate the P values for AGO2 vs IgG control. NS: Not significant (P > 0.05); aP < 0.05; bP < 0.01. MOI: Multiplicity of infection; HRV: Human rhinovirus.
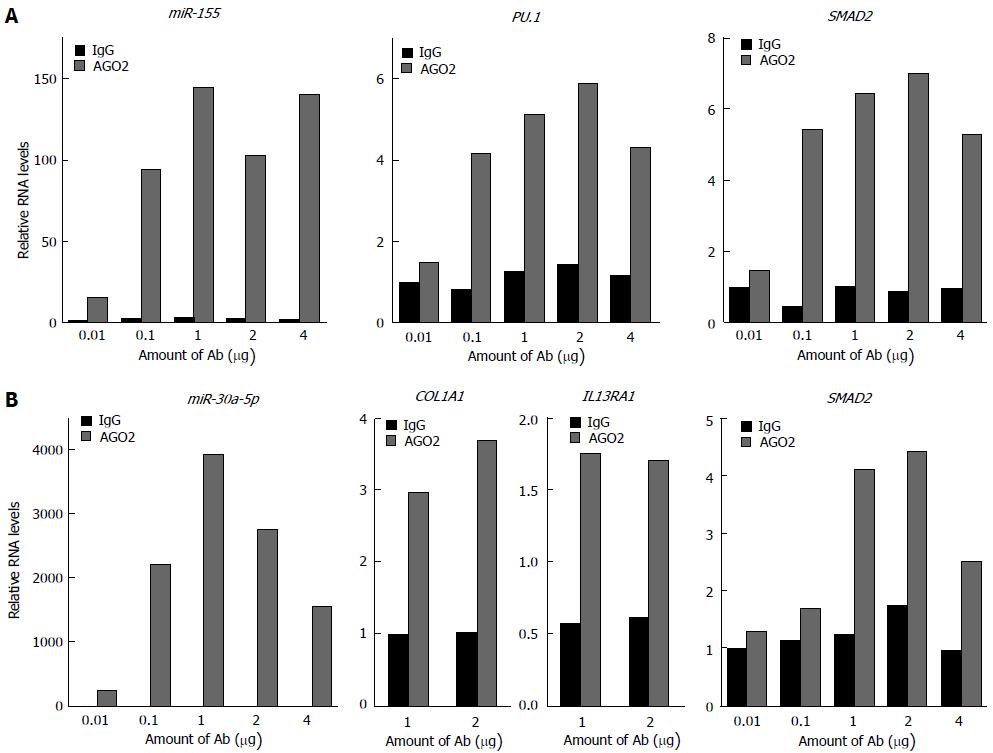
Figure 5 Antibody titration for AGO2 co-IP.
These experiments were performed in order to determine the most convenient antibody concentration to use for (A) THP-1 (used as additional control) and (B) BEAS-2B cells: 1μg was chosen as it would give the highest enrichment of both microRNAs and target mRNAs. These results show that microRNAs are very tightly associated with AGO2 protein, and confirm that microRNA-regulated mRNAs are also considerably co-purified. Previous work from our group has shown that PU.1, SMAD2 and IL13RA1 are targeted by miR-155[45,62,89] while COL1A1 has been shown to be targeted by miR-29b elsewhere[90]. IgG refers to the negative control antibody, AGO2 refers to the anti-AGO2 antibody used. Plotted values represent the average of qPCR duplicates from one experiment.
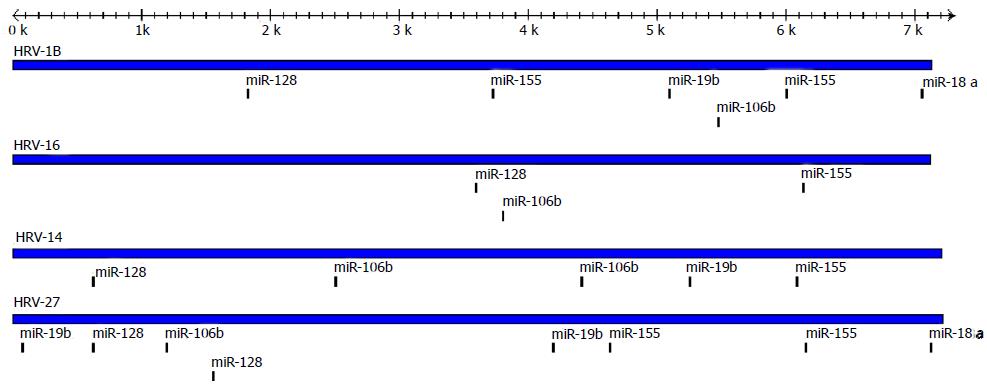
Figure 6 Schematic of targetscan predictions.
Indicated are the target sites predicted for miR-18a, -19b, -106b, -128, -155 on two strains of HRV-A (HRV-1B and -16) and two strains of HRV-B (HRV-14 and -27). HRV: Human rhinovirus.
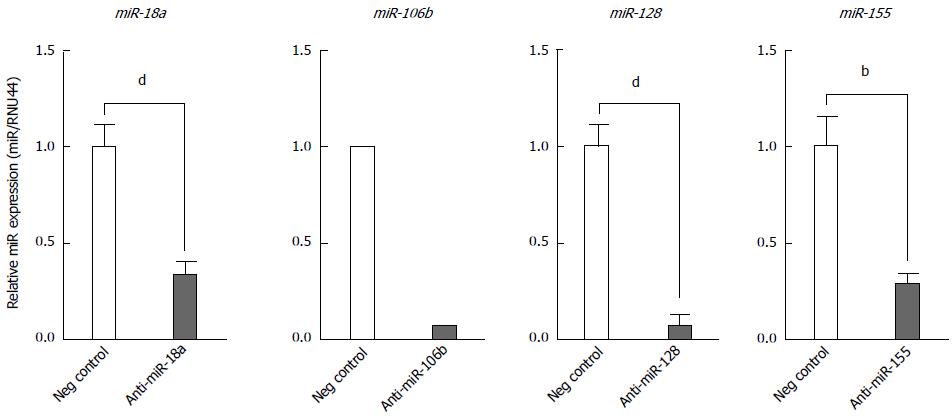
Figure 7 Effect of anti-miR transfection on microRNA expression in BEAS-2B cells.
MicroRNA expression was quantified by reverse transcription-quantitative polymerase chain reaction (RT-qPCR) 24 h post-transfection with either a negative control anti-miR or the indicated specific anti-miR. Plotted values for miR-18a, -128 and -155 represent the mean ± SD of three independent experiments. Unpaired t test was used to calculate P values for cells transfected with the specific anti-miR vs negative control anti-miR. bP < 0.01; dP < 0.01. The values plotted for miR-106b represent the average of qPCR duplicates from one experiment.
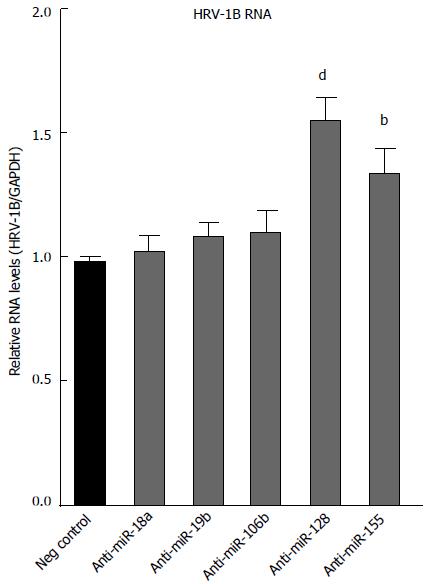
Figure 8 Antagonists of miR-155 and miR-128 enhance human rhinovirus-1B replication in BEAS-2B cells.
BEAS-2B cells were transfected with 100 nmol/L of the indicated anti-miR. The following day, cells were infected with HRV-1B (multiplicity of infection of 0.01). HRV (human rhinovirus)-1B RNA was measured by RT-qPCR from samples collected at 8 h post-infection. Plotted values represent the mean ± SD, from 3 independent experiments. The P values were calculated for each specific anti-miR vs the negative control anti-miR, using one way ANOVA with Bonferroni correction. bP < 0.001; dP < 0.0001.NS: Not significant.
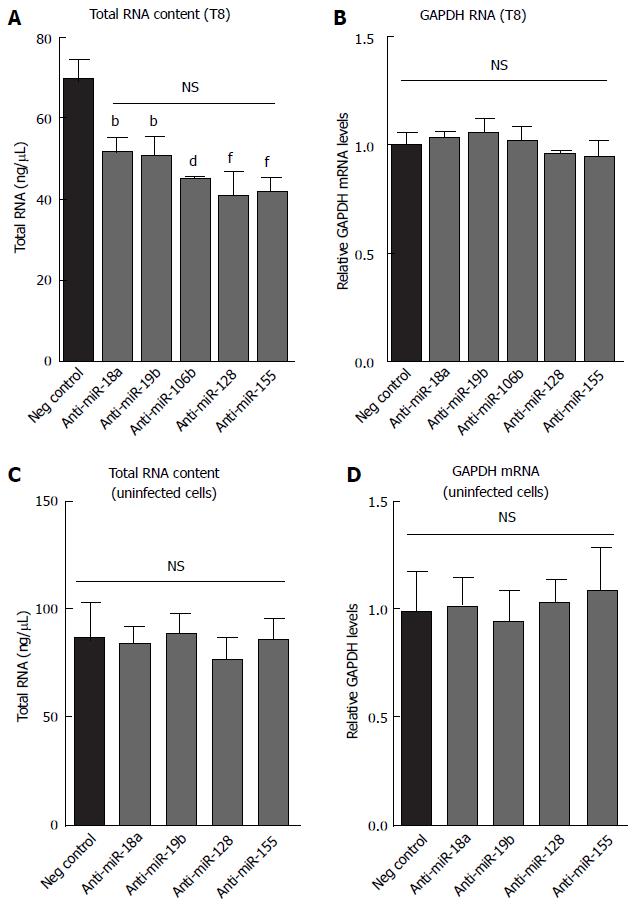
Figure 9 Effect of anti-miR transfection on total cell RNA and GAPDH expression in BEAS-2B cells.
(A and B) Values obtained for the samples used for Figure 5 or (C and D) from cells transfected with the indicated anti-miRs but not infected with HRV-1B. The values plotted represent the mean ± SD of three independent experiments. The P values were calculated across all the anti-miRs, using one way ANOVA with Bonferroni correction. In A, each specific antimiR was significantly different vs negative control (bP < 0.01; dP < 0.001; fP < 0.0001) but not significantly different to one another. NS: Not significant.
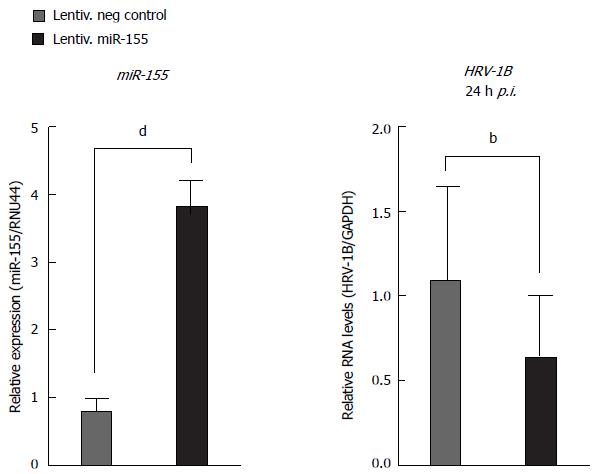
Figure 10 MiR-155 over-expression inhibits human rhinovirus-1B replication.
Lentivirally transduced BEAS-2B cells were infected with human rhinovirus-1B (HRV-1B) at an MOI of 0.01. MiR-155 expression of uninfected cells or HRV-1B RNA (24 h post-infection) was measured by RT-qPCR from three independent experiments. P values for miR-155-overexpressing cells vs negative control cells were calculated using the unpaired t test for miR-155 expression, or the ratio paired t test for HRV-1B RNA; bP < 0.01, dP < 0.001.
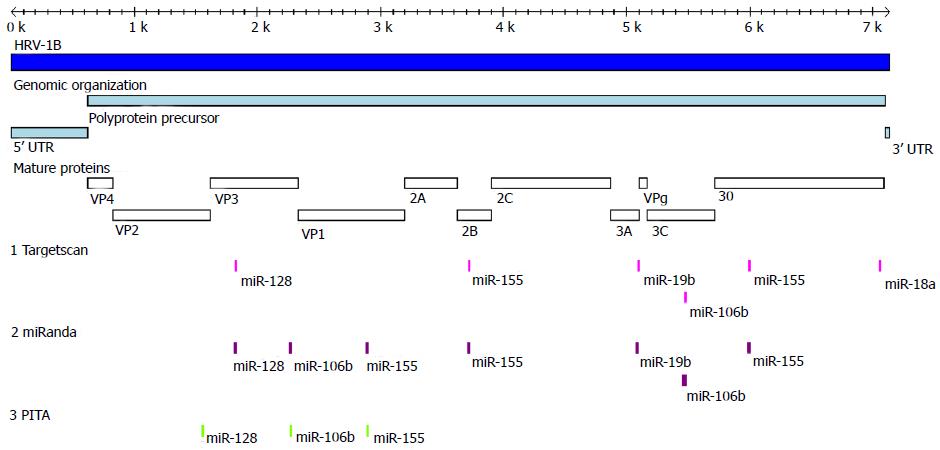
Figure 11 Schematic comparison of microRNA predictions on human rhinovirus-1B.
Indicated are the target sites predicted for miR-18a, -19b, -106b, -128, -155 on HRV-1B by Targetscan, miRanda and PITA algorithms. In addition, the genomic organization and the boundaries of the viral mature proteins are shown.
- Citation: Bondanese VP, Francisco-Garcia A, Bedke N, Davies DE, Sanchez-Elsner T. Identification of host miRNAs that may limit human rhinovirus replication. World J Biol Chem 2014; 5(4): 437-456
- URL: https://www.wjgnet.com/1949-8454/full/v5/i4/437.htm
- DOI: https://dx.doi.org/10.4331/wjbc.v5.i4.437


