Copyright
©2013 Baishideng Publishing Group Co.
World J Biol Chem. Nov 26, 2013; 4(4): 119-130
Published online Nov 26, 2013. doi: 10.4331/wjbc.v4.i4.119
Published online Nov 26, 2013. doi: 10.4331/wjbc.v4.i4.119
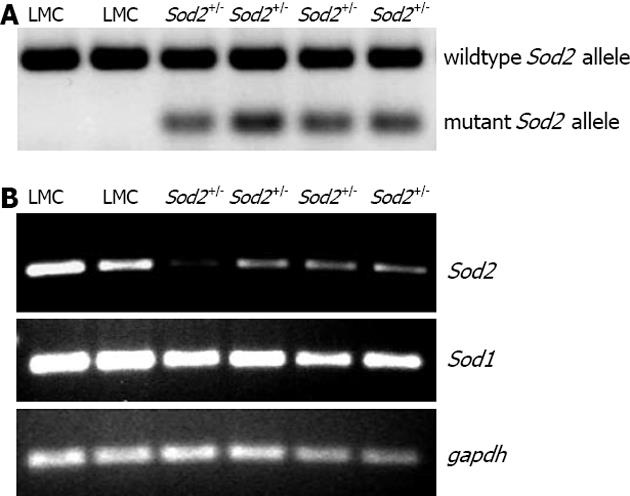
Figure 1 Genotyping and expression.
A: Genotyping of mice. Genomic DNA, isolated from the tails of mice by using a commercial kit (Promega), was employed to amplify wild type and mutant Sod2 allele by PCR, as described[38]. Heterozygous (Sod2+/-) mice were expressing both mutant (197 bp) and wildtype (457 bp) Sod2 alleles whereas littermate control (LMC) mice were expressing only wildtype (457 bp) Sod2 allele, as shown by the agarose gel stained by ethidium bromide; B: Hepatic Sod1 and Sod2 mRNA expression in Sod2+/- and LMC mice were determined by RT-PCR, as described in Methods. Gapdh was used as the endogenous control gene. PCR: Polymerase chain reaction; RT-PCR: Reverse transcription-polymerase chain reaction.
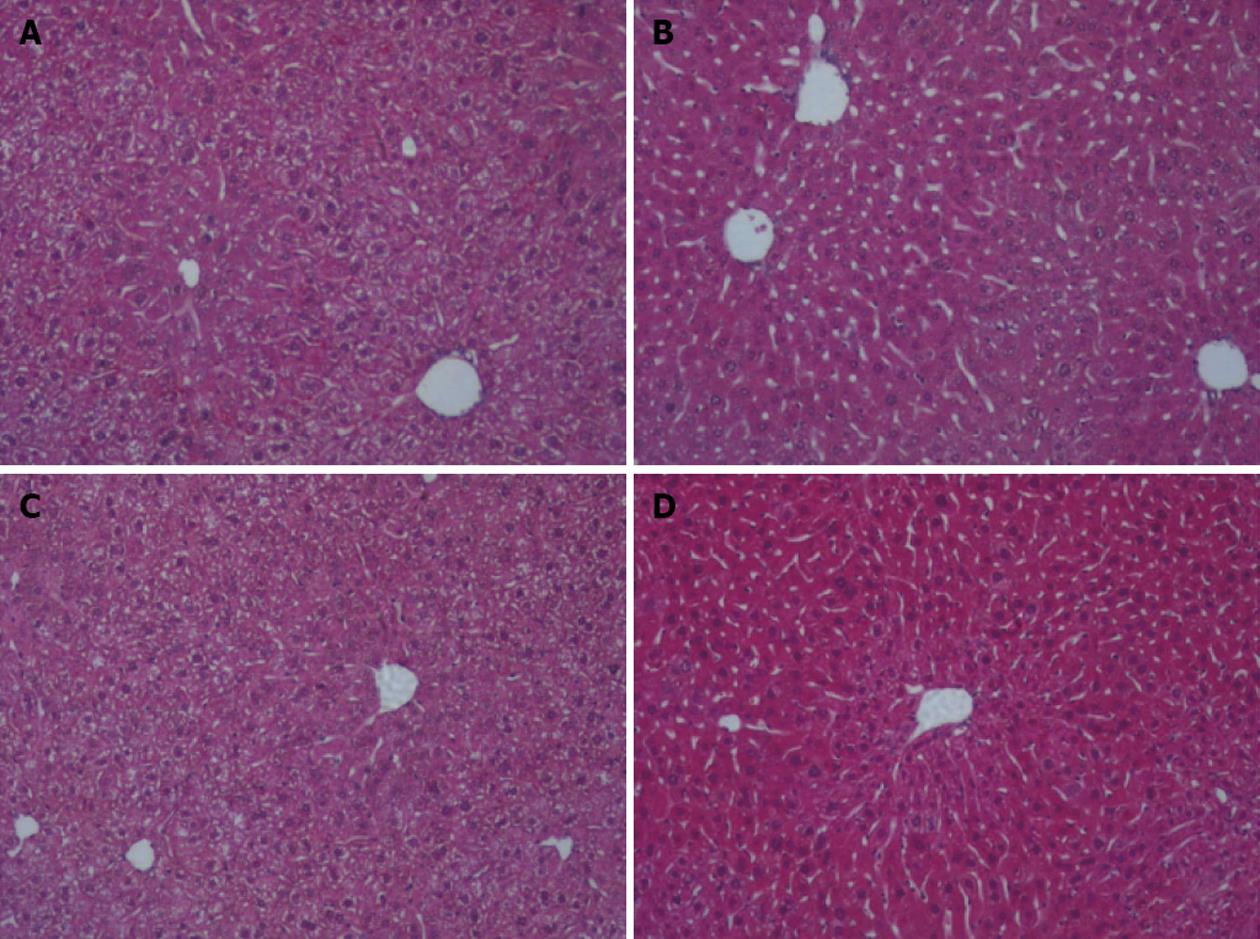
Figure 2 Liver histology.
Fixed liver sections of littermate control (LMC) and heterozygous (Sod2+/-) mice fed with plain water (H2O) or 10% ethanol for 1 wk were stained with hematoxylin and eosin (original magnification ×10). A: LMC H2O; B: LMC ethanol; C: Sod2+/- H2O; D: Sod2+/- ethanol.
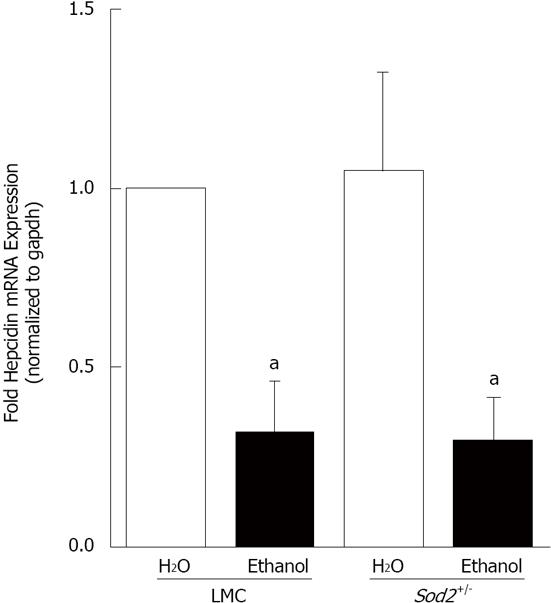
Figure 3 Alcohol and hepcidin mRNA expression.
cDNA, synthesized from RNA isolated from the livers of Sod2+/- and littermate control mice (LMC) mice fed with 10% ethanol or plain water (H2O) for one week, was used as a template for real-time quantitative polymerase chain reaction. Hepcidin mRNA expression in alcohol-treated LMC and Sod2+/- mice was expressed as fold expression of that in water-treated LMC mice. The letter a indicates statistical significance (aP < 0.05).
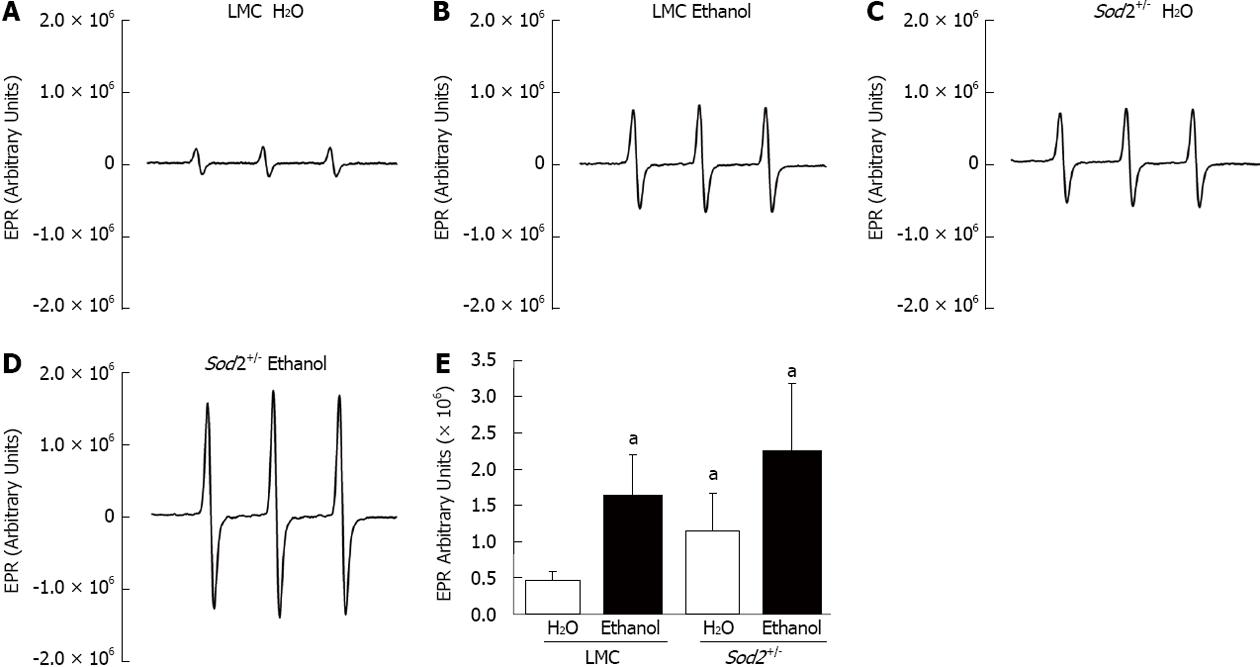
Figure 4 Effect of alcohol on superoxide levels.
Hepatocytes, isolated by perfusion from the livers of littermate control (LMC) and Sod2+/- mice fed with 10% ethanol or plain water (H2O), were subjected to electron paramagnetic resonance (EPR) spectroscopy, as described in Methods. A-D: Representative EPR spectra; E: Summary of data presented as mean ± SD, n = 6. The letter a indicates statistical significance (aP < 0.05).
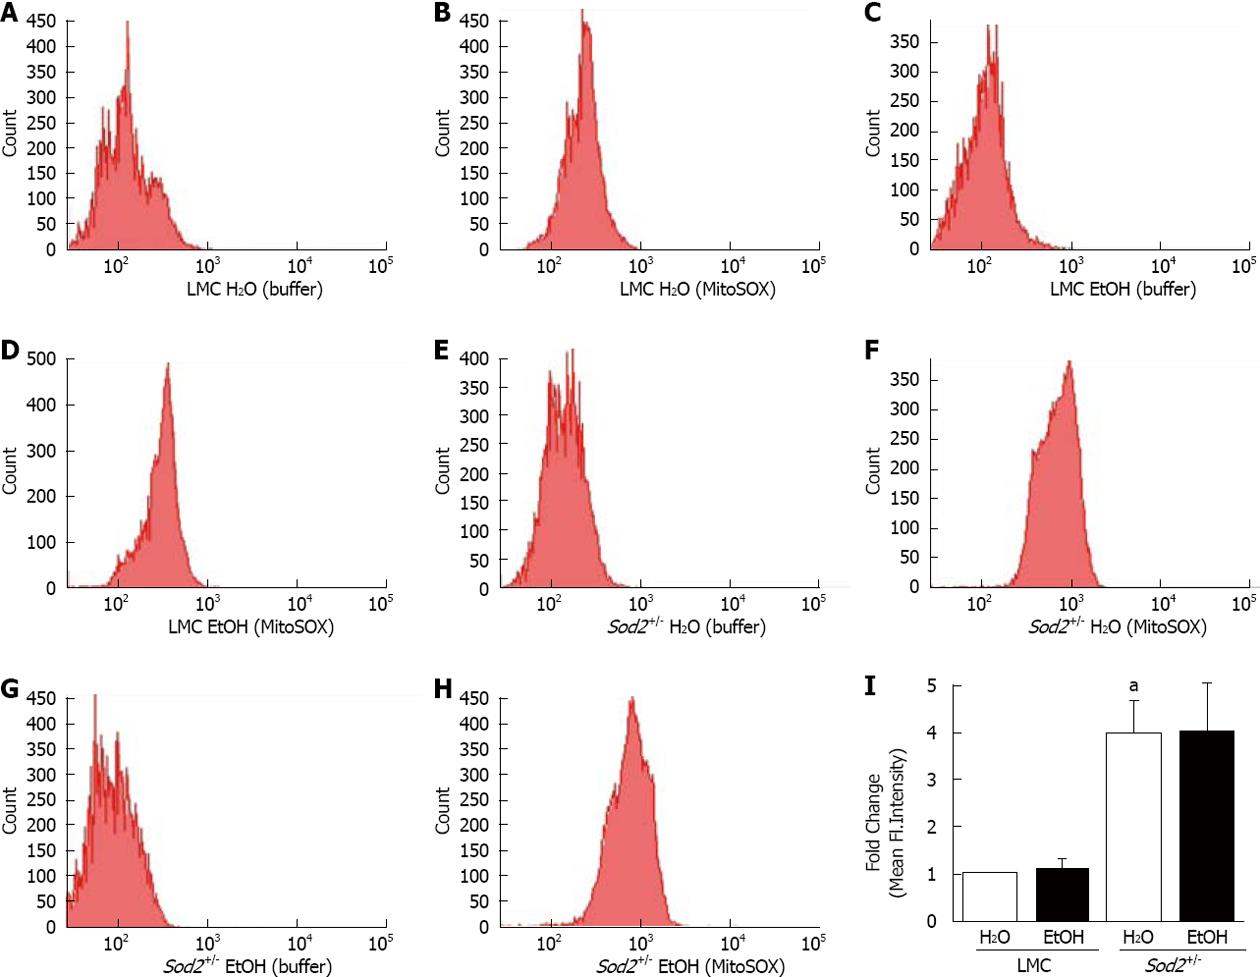
Figure 5 Alcohol and mitochondrial superoxide production.
Hepatocytes, isolated from the livers of LMC (A-D) and Sod2+/- (E-H) mice fed with plain water (H2O; A, B, E, F) or 10% ethanol (EtOH; C, D, G, H), were incubated with buffer, as control (A, C, E, G) or MitoSOX Red (B, D, F, H) and analyzed by flow cytometry, as described in Methods. A-H: Representative histograms; I: Quantitative analysis showing fold changes in mean fluorescent intensity in hepatocytes of water-fed Sod2+/-, and alcohol-treated LMC and Sod2+/- compared to that of littermate control (LMC) mice fed with plain water. Samples incubated with MitoSOX Red were normalized for background fluorescence by subtracting the values of control (buffer only) incubations. The letter a indicates statistical significance (aP < 0.05).
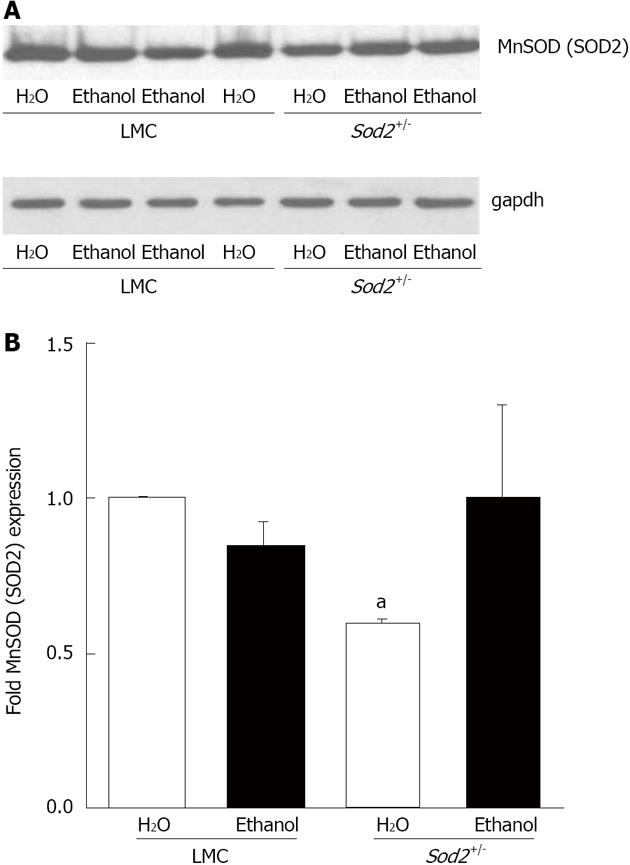
Figure 6 Manganese superoxide dismutase (SOD2) expression.
A: Whole cell lysate proteins, isolated from the hepatocytes of Sod2+/- and littermate control mice (LMC) mice livers treated with 10% ethanol or plain water (H2O) for 1 wk, were resolved by SDS-Polyacrylamide gel electrophoresis and subjected to western blotting by using an antibody against mouse SOD2. An anti-gapdh antibody was used as control to confirm equal protein loading; B: Autoradiographs were scanned, and SOD2 expression was quantified by normalizing to gapdh protein expression. Normalized protein expression in water-fed Sod2+/- and alcohol-fed Sod2+/- or littermate control mice was expressed as fold expression of that in water-fed littermate control mice. The letter a indicates statistical significance (aP < 0.05).
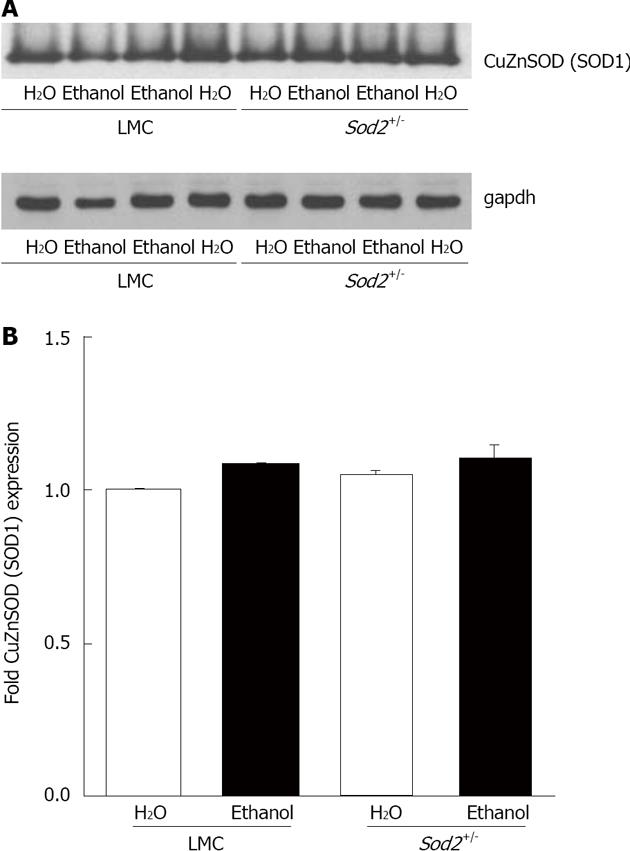
Figure 7 CuZn superoxide dismutase (SOD1) expression.
A: Whole cell lysate proteins, isolated from the hepatocytes of Sod2+/- and littermate control mice livers treated with 10% ethanol or plain water (H2O) for 1 wk, were resolved by SDS-Polyacrylamide gel electrophoresis and subjected to western blotting by using an antibody against mouse SOD1. An anti-gapdh antibody was used as the loading control; B: Autoradiographs were scanned, and SOD1 expression was quantified by normalizing to gapdh expression. Normalized protein expression in water-fed Sod2+/- and alcohol-fed Sod2+/- and control mice was expressed as fold expression of that in water-fed control mice. LMC: Littermate control mice.
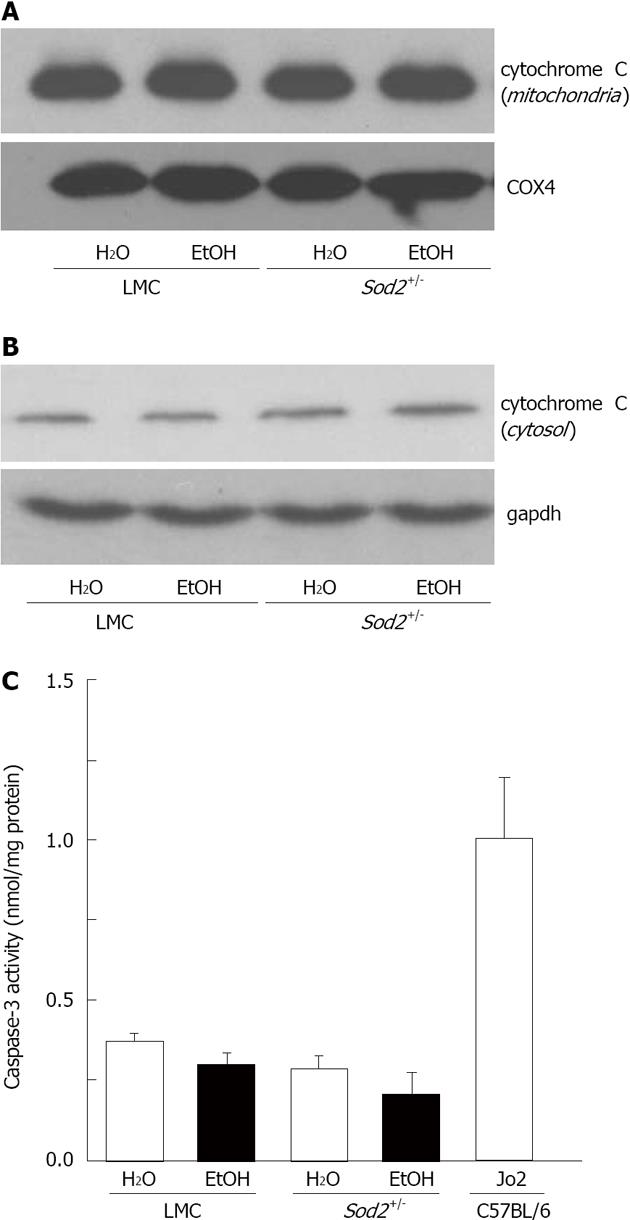
Figure 8 Detection of apoptosis in Sod2+/- mice with alcohol exposure.
Liver protein lysates, isolated from mitochondria (A) or cytosol (B) of littermate control (LMC) and Sod2+/- mice fed with 10% ethanol (EtOH) or plain water (H2O), were resolved by SDS-Polyacrylamide gel electrophoresis and subjected to western blotting by using an anti-cytochrome c antibody. Anti-COX4 (A) and gapdh (B) antibodies were used as loading controls; C: Whole cell lysate (WCL) proteins isolated from the livers of LMC and Sod2+/- mice fed with 10% ethanol or plain water were employed to measure caspase-3 activity, as described in Methods. WCL isolated from the livers of C57BL/6 strain wild-type male mice 6 h after the injection (ip) of anti-mouse Fas agonist antibody, Jo2 (0.32 μg/g. b.w., Millipore) were used as internal control for caspase-3 assays.
- Citation: Harrison-Findik DD, Lu S, Zmijewski EM, Jones J, Zimmerman MC. Effect of alcohol exposure on hepatic superoxide generation and hepcidin expression. World J Biol Chem 2013; 4(4): 119-130
- URL: https://www.wjgnet.com/1949-8454/full/v4/i4/119.htm
- DOI: https://dx.doi.org/10.4331/wjbc.v4.i4.119


