Copyright
©The Author(s) 2022.
World J Biol Chem. Jan 27, 2022; 13(1): 15-34
Published online Jan 27, 2022. doi: 10.4331/wjbc.v13.i1.15
Published online Jan 27, 2022. doi: 10.4331/wjbc.v13.i1.15
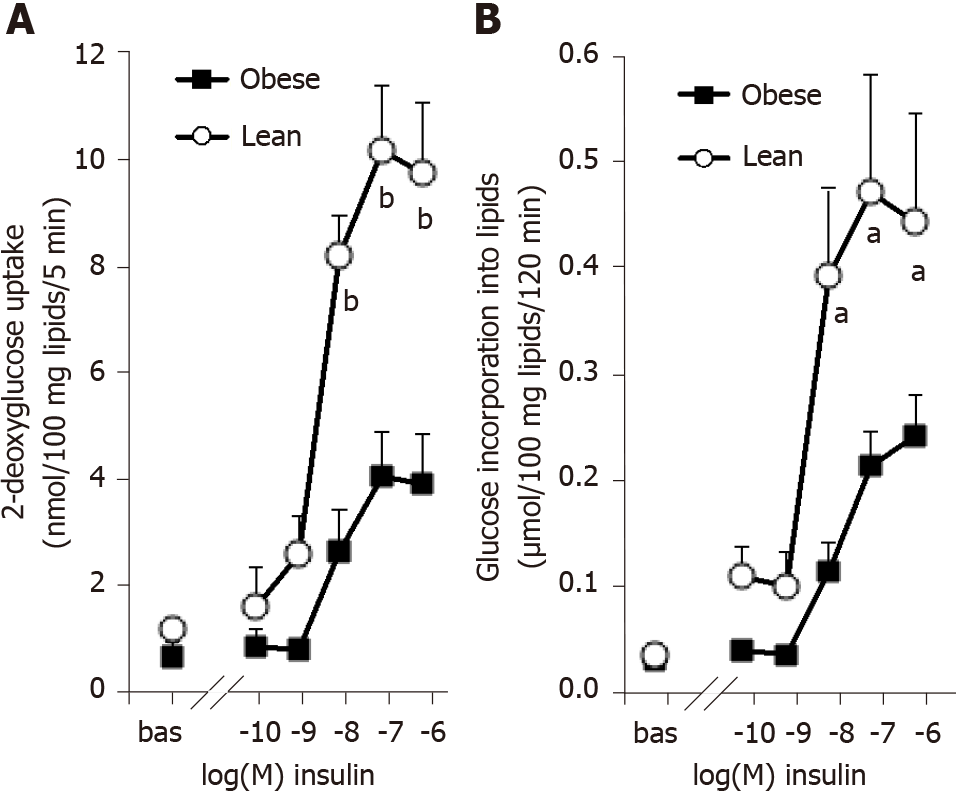
Figure 1 Influence of obesity on the dose-dependent responses of rat adipocytes to insulin activation of hexose uptake and of lipogenesis.
A: 3H-2-deoxyglucose (2-DG) transport was assayed for 5 min after 45-min incubation of rat fat cells without (bas) or with increasing doses of insulin. 2-DG uptake is expressed as nmoles of intracellular radiolabeled 2-DG/100 mg lipids/5 min; B: 3H-glucose incorporation into lipids was measured after 120-min incubation with the indicated doses of insulin and is expressed as µmoles tritiated glucose incorporated/100 mg lipids. Adipocytes from lean (open circles) or obese rats (black squares) were incubated at a cell suspension averaging 11.5 and 11.7 mg lipids/assay tube, respectively. A significant influence of genotype on the three higher doses of insulin was found at bP < 0.001 for 2-DG uptake (n = 10 lean and 10 obese male rats, with male/female = 1) and at aP < 0.05 for lipogenesis (n = 8 lean and 6 obese male rats). Each point is the mean ± SEM of n animals, with error bars lying within the caption in several occurrences.
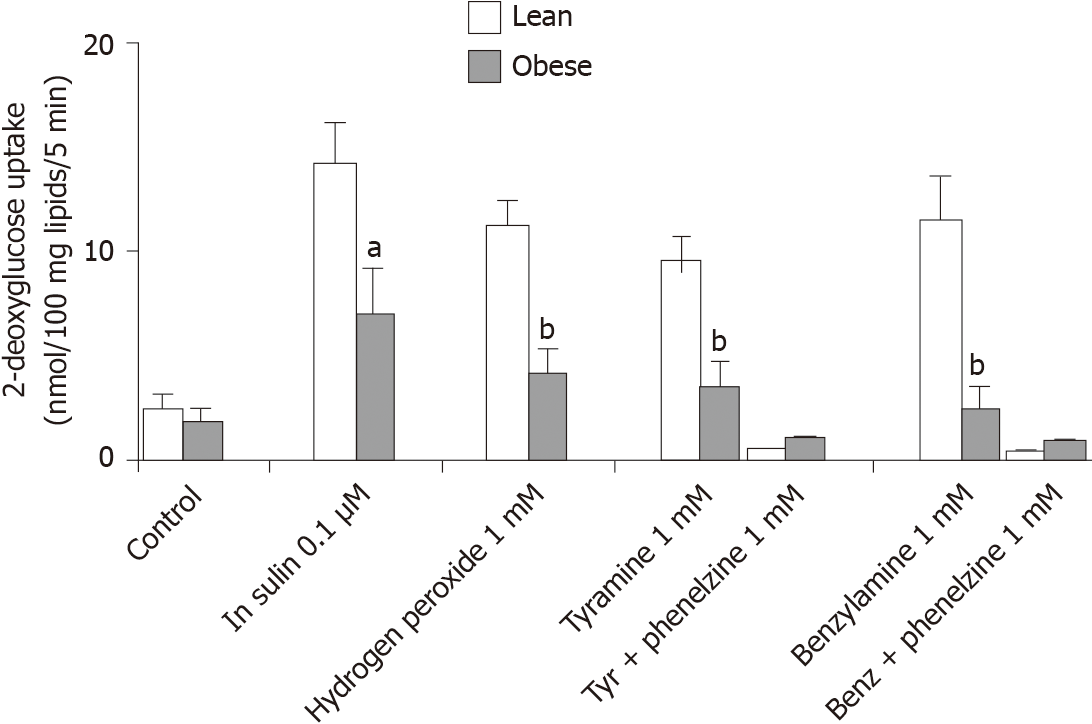
Figure 2 Insulin-like effects of vanadium combined with hydrogen peroxide or with amine oxidase substrates on hexose uptake into rat adipocytes.
Sodium orthovanadate was present at 100 µmol/L in all the conditions: Alone (control) or combined with 100 nmol/L insulin, or with 1 mmol/L hydrogen peroxide, tyramine, and benzylamine. The amines were tested without and with 1 mmol/L phenelzine. 2-deoxyglucose (2-DG) uptake is expressed as nmoles of intracellular 2-DG/100 mg lipids/5 min. Mean ± SEM of five lean (open columns) and five obese male rats (shaded columns). Significantly different from corresponding condition in lean at: aP < 0.05; bP < 0.01. Blockade of tyramine (tyr) or benzylamine (benz) effect by phenelzine was significant at P < 0.001 in both genotypes.
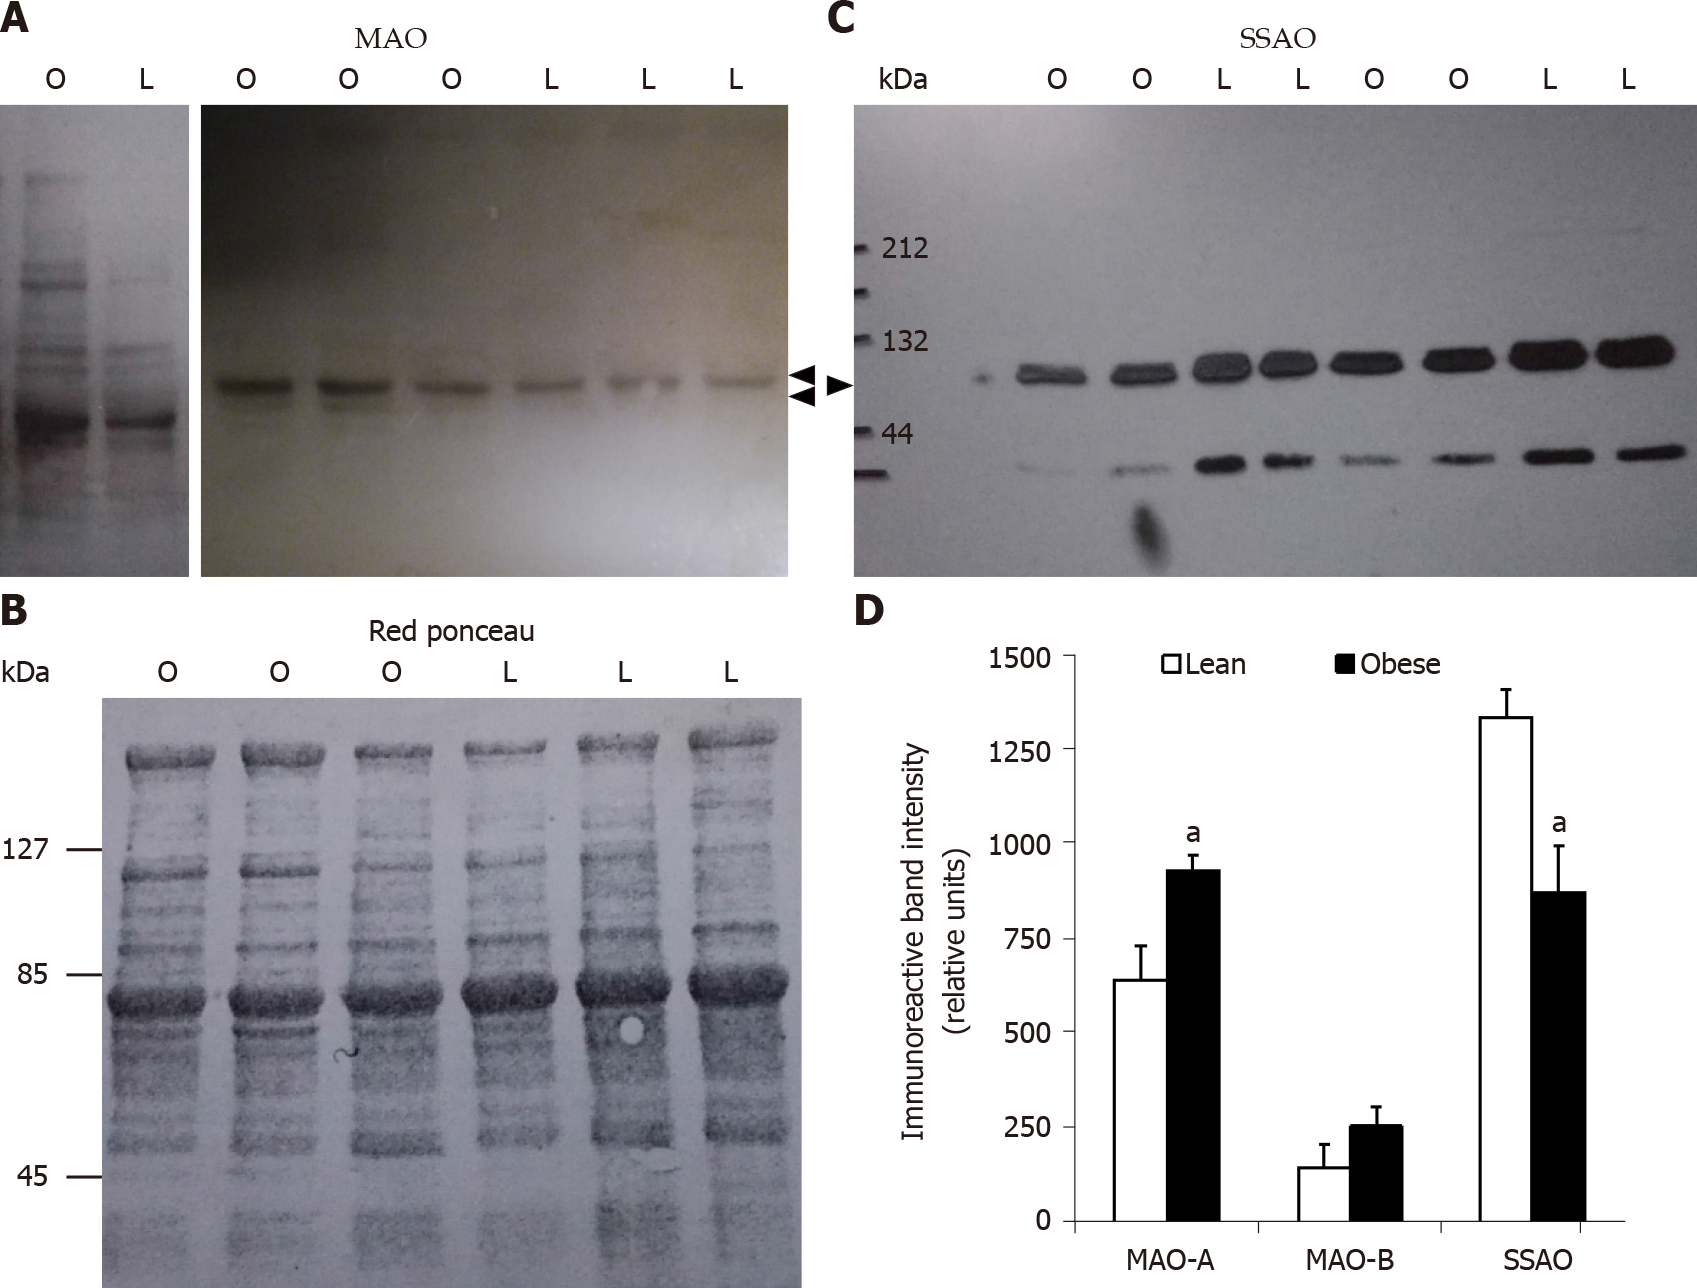
Figure 3 Increased monoamine oxidase and decreased semicarbazide-sensitive amine oxidase protein expression in subcutaneous adipose tissue from obese rats when compared to lean littermates.
Proteins solubilized from white adipose tissue homogenates were separated by sodium dodecyl sulfate-polyacrylamide gel electrophoresis and blotted proteins detected using primary antibodies directed against monoamine oxidase (MAO) or semicarbazide-sensitive amine oxidase (SSAO). 50 µg and 5 µg proteins per lane were deposed for MAO and SSAO immunoblots, respectively. A: Immunoblots showing immunoreactive MAO-A and MAO-B at approximately 61 and 55 kDa (arrows) for obese (O) and lean (L) rats; B: Red ponceau control of protein loading for a representative membrane shown in panel A; C: Representative immunoblot of SSAO showing a major band at approximately 85 kDa (arrow); D: Densitometry analysis of the major bands is shown for 7-8 rats per genotype. Different from lean (open columns) at: aP < 0.05.
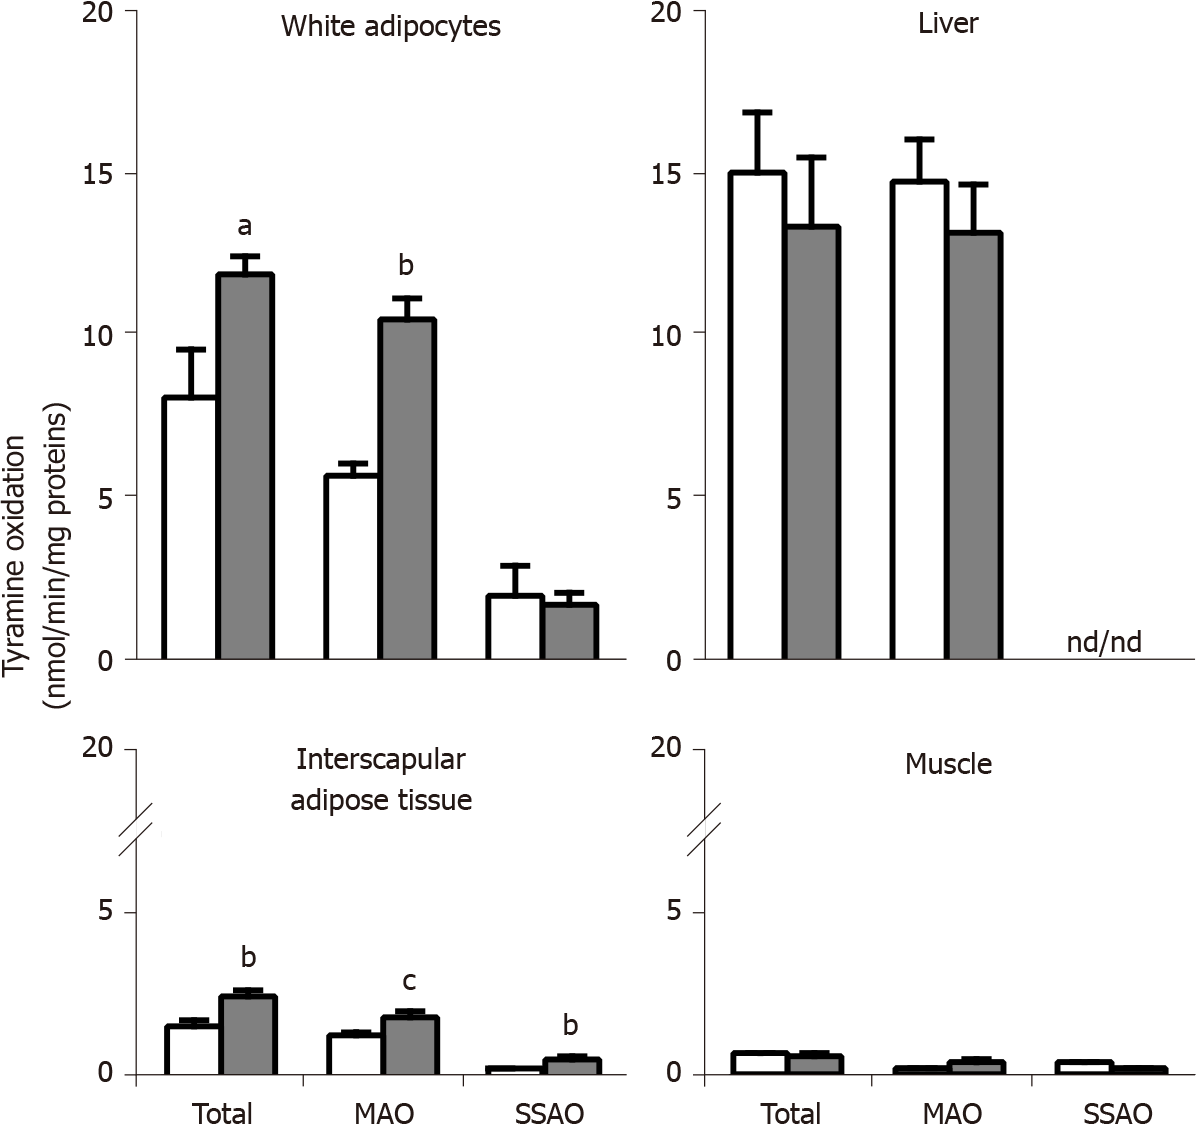
Figure 4 Oxidation of tyramine by membrane preparations from different tissues of obese and lean Zucker rats.
Crude membranes prepared by centrifugation from adipocytes isolated from visceral white adipose tissue, or from the liver, brown adipose tissue, and soleus muscle, were incubated for 20 min at 37 °C with 0.5 mmol/L 14C-tyramine in phosphate buffer (200 mmol/L) without (total oxidation), with 1 mmol/L semicarbazide (monoamine oxidase, MAO), or with 1 mmol/L pargyline (semicarbazide-sensitive amine oxidase, SSAO). The minor oxidation remaining in the presence of both inhibitors (semicarbazide + pargyline), therefore non-SSAO and non-MAO, was subtracted in all cases. Mean ± SEM from four determinations for lean (open columns) and five for obese male rats (dark columns); ND: Non-detectable. Significantly different from lean at: aP < 0.05; bP < 0.01; cP < 0.001.
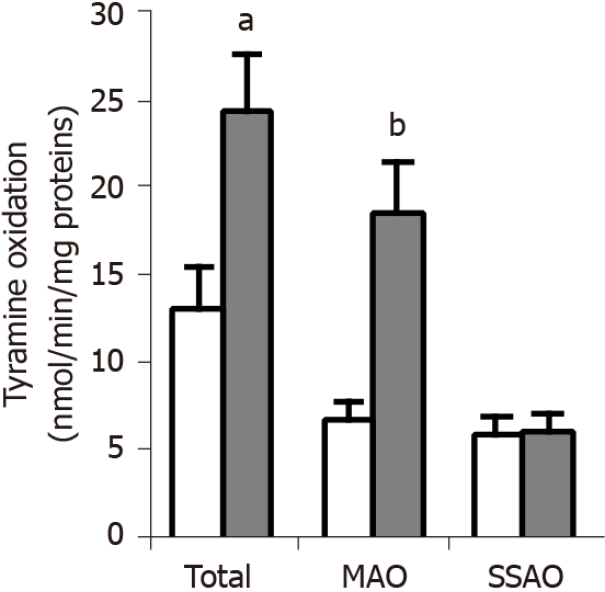
Figure 5 Tyramine oxidation in adipocytes from obese and lean Zucker rats.
Undamaged adipocytes isolated from visceral white adipose tissue of lean (open columns) and obese (dark columns) rats were incubated in the presence of 1 mmol/L 14C-tyramine for 45 min at 37 °C. Total oxidation was measured without any inhibitor, while the oxidation that resisted to 1 mmol/L semicarbazide was due to monoamine oxidase, and the oxidation resistant to 1 mmol/L pargyline was semicarbazide-sensitive amine oxidase-dependent. The velocities of oxidation are expressed as as nmoles of radiolabeled tyramine oxidation products generated per min and per mg of proteins. Each column is the mean ± SEM of eight determinations for lean and nine determinations for obese male rats. Significantly different from lean at: aP < 0.05; bP < 0.01.
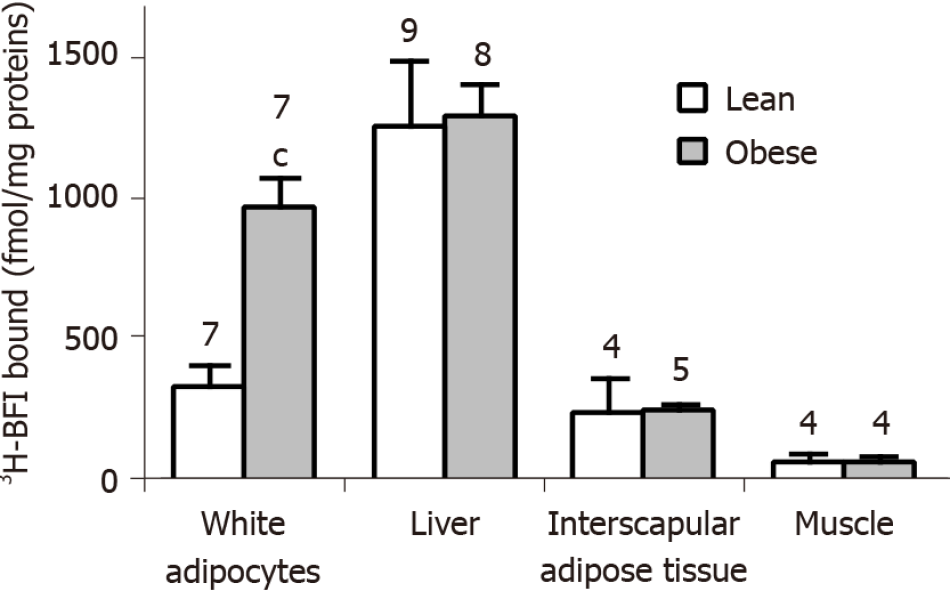
Figure 6 Tissue-selective larger imidazoline binding site density in the white adipocytes from obese rats when compared to lean littermates.
Crude membranes were prepared from adipocytes isolated from white subcutaneous fat depots, the liver, interscapular brown adipose tissue, and soleus muscle, and incubated for 45 min with 20 nmol/L3H-2-(2-benzofuranyl)-2-imidazoline (3H-BFI), before separation by vacuum filtration as indicated in Methods. Only the specific binding of 3H-BFI, i.e., displaceable by 100 µmol/L cirazoline, is shown. For each tissue, there was one determination of specific binding per rat, calculated by the difference between total and non-specific binding. Results are the mean ± SEM of the number of rats indicated above each column (open for lean, shaded for obese rats). Significantly different from corresponding value in lean at: cP < 0.001.
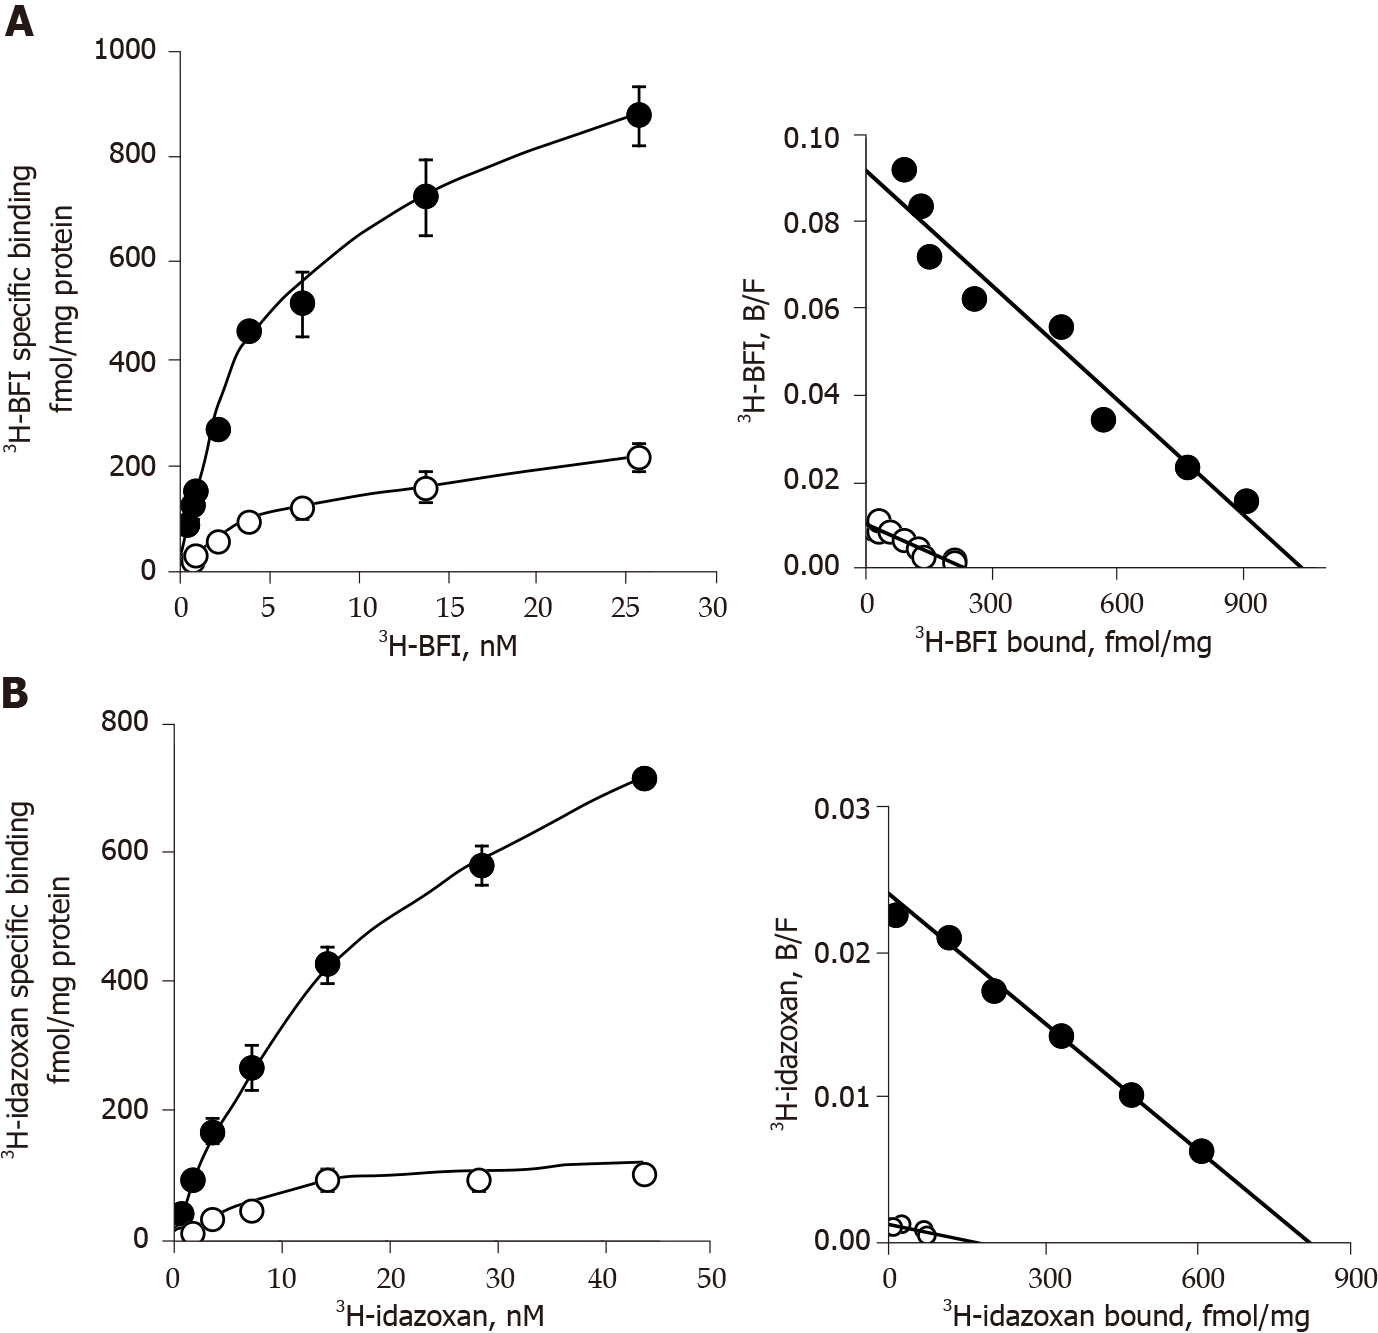
Figure 7 Saturation binding analysis with 3H-2-(2-benzofuranyl)-2-imidazoline and 3H-idazoxan in adipocyte membranes from white subcutaneous adipose tissue of lean and obese rats.
A and B: Adipocyte membranes from subcutaneous white adipose tissue of lean (open circles) or obese (dark circles) littermates were incubated for 45 min with increasing concentrations of 3H-2-(2-benzofuranyl)-2-imidazoline alone (A) or 3H-idazoxan plus 10 µmol/L rauwolscine (B). For each tested concentration, total binding was measured in the absence of any competitor while non-specific binding was determined in the presence of 100 µmol/L cirazoline. Left panels show the saturation curves of specific binding, with each point corresponding to the mean ± SEM of three separate saturation experiments. Right panels show the Scatchard plot (bound/free vs bound) of the saturation experiment for each radioligand. Calculated parameters of saturation experiments are reported in Table 2.
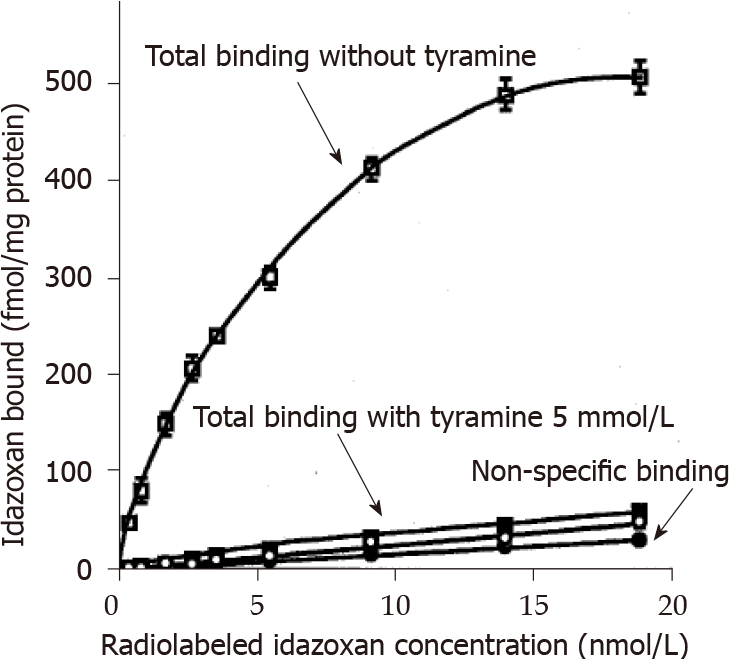
Figure 8 Influence of tyramine on idazoxan binding to liver crude membranes.
Total and non-specific binding of 3H-idazoxan to liver crude membranes from lean Zucker rats is shown without (open symbols) and with 5 mmol/L tyramine (closed symbols) added prior to 45-min incubation at room temperature. Without tyramine, the resulting specific binding was characterized by a Bmax of 622 ± 15 fmol/mg protein and a KD of 5.1 ± 0.4 nmol/L. Each point is the mean ± SEM of three liver preparations containing 617 ± 120 µg protein/assay. Inhibitory influence of tyramine on total binding was significant at P < 0.001.
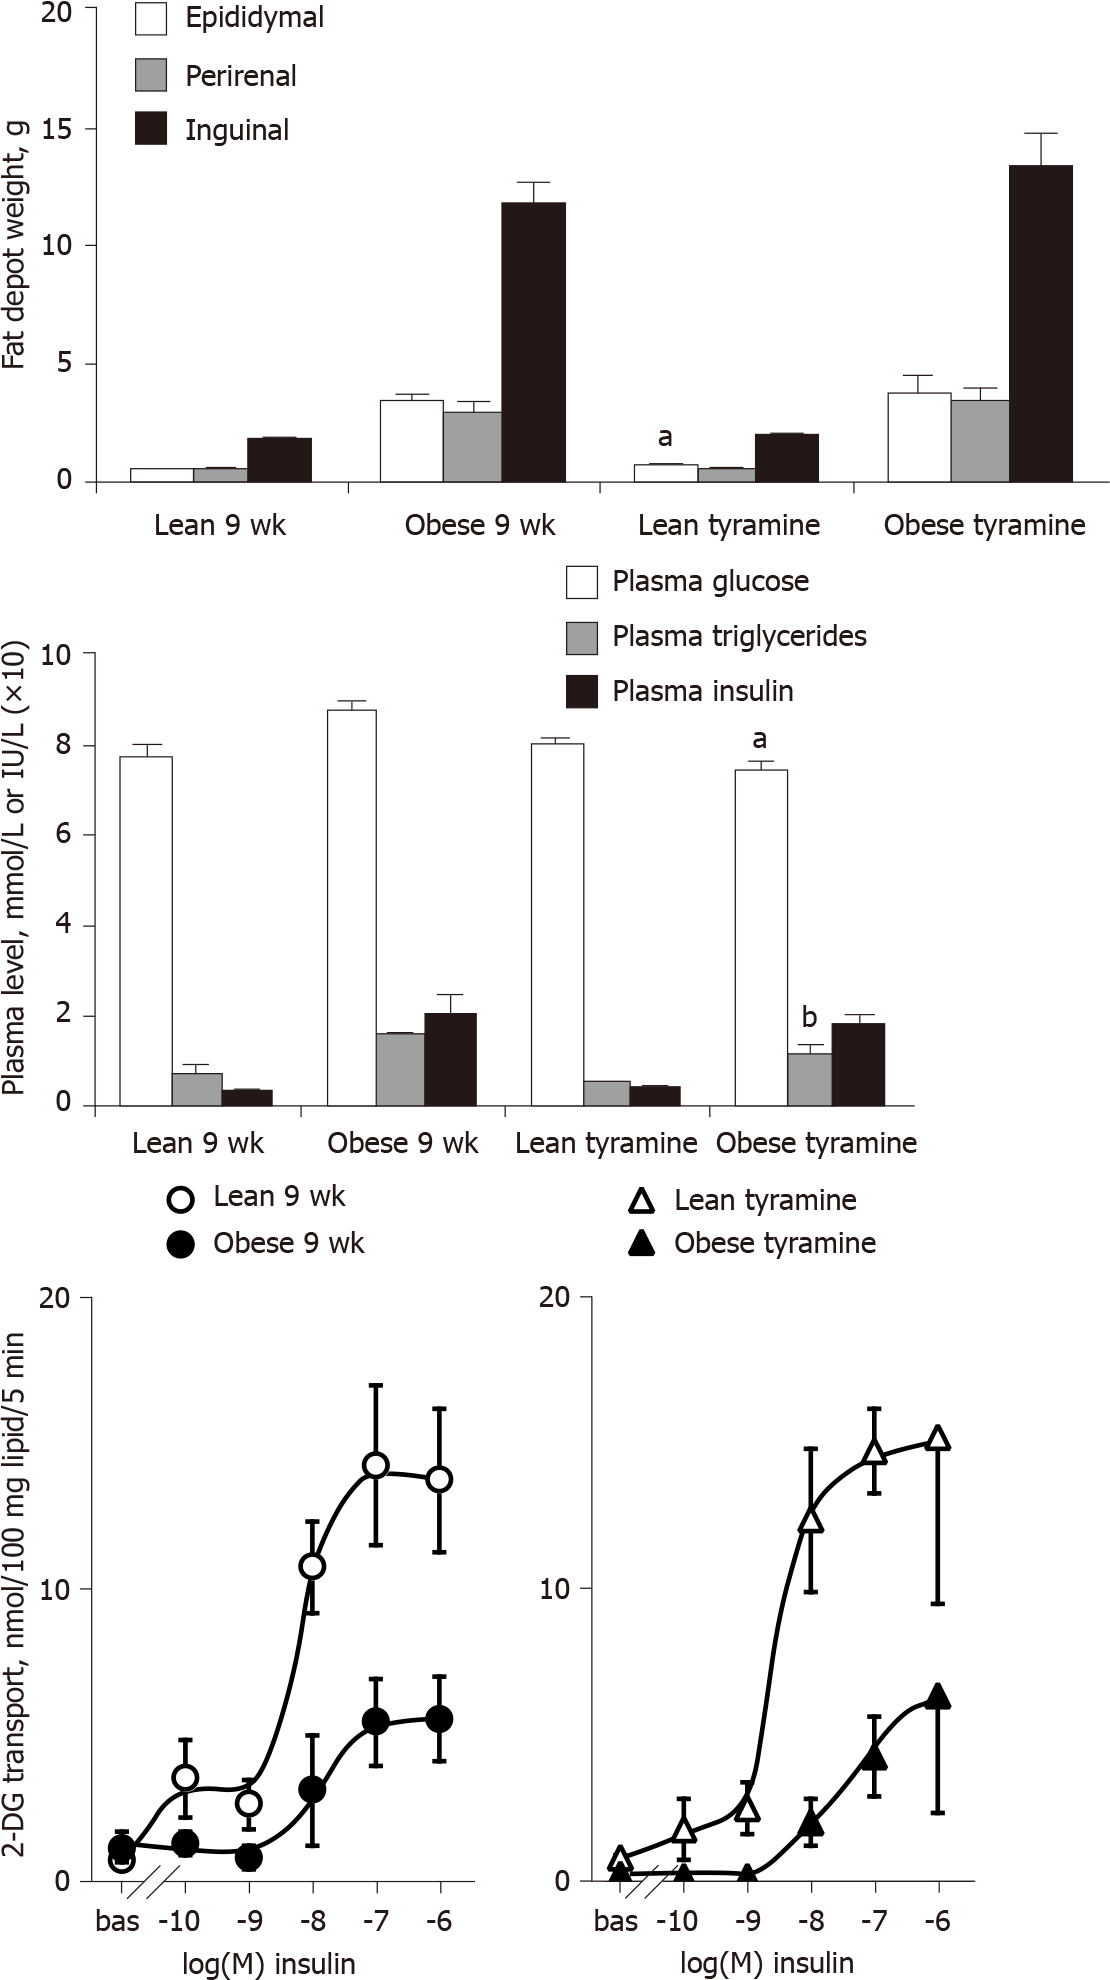
Figure 9 Influence of ‘tyramine + vanadate’ treatment on adiposity, glucose and lipid handling, and insulin responsiveness of adipocytes in lean and obese rats.
Upper part: Weight of three white adipose tissues from 9-wk old Zucker male rats, either from the lean and obese control groups (left) or from the groups receiving daily s.c. administration of 3 mg/kg tyramine + 0.3 mg/kg vanadate (tyramine, right) for 7 d. Middle part: Glucose, triacylglycerol, and insulin fasting plasma levels in the same control and treated groups. Lower part: Hexose transport in adipocytes from lean (open symbols) or obese (closed symbols) rats, in the absence (bas = basal) or presence of the indicated doses of insulin in control (circles) or treated (triangles) groups. Each column or point is the mean ± SEM of three treated or four control rats per genotype. The influence of genotype on all parameters was identical to that specified in previous figures and not indicated for the sake of clarity. Significant difference between tyramine-treated and corresponding control at: aP < 0.05; bP < 0.01.
- Citation: Carpéné C, Marti L, Morin N. Increased monoamine oxidase activity and imidazoline binding sites in insulin-resistant adipocytes from obese Zucker rats . World J Biol Chem 2022; 13(1): 15-34
- URL: https://www.wjgnet.com/1949-8454/full/v13/i1/15.htm
- DOI: https://dx.doi.org/10.4331/wjbc.v13.i1.15


