Copyright
©2013 Baishideng Publishing Group Co.
World J Gastrointest Surg. Apr 27, 2013; 5(4): 129-134
Published online Apr 27, 2013. doi: 10.4240/wjgs.v5.i4.129
Published online Apr 27, 2013. doi: 10.4240/wjgs.v5.i4.129
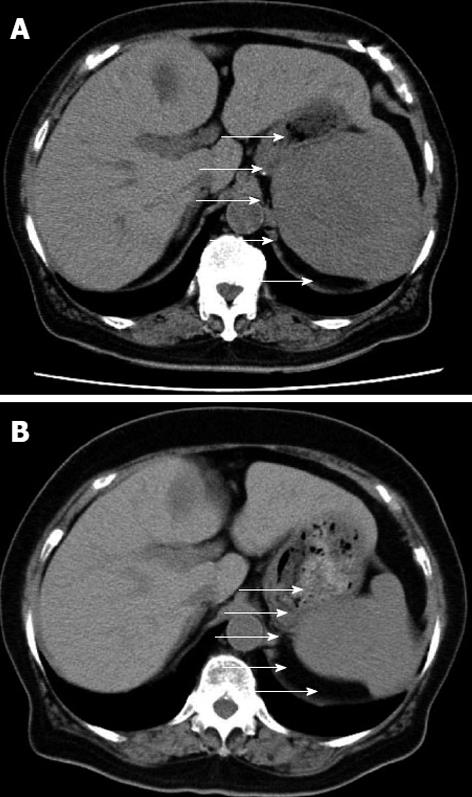
Figure 1 Abdominal computed tomography.
A: Just before the operation; B: 1 year before the operation. Arrows show the splenic tumor.
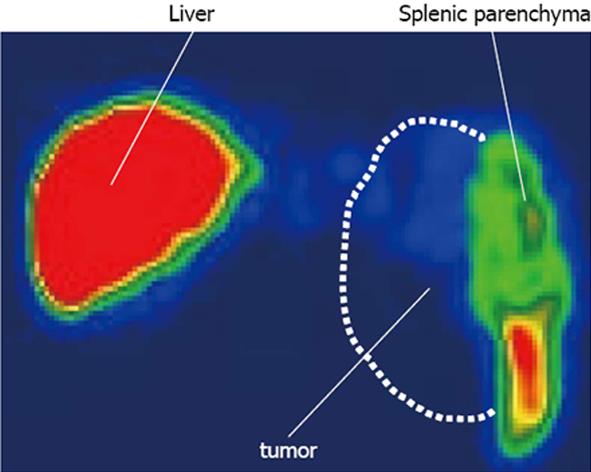
Figure 2 Technetium-99 m colloid scintiscanning.
The broken line shows the splenic tumor. The tumor did not uptake technetium-99 m colloid, and the tumor was therefore shown as a defect.
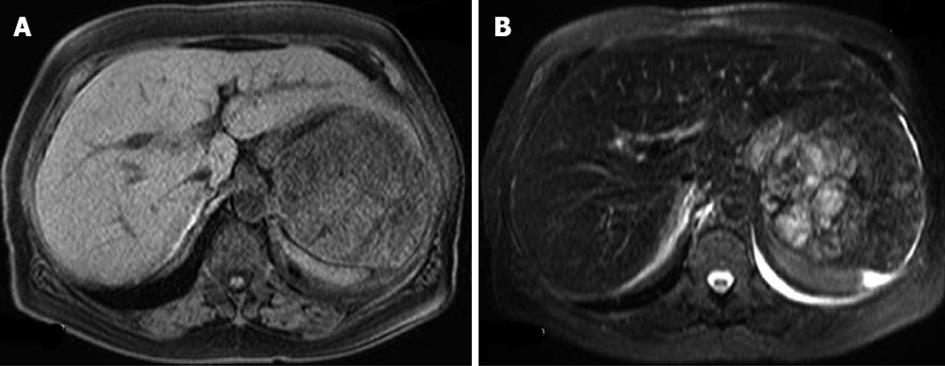
Figure 3 Magnetic resonance imaging just before the operation.
A: An iso-intense solid mass on T1-weighted images; B: A high-intensity multi-lobular mass on T2-weighted images.
Figure 4 Dynamic magnetic resonance imaging.
The tumor was enhanced from 20 to 120 s after the injection of contrast medium. Contrast medium gradually pooled in the tumor. A: 20 s; B: 60 s; C: 120 s.
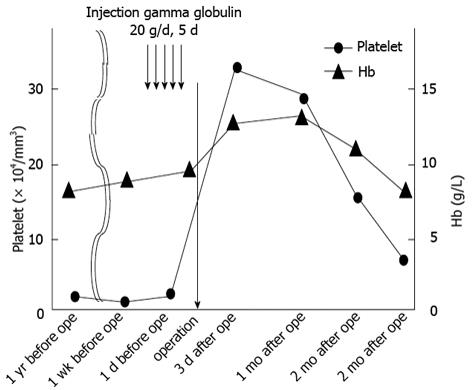
Figure 5 Clinical course of the patient.
Transition of the platelet number and hemoglobin value from 1 year before the operation to 3 mo after the operation. The black arrow shows the operation time. The circle shows the platelet number. The triangle shows the hemoglobin value.
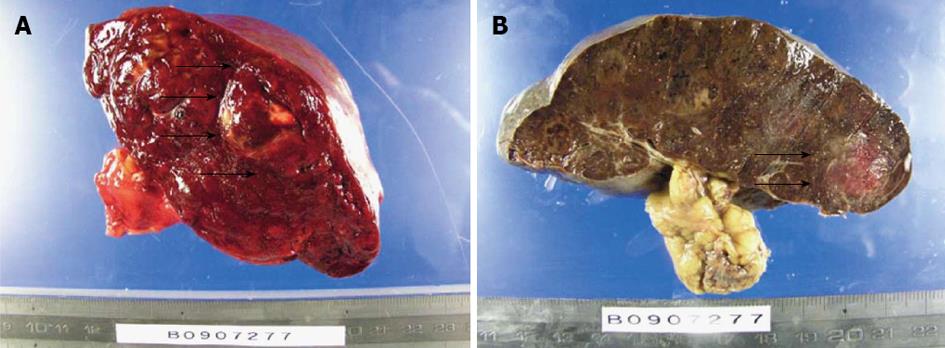
Figure 6 Macroscopic findings of the spleen.
A: The raw specimen. Multiple nodules with different colors from normal splenic tissue; B: The specimen after formalin fixation. The arrows show the tumor.
Figure 7 Microscopic findings.
A: Giemsa stain. Magnification is × 200; B: Giemsa stain. Magnification is × 400; C: MIB-1 labeling stain. The tumor consisted of cells with a foamy cytoplasm, hemosiderin-containing phagocytic cells (white arrow), and multilobular megakaryocytes. The MIB-1 labeling index was 8.1%.
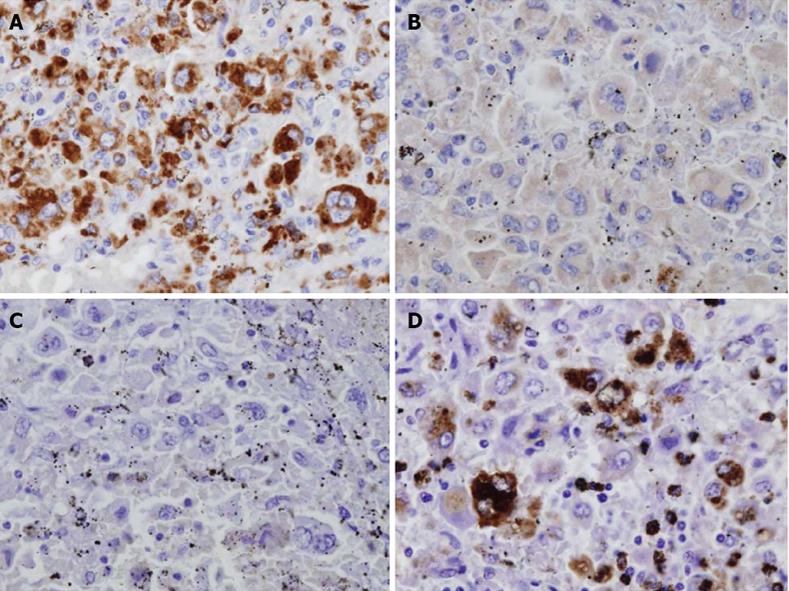
Figure 8 Immunohistopathological staining.
A: CD68; B: CD1a; C: S-100 protein; D: lysozyme CD68 stained positive. CD1a and S-100 protein were negative. Lysozyme was partially positive.
- Citation: Yamamoto S, Tsukamoto T, Kanazawa A, Shimizu S, Morimura K, Toyokawa T, Xiang Z, Sakurai K, Fukuoka T, Yoshida K, Takii M, Inoue K. Laparoscopic splenectomy for histiocytic sarcoma of the spleen. World J Gastrointest Surg 2013; 5(4): 129-134
- URL: https://www.wjgnet.com/1948-9366/full/v5/i4/129.htm
- DOI: https://dx.doi.org/10.4240/wjgs.v5.i4.129


