Copyright
©The Author(s) 2025.
World J Gastrointest Surg. Apr 27, 2025; 17(4): 100800
Published online Apr 27, 2025. doi: 10.4240/wjgs.v17.i4.100800
Published online Apr 27, 2025. doi: 10.4240/wjgs.v17.i4.100800
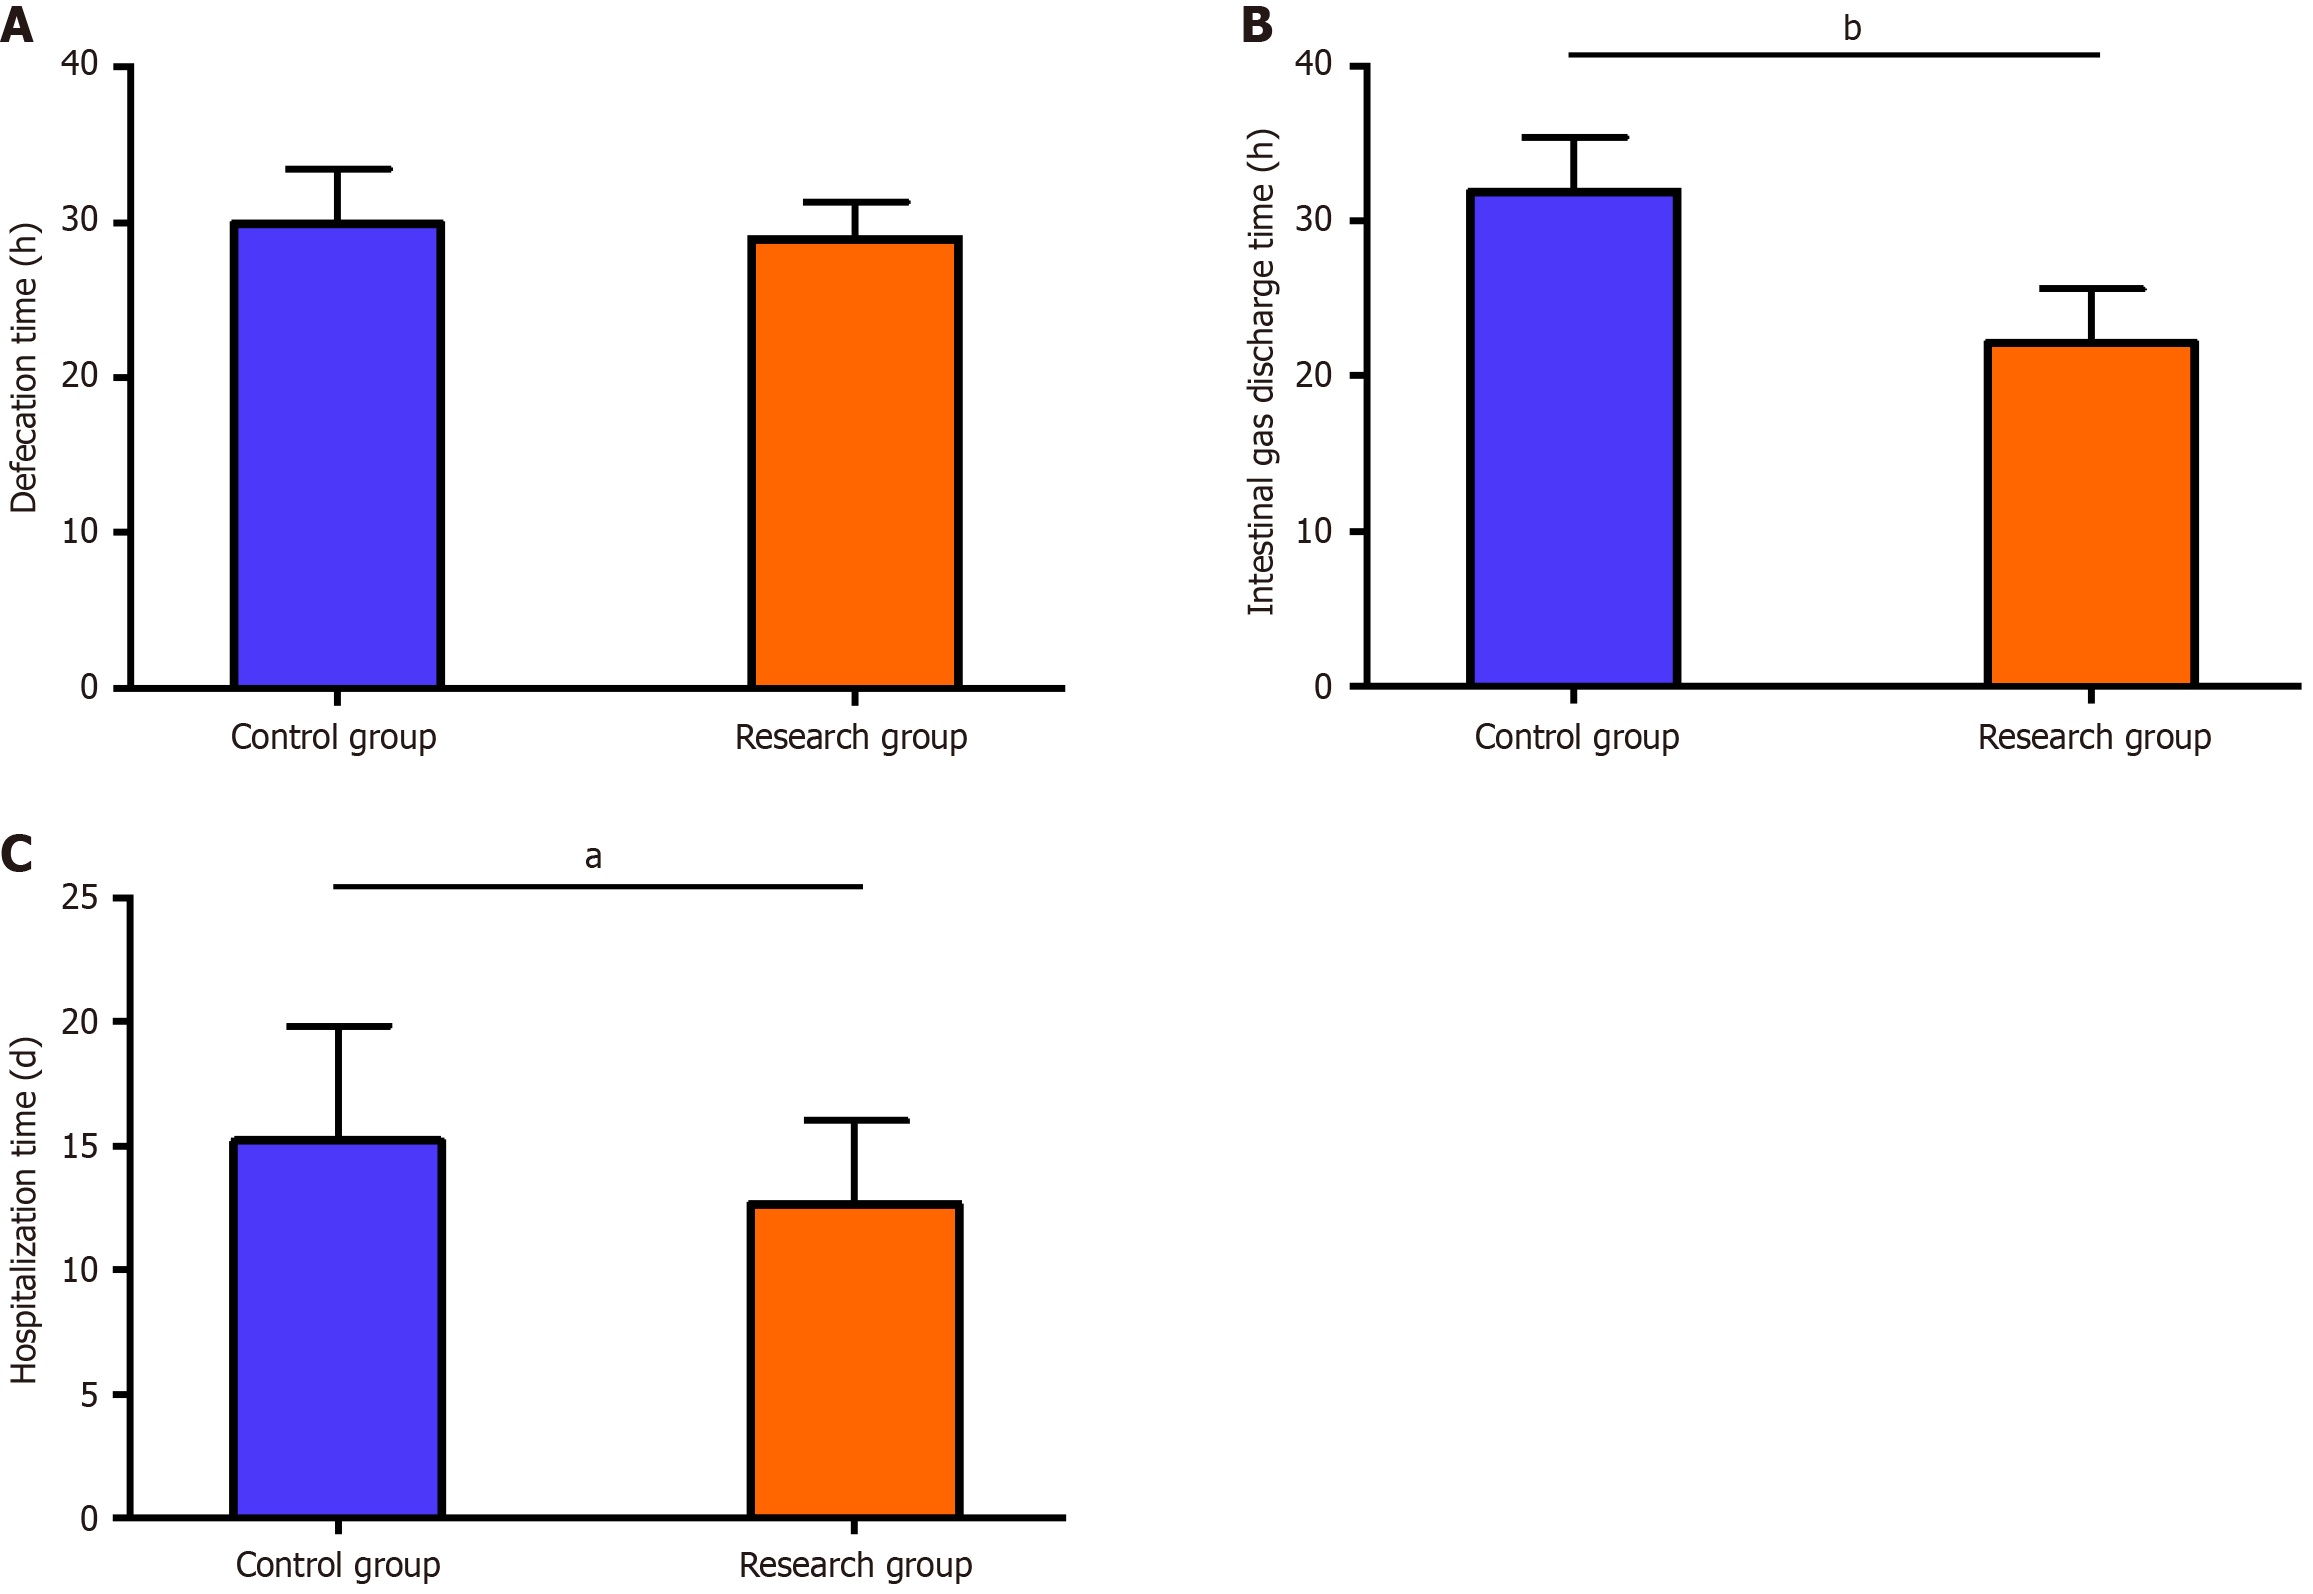
Figure 1 Defecation time, intestinal gas discharge time, and hospitalization time of the two groups.
A: Inter-group comparison of defecation time; B: Inter-group comparison of intestinal gas discharge time; C: Inter-group comparison of hospitalization time. aP < 0.05, bP < 0.01.
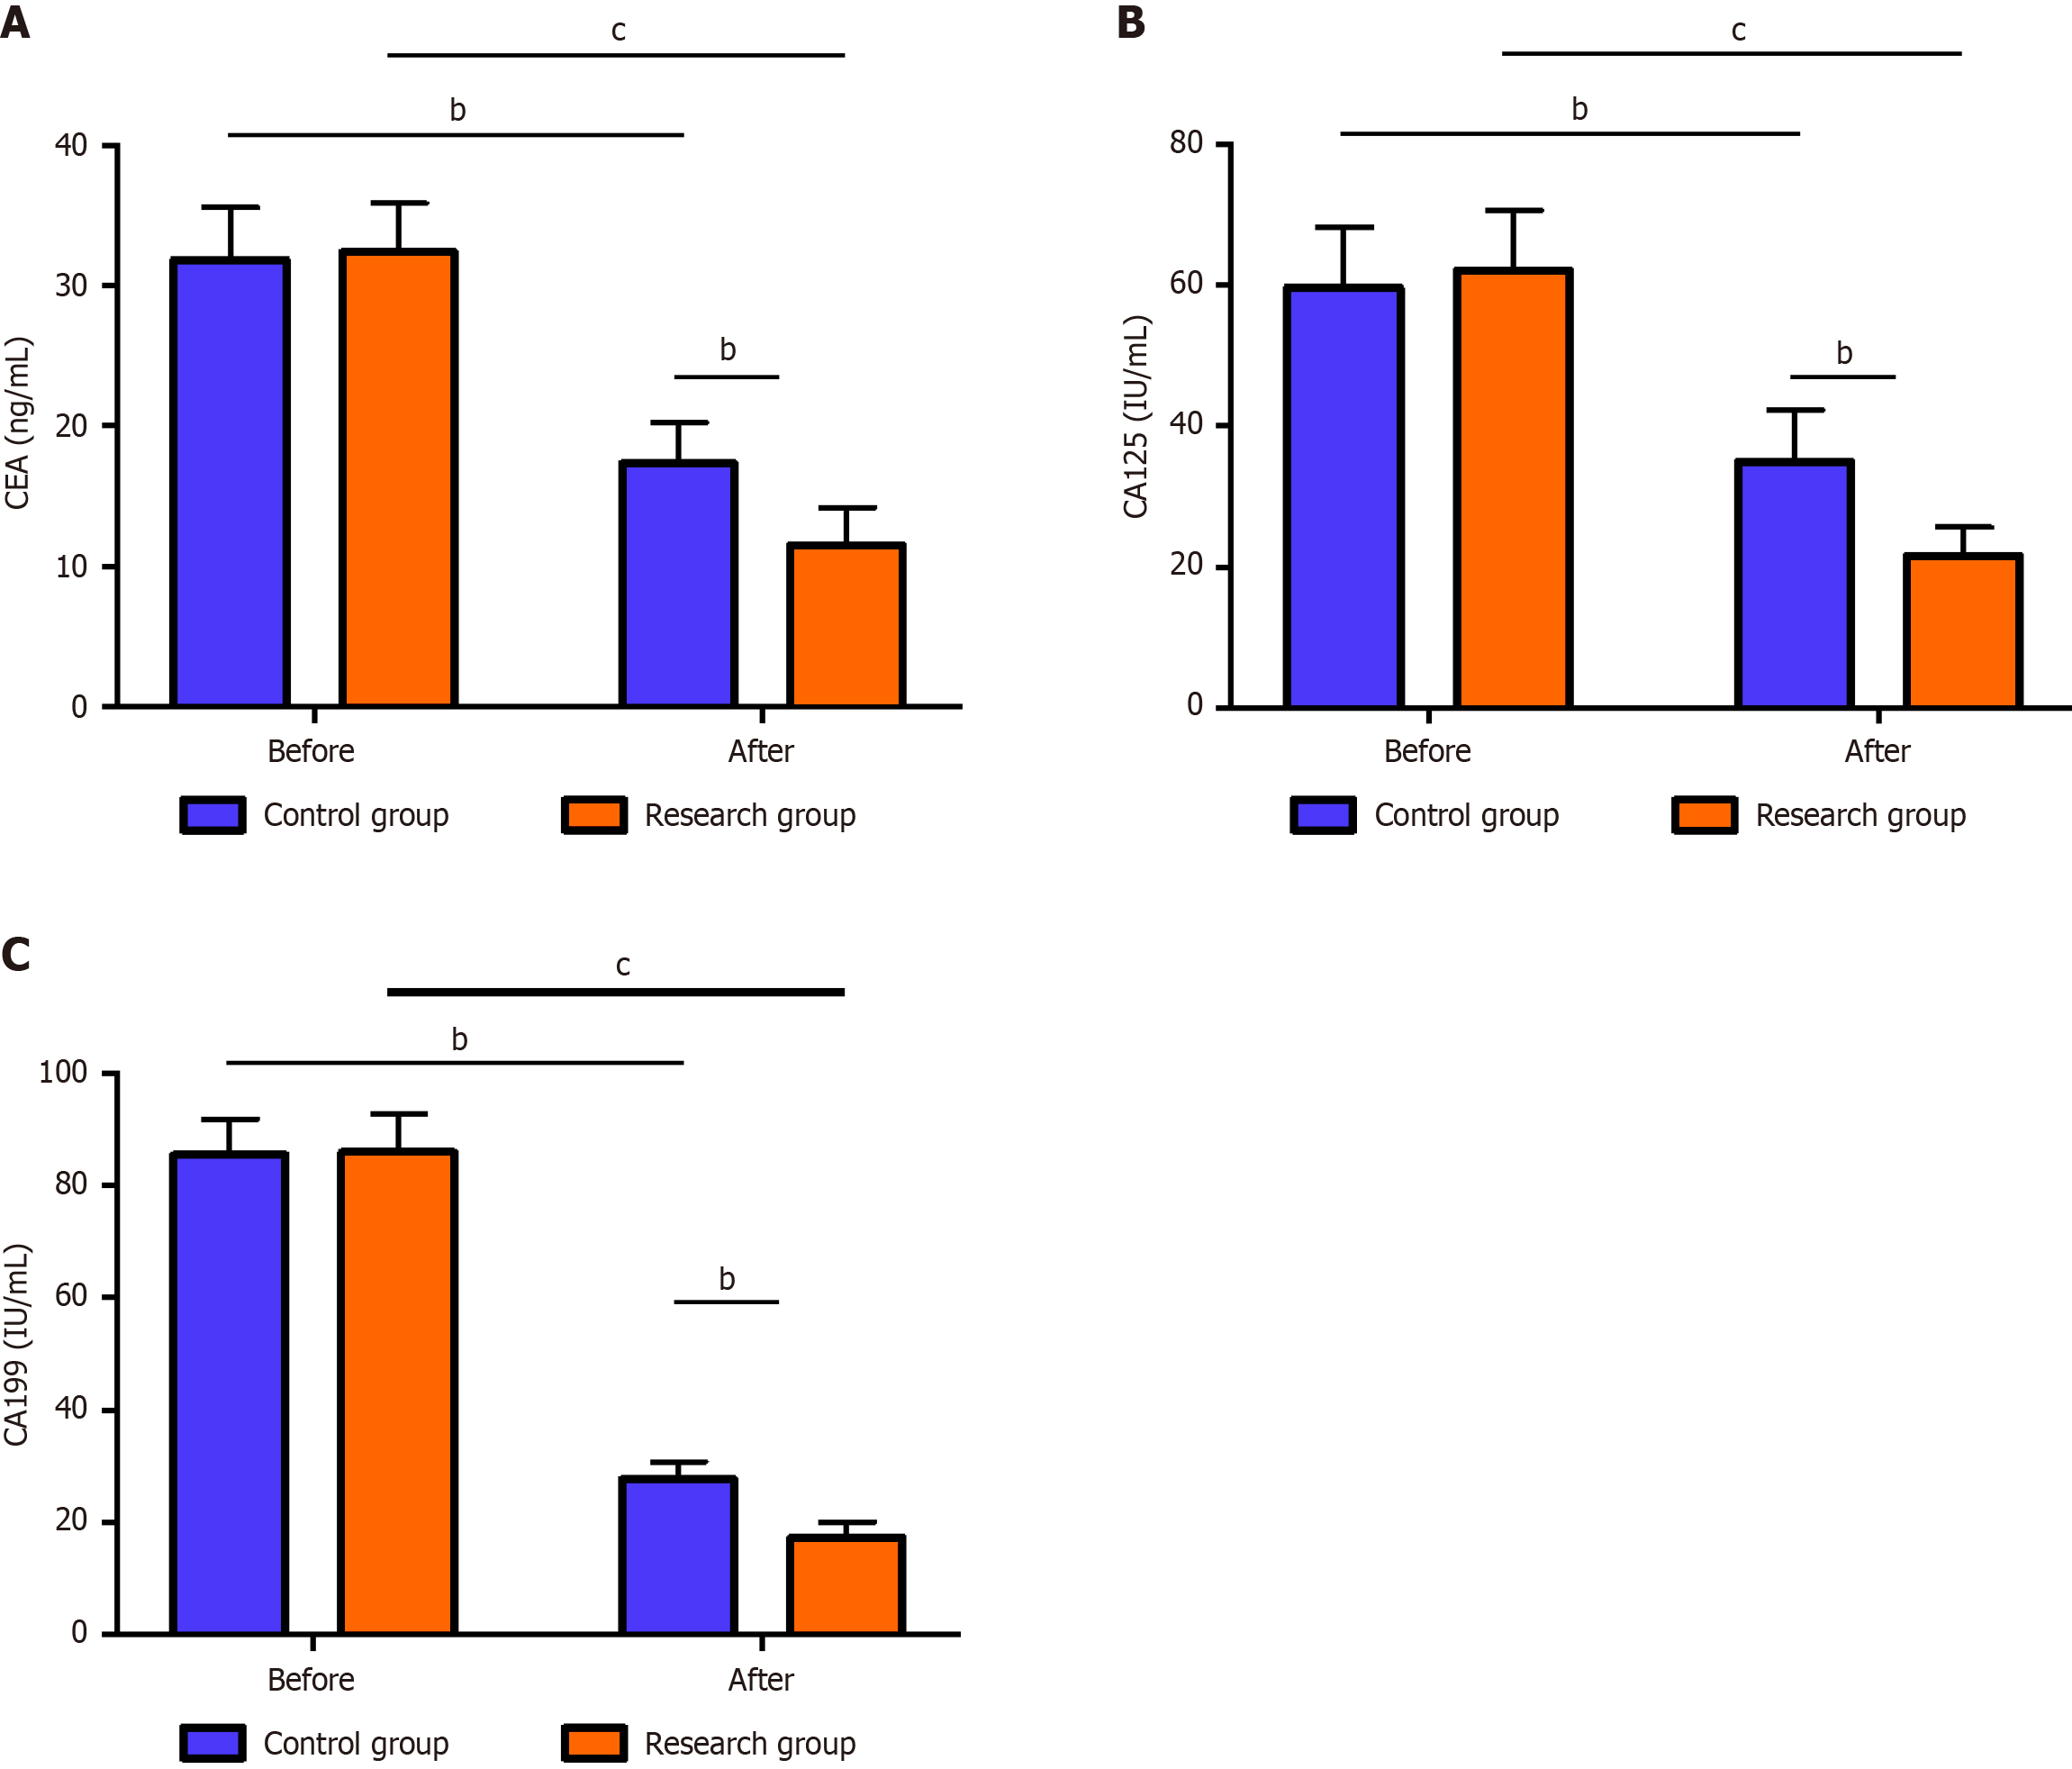
Figure 2 Serum markers of two groups.
A: Inter-group comparison of carcinoembryonic antigen levels; B: Inter-group comparison of carbohydrate antigen 125 (CA125) levels; C: Inter-group comparison of CA199 levels. bP < 0.01, cP < 0.001. CEA: Carcinoembryonic antigen; CA: Carbohydrate antigen.
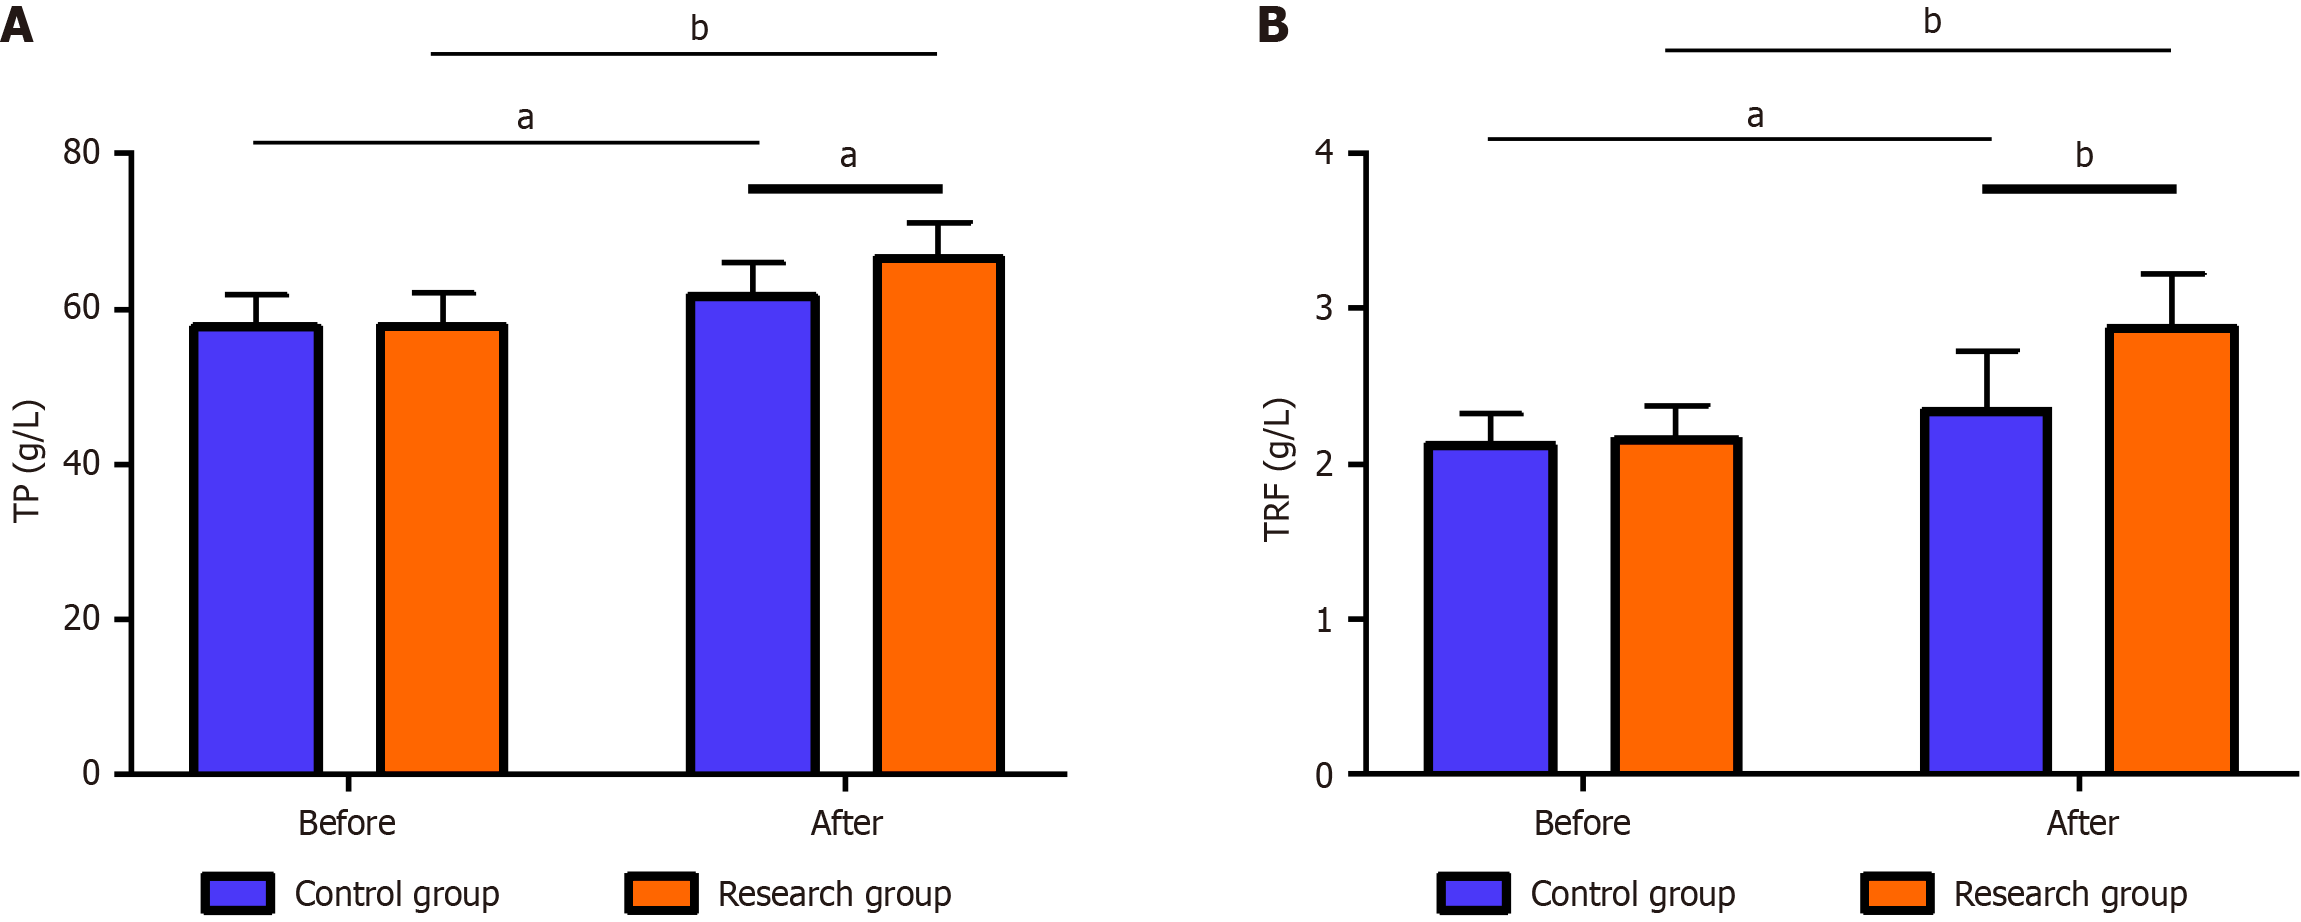
Figure 3 Nutritional indicators.
A: Inter-group comparison of total protein levels; B: Inter-group comparison of transferrin levels. aP < 0.05, bP < 0.01. TP: Total protein; TRF: Transferrin.
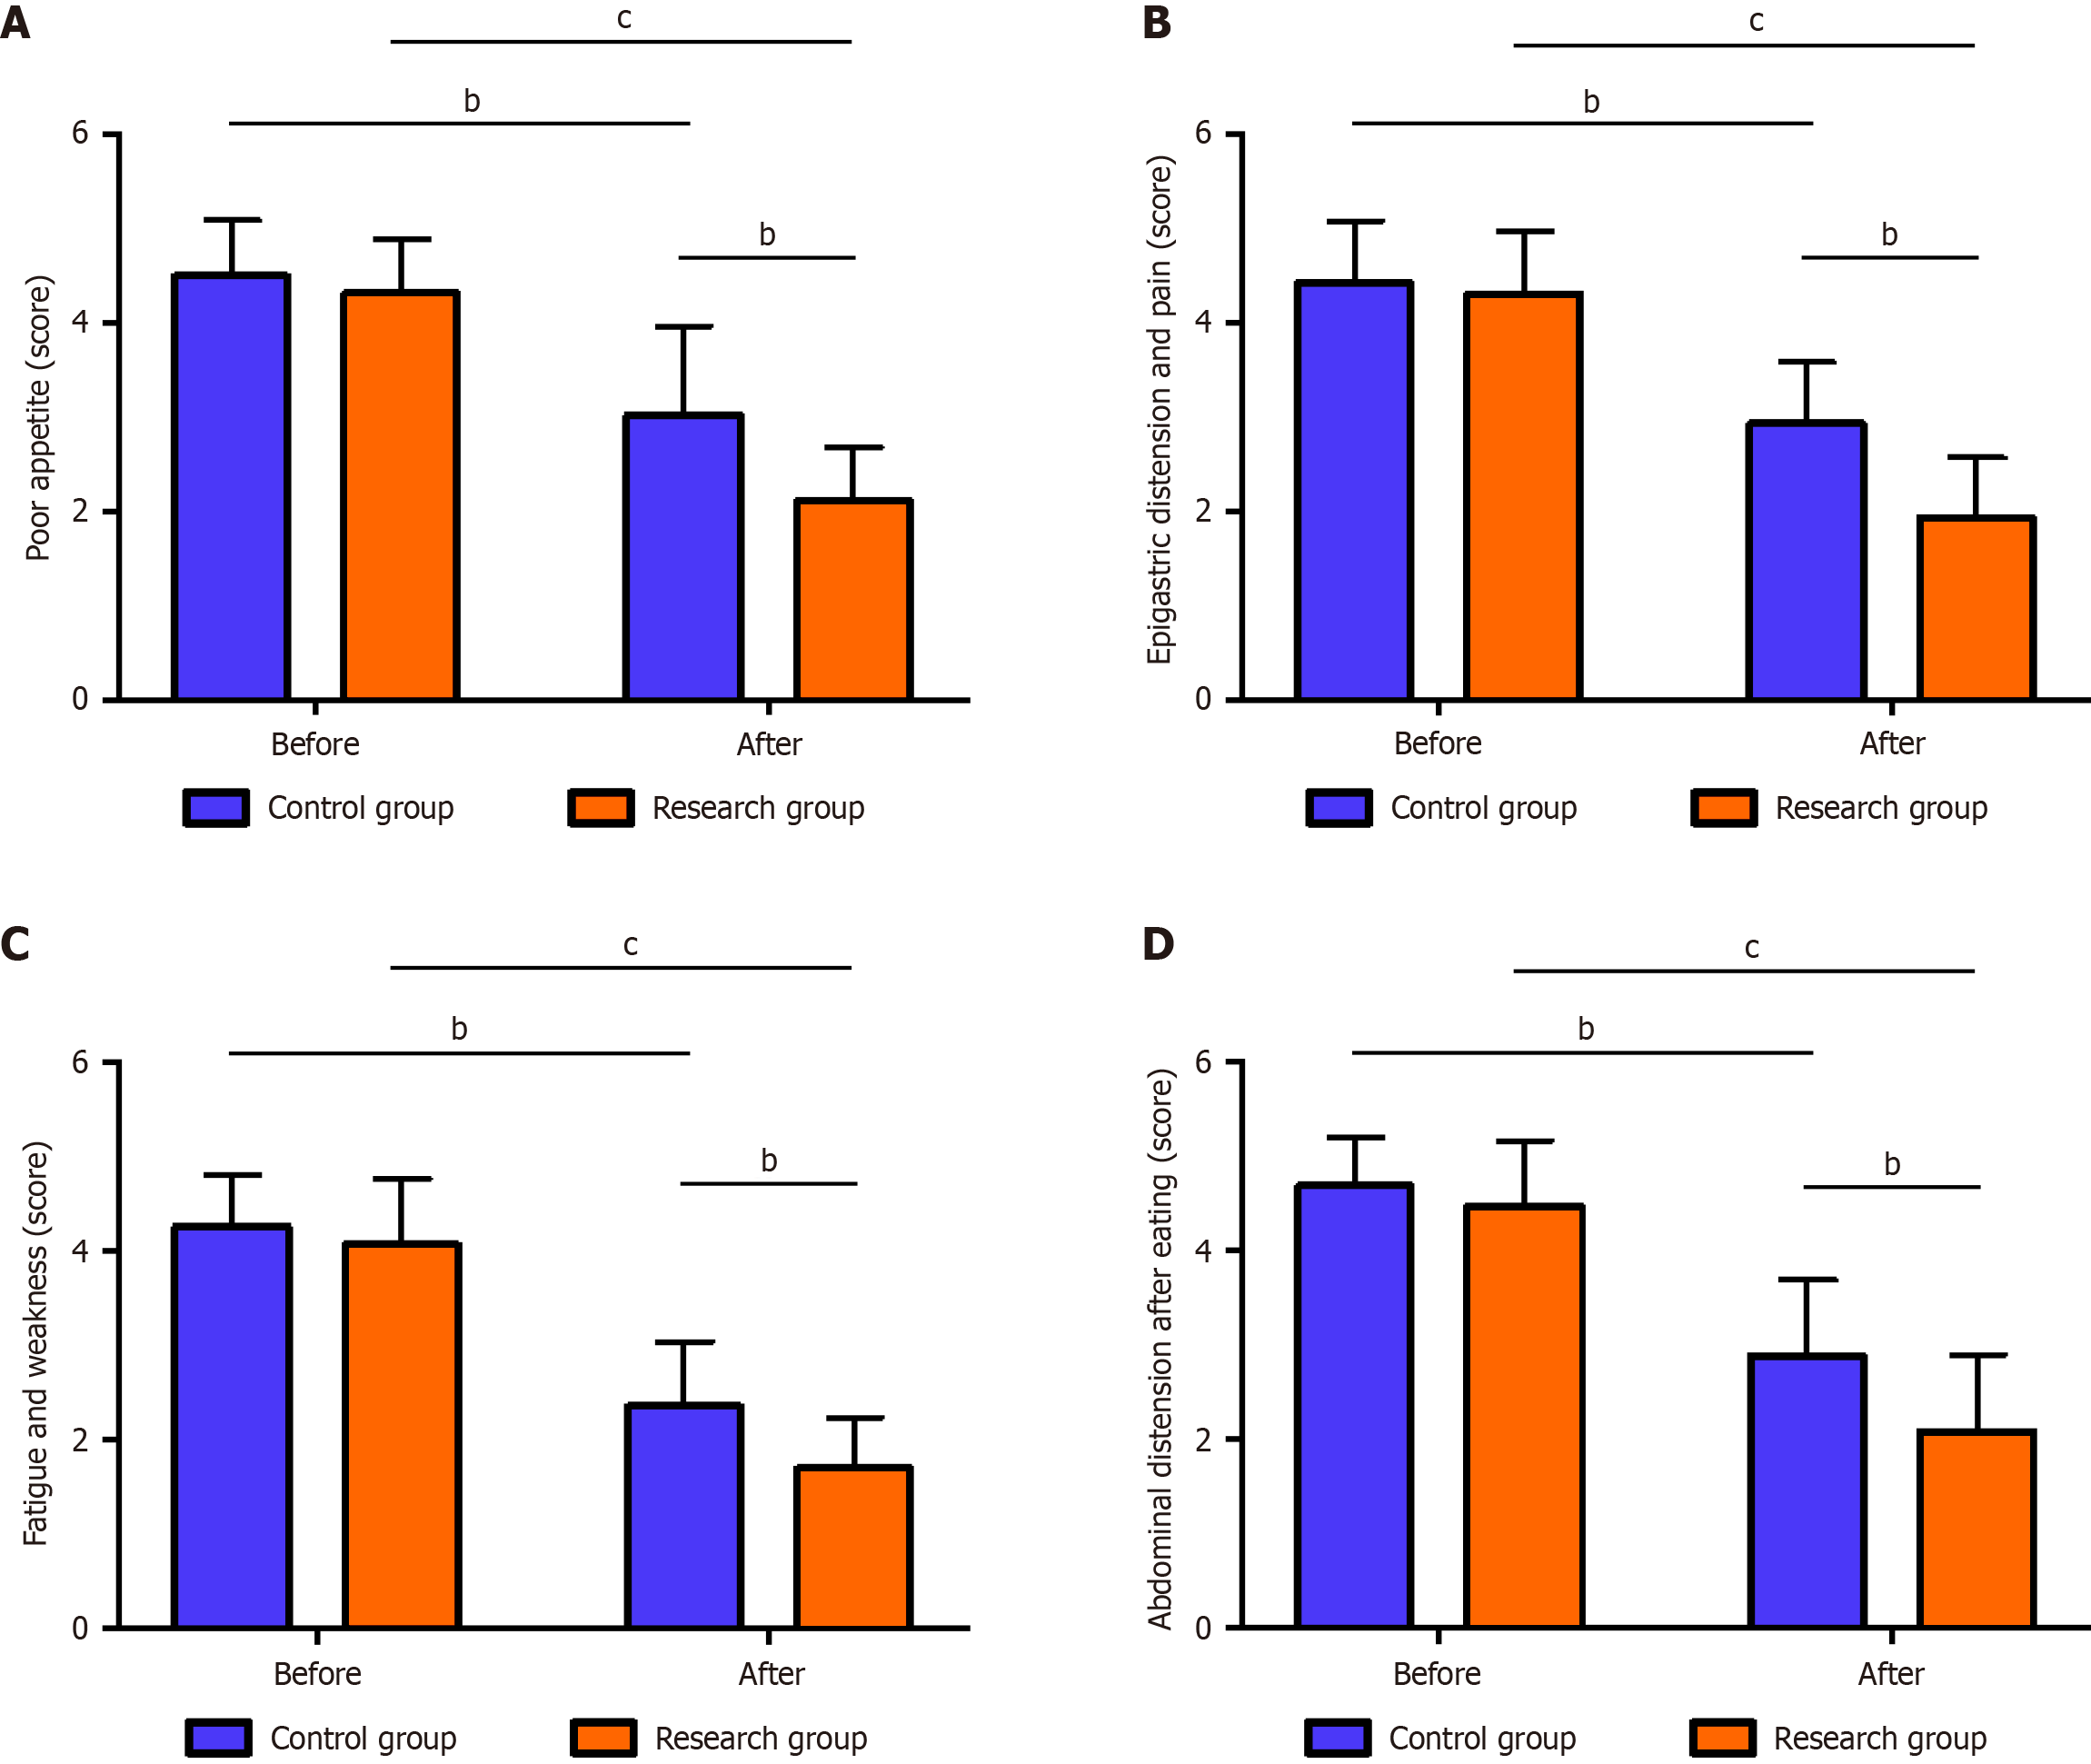
Figure 4 Traditional Chinese medicine syndrome scores.
A: Poor appetite scores before and after treatment in the two groups; B: Epigastric distension and pain scores before and after treatment in the two groups; C: Fatigue and weakness scores of the two groups before and after treatment; D: Abdominal distension after eating scores before and after treatment in the two groups. bP < 0.01, cP < 0.001.
- Citation: Wang XD, Su XQ, Gao H. Association of Sijunzi decoction plus chemotherapy with gastrointestinal function and serum markers in patients after gastric carcinoma surgery. World J Gastrointest Surg 2025; 17(4): 100800
- URL: https://www.wjgnet.com/1948-9366/full/v17/i4/100800.htm
- DOI: https://dx.doi.org/10.4240/wjgs.v17.i4.100800


