Copyright
©The Author(s) 2025.
World J Gastrointest Surg. Jan 27, 2025; 17(1): 96512
Published online Jan 27, 2025. doi: 10.4240/wjgs.v17.i1.96512
Published online Jan 27, 2025. doi: 10.4240/wjgs.v17.i1.96512
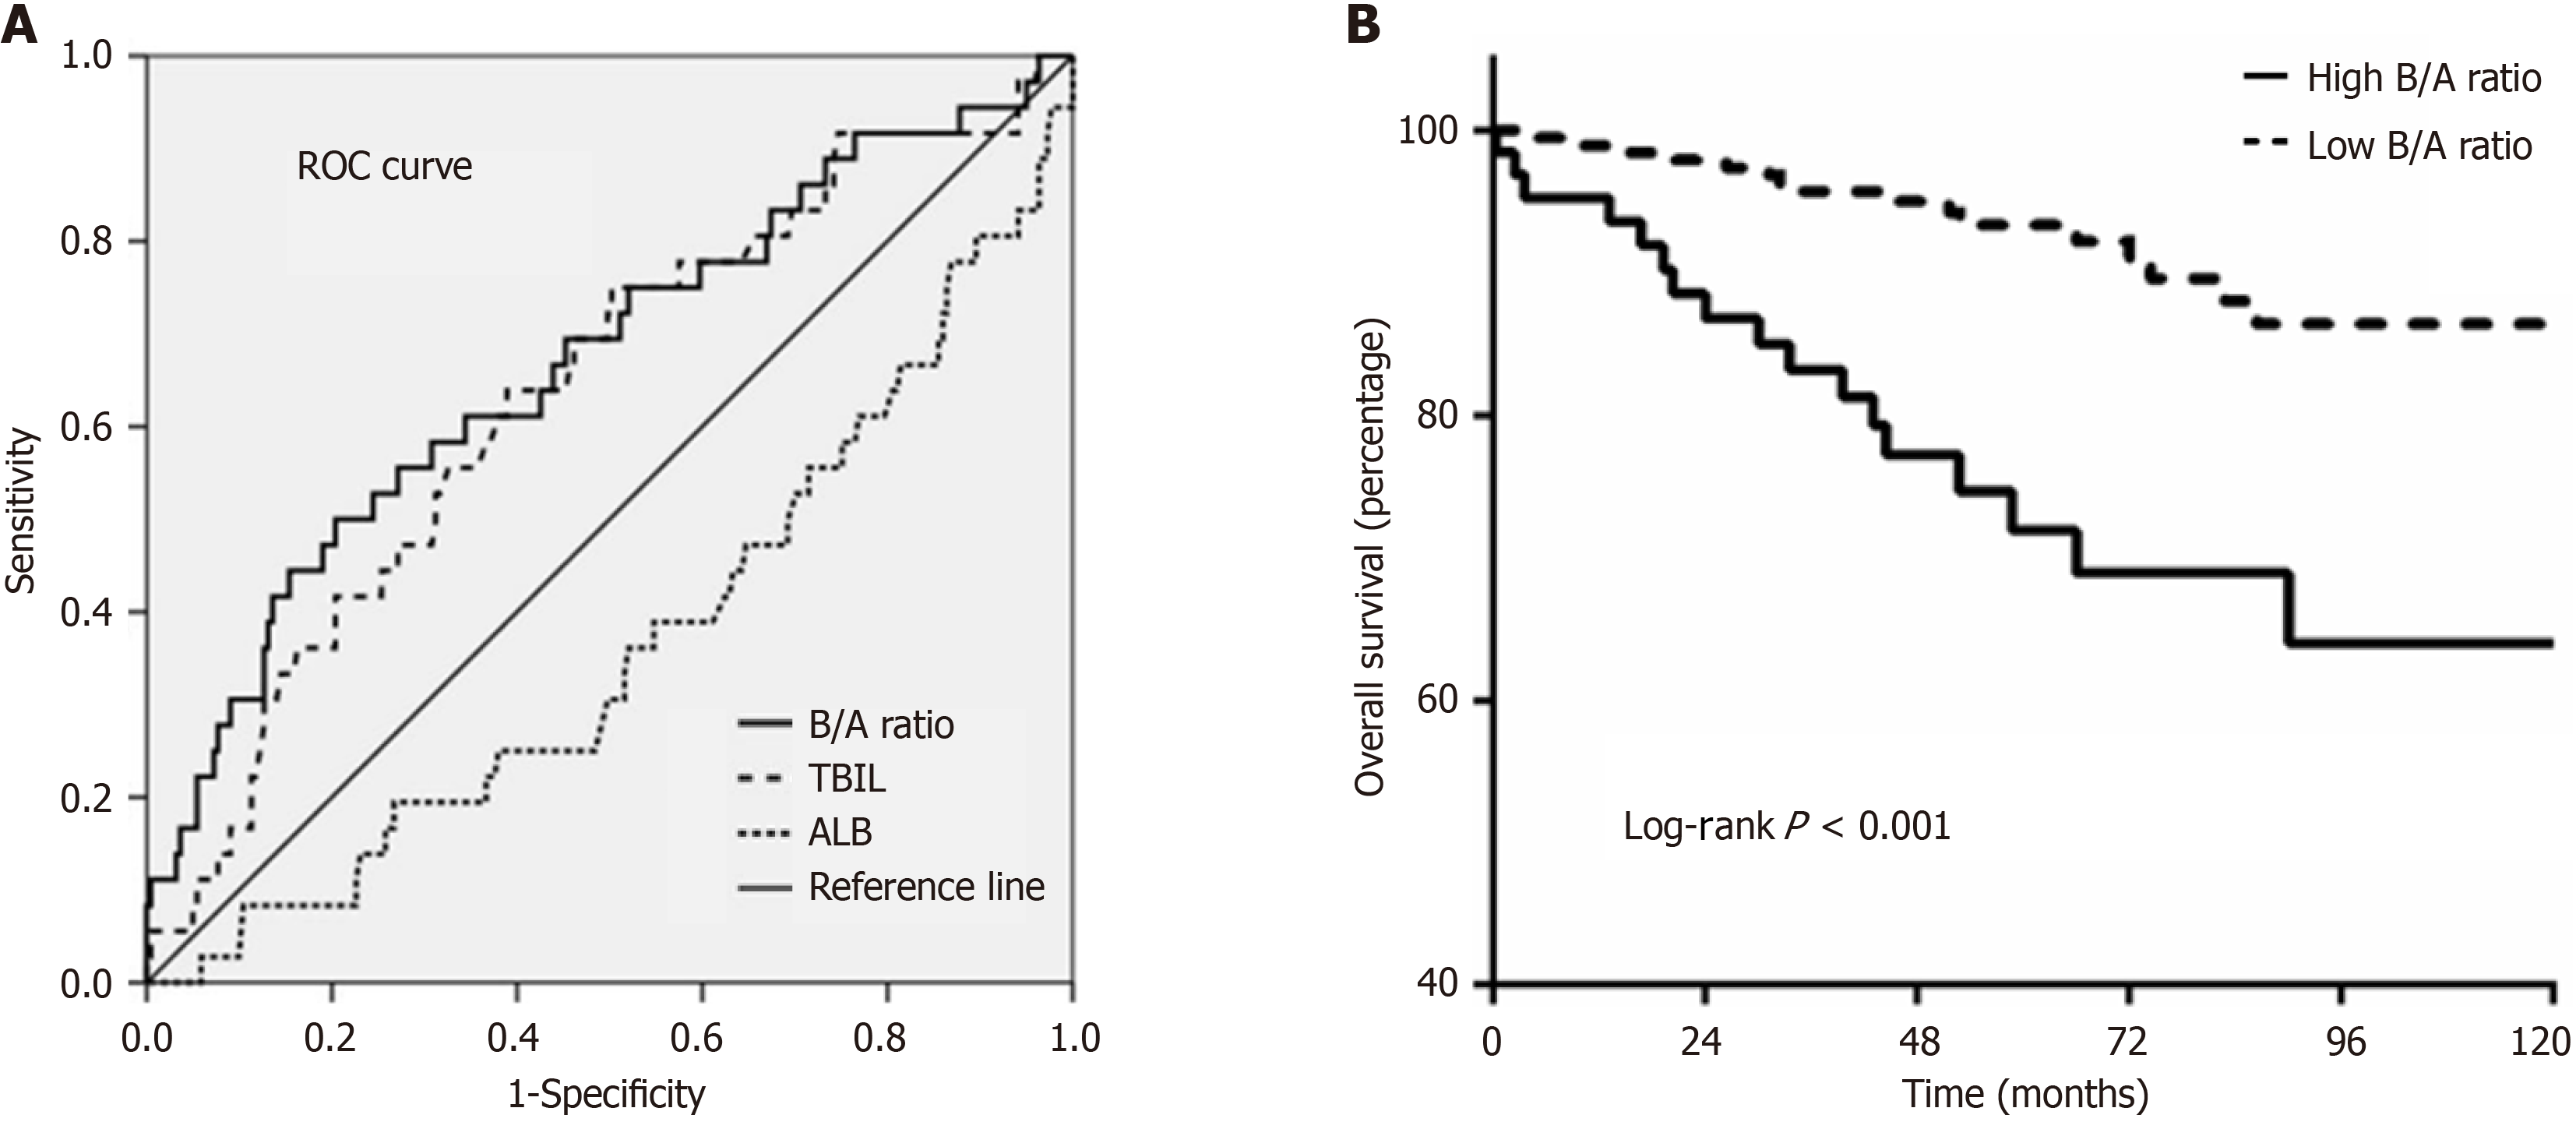
Figure 1 Receiver operating characteristic curve analysis and overall survival.
A: Receiver operating characteristic curve analysis was conducted to determine the optimal cutoff values for total bilirubin-albumin ratio (B/A), total bilirubin (TBIL), and albumin (ALB). The calculated optimal cutoff values for B/A ratio, TBIL, and ALB were 0.8714, 23.9, and 52.4 respectively; B: The Kaplan-Meier curves were compared between high B/A ratio and low B/A ratio groups for overall survival. The P values were calculated by the log-rank test. ROC: Receiver operating characteristic; B/A: Bilirubin-albumin ratio; TBIL: Total bilirubin; ALB: Albumin.
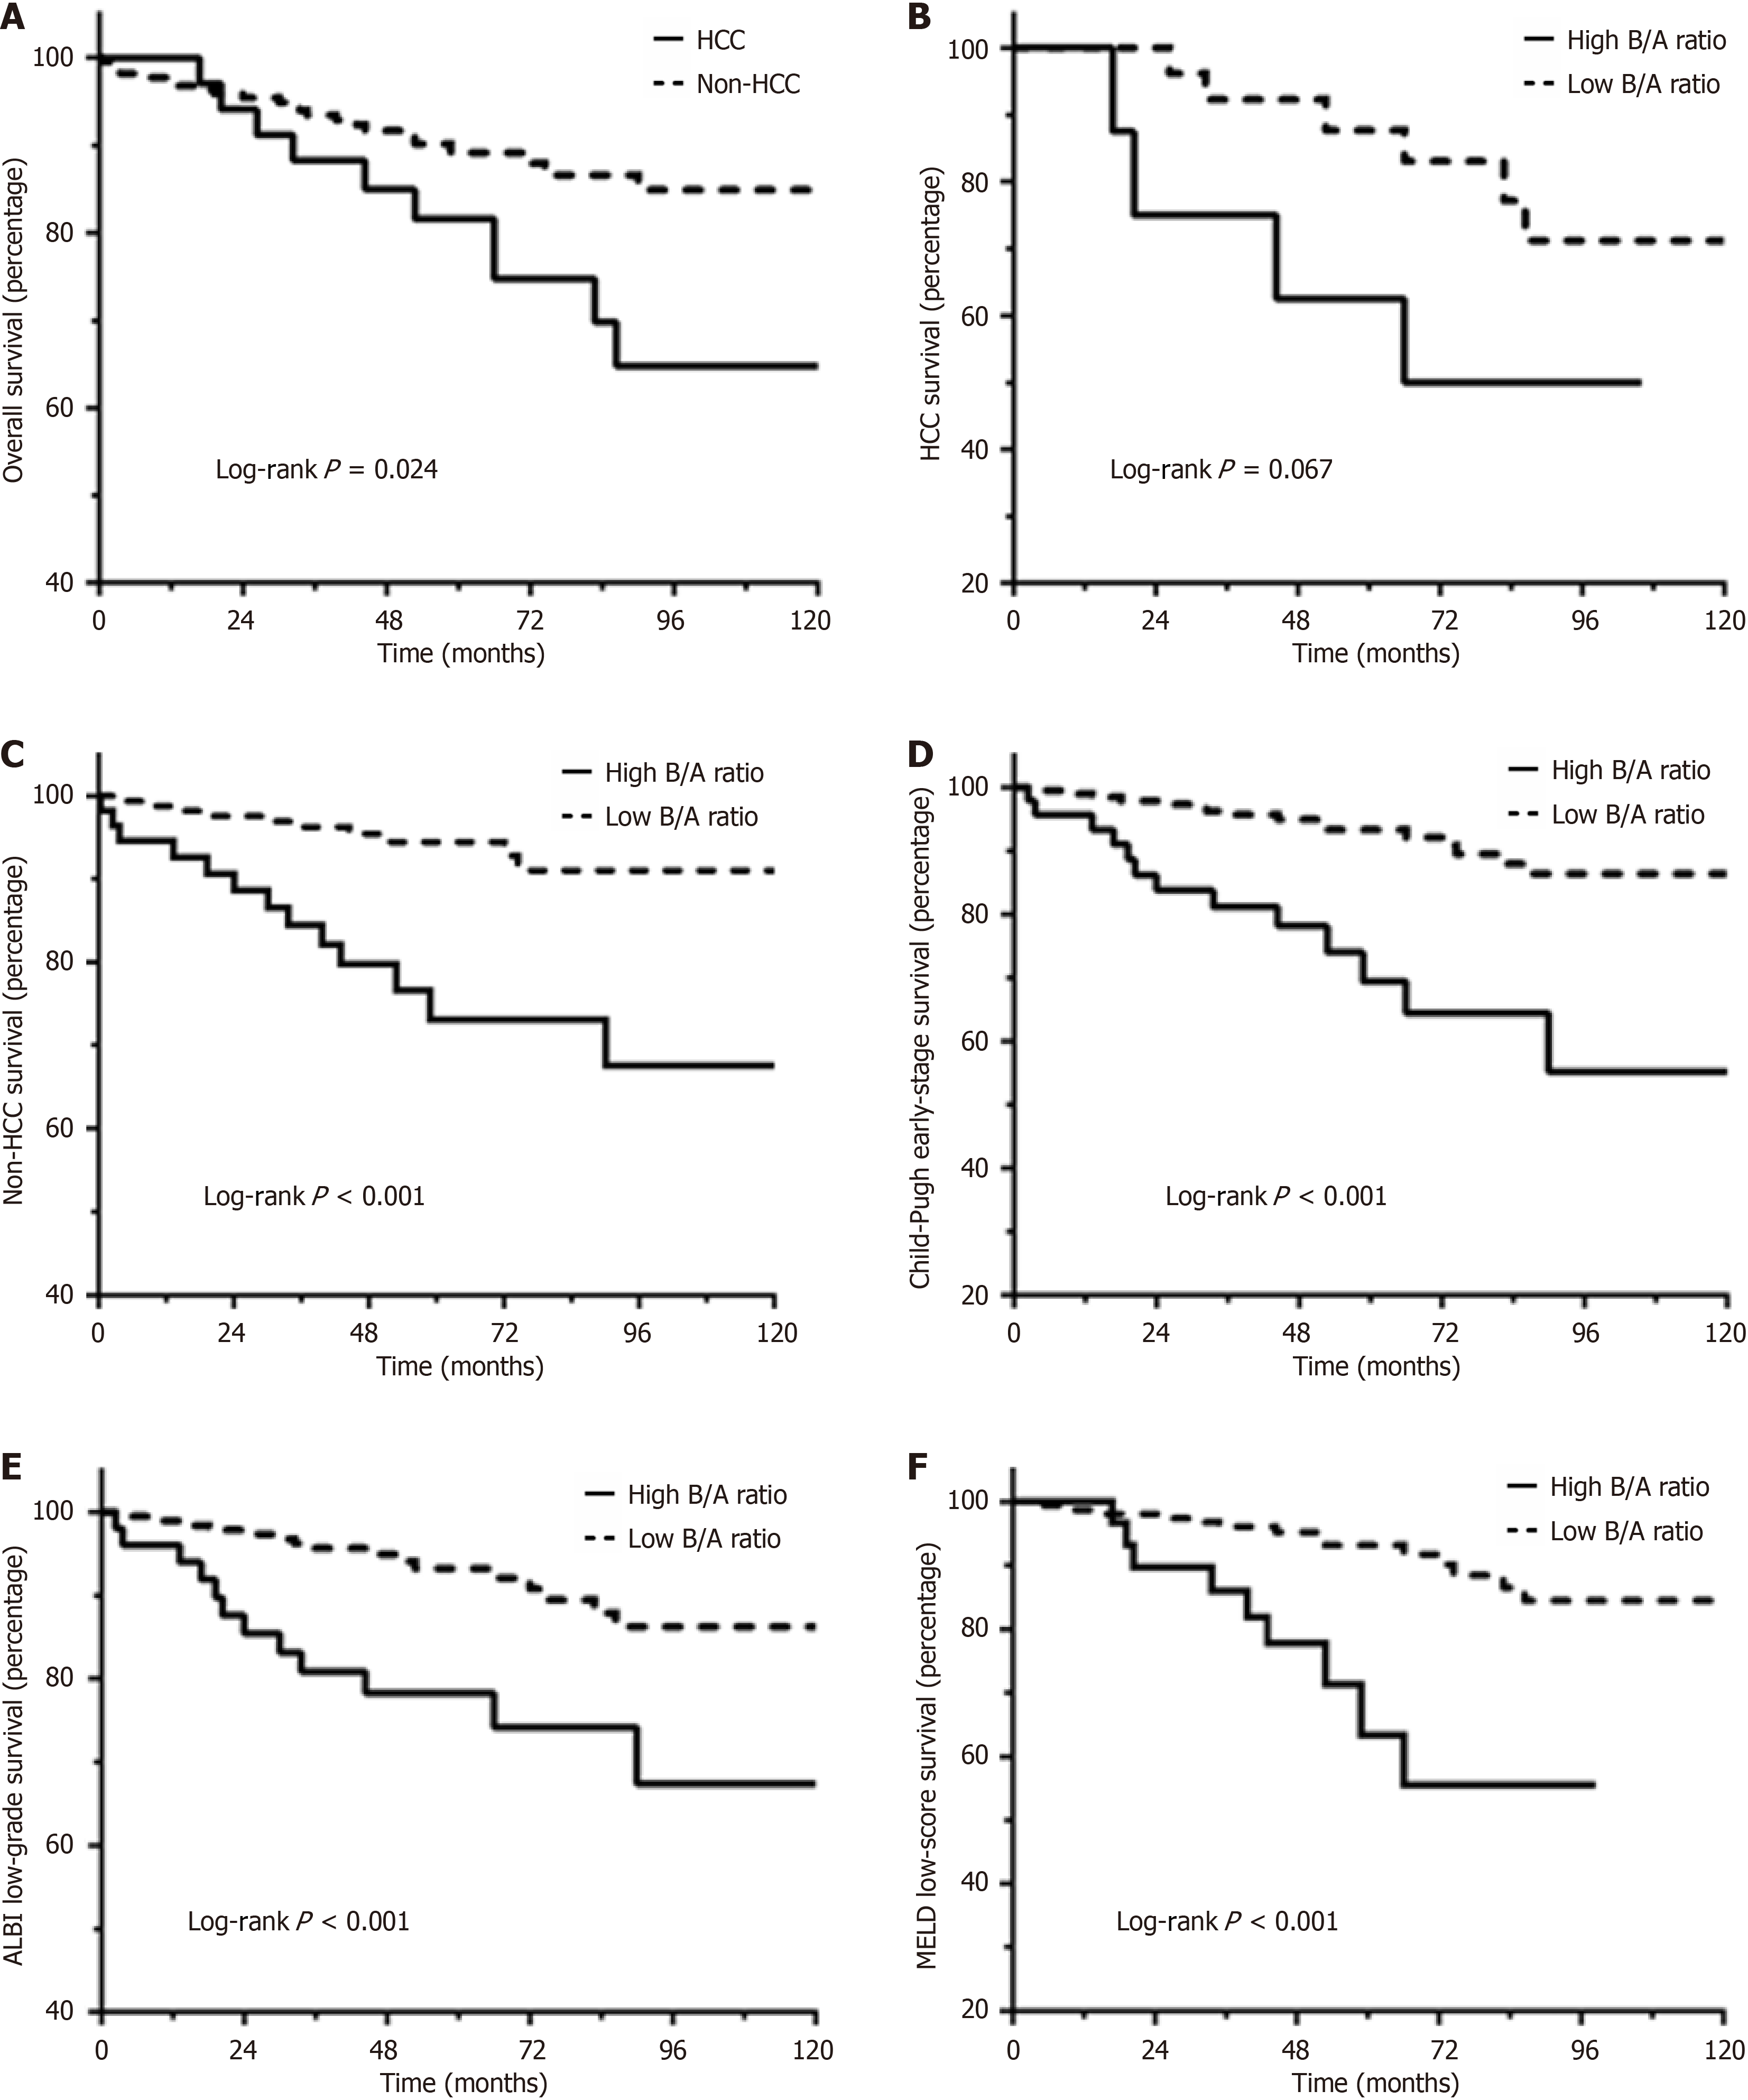
Figure 2 Survival analysis in different groups.
A: Kaplan-Meier curves were generated to compare overall survival (OS) between patients with and without hepatocellular carcinoma (HCC); B and C: Kaplan-Meier curves of patients in HCC groups and non-HCC groups stratified by high total bilirubin-albumin ratio (B/A) vs low B/A ratio; D-F: Kaplan-Meier curves for OS in patients with early Child-Pugh stage, low albumin-bilirubin grade, and model for end-stage liver disease score ≥ 10 were compared between high B/A ratio and low B/A ratio groups. The P values were calculated using the log-rank test. B/A: Bilirubin-albumin ratio; HCC: Hepatocellular carcinoma.
- Citation: Chen YF, Lin YX, Chi MM, Li DQ, Chen LT, Zhang Y, Wu RQ, Du ZQ. Preoperative serum total bilirubin-albumin ratio as a prognostic indicator in patients with hepatitis-related cirrhosis after splenectomy. World J Gastrointest Surg 2025; 17(1): 96512
- URL: https://www.wjgnet.com/1948-9366/full/v17/i1/96512.htm
- DOI: https://dx.doi.org/10.4240/wjgs.v17.i1.96512


