Copyright
©The Author(s) 2024.
World J Gastrointest Surg. Aug 27, 2024; 16(8): 2640-2648
Published online Aug 27, 2024. doi: 10.4240/wjgs.v16.i8.2640
Published online Aug 27, 2024. doi: 10.4240/wjgs.v16.i8.2640
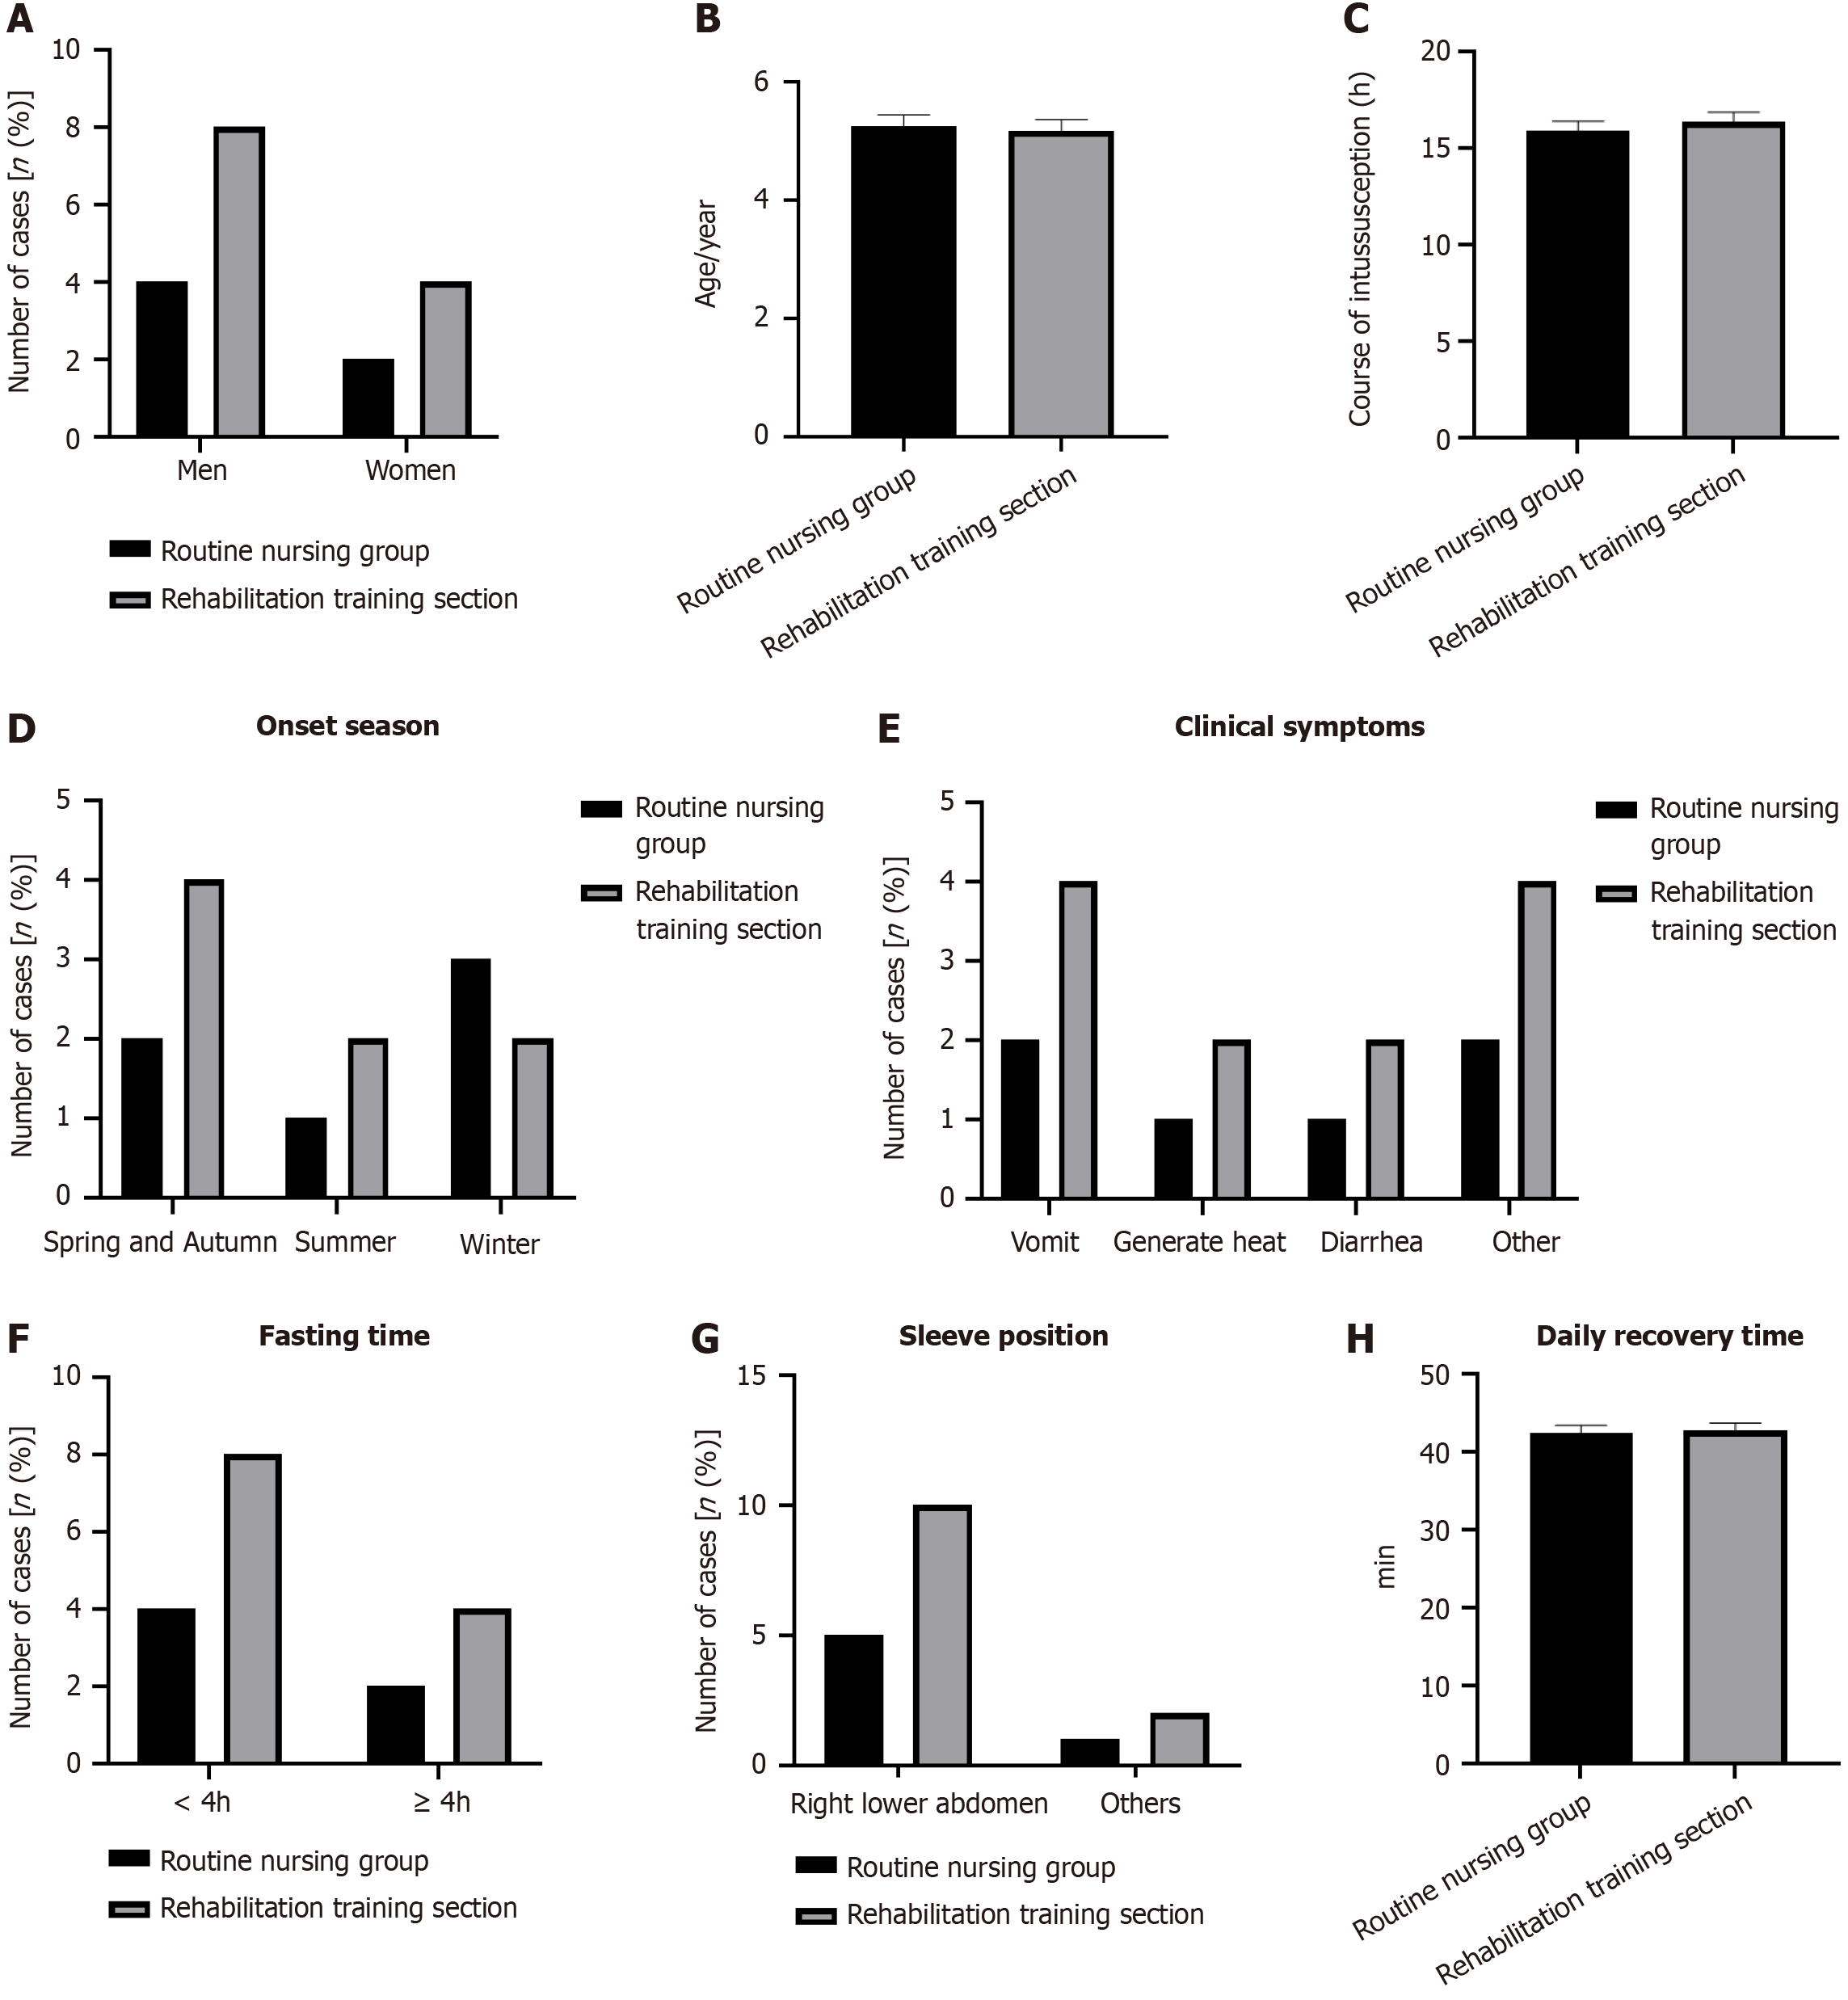
Figure 1 Children’s general data.
A: Sex; B: Age; C: Course of intussusception; D: Onset season; E: Clinical symptoms; F: Fasting time; G: Sleeve position; H: Daily recovery time.
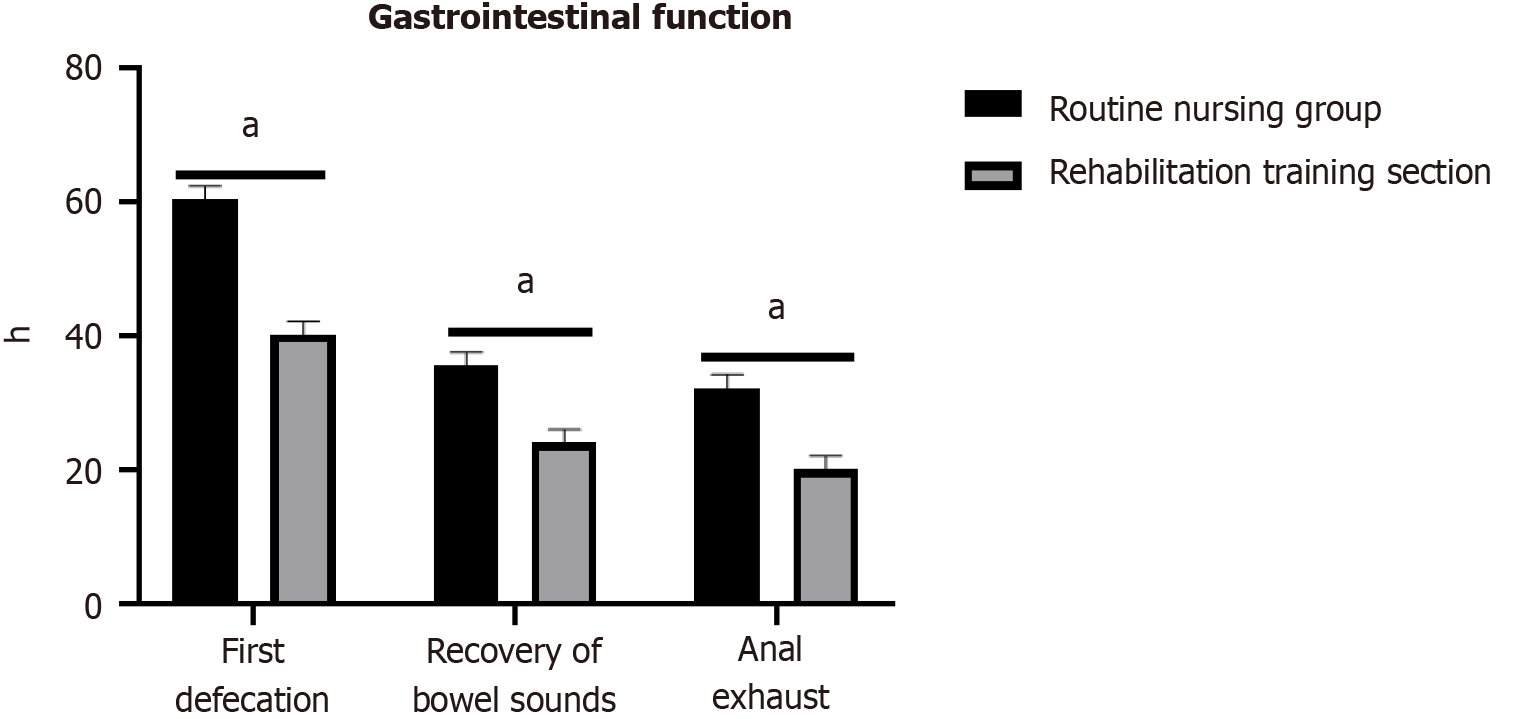
Figure 2 Recovery time of gastrointestinal function compared to the routine nursing group.
aP < 0.05.
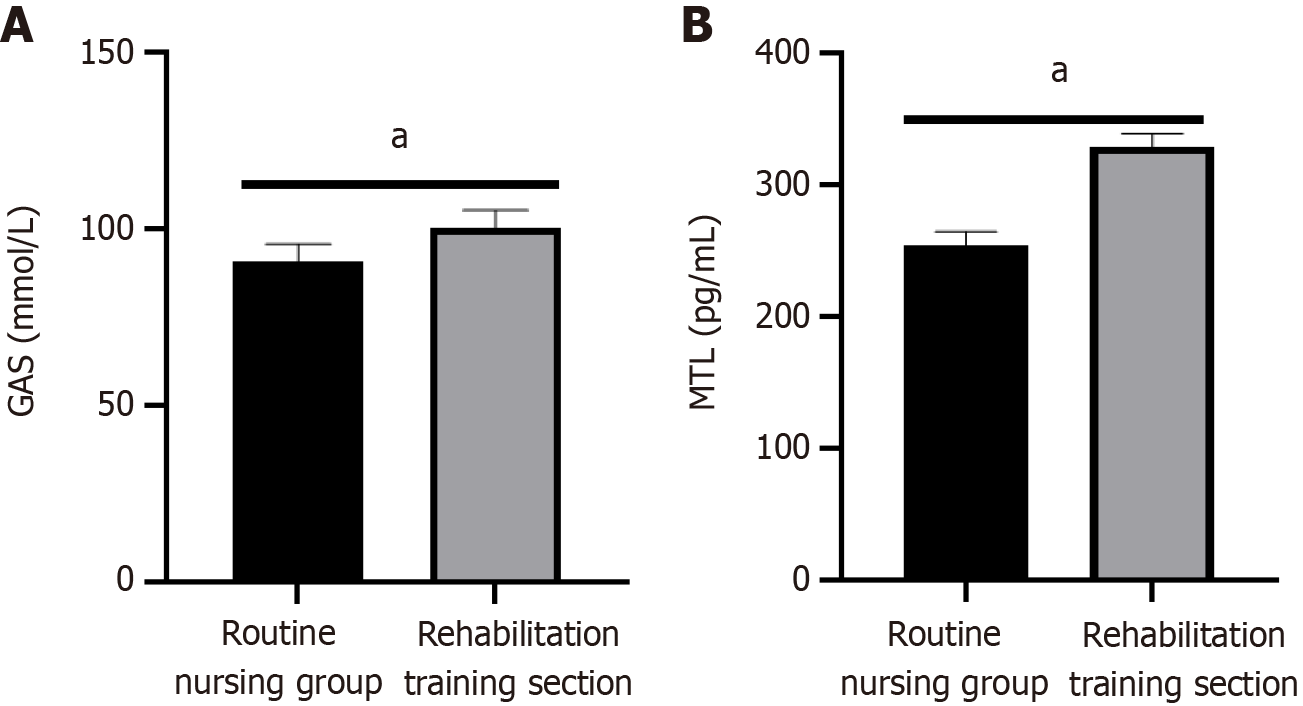
Figure 3 Gastrointestinal function.
A: Gastrin level; B: Motilin level. aP < 0.05 compared to the routine nursing group. GAS: Gastrin; MTL: Motilin.
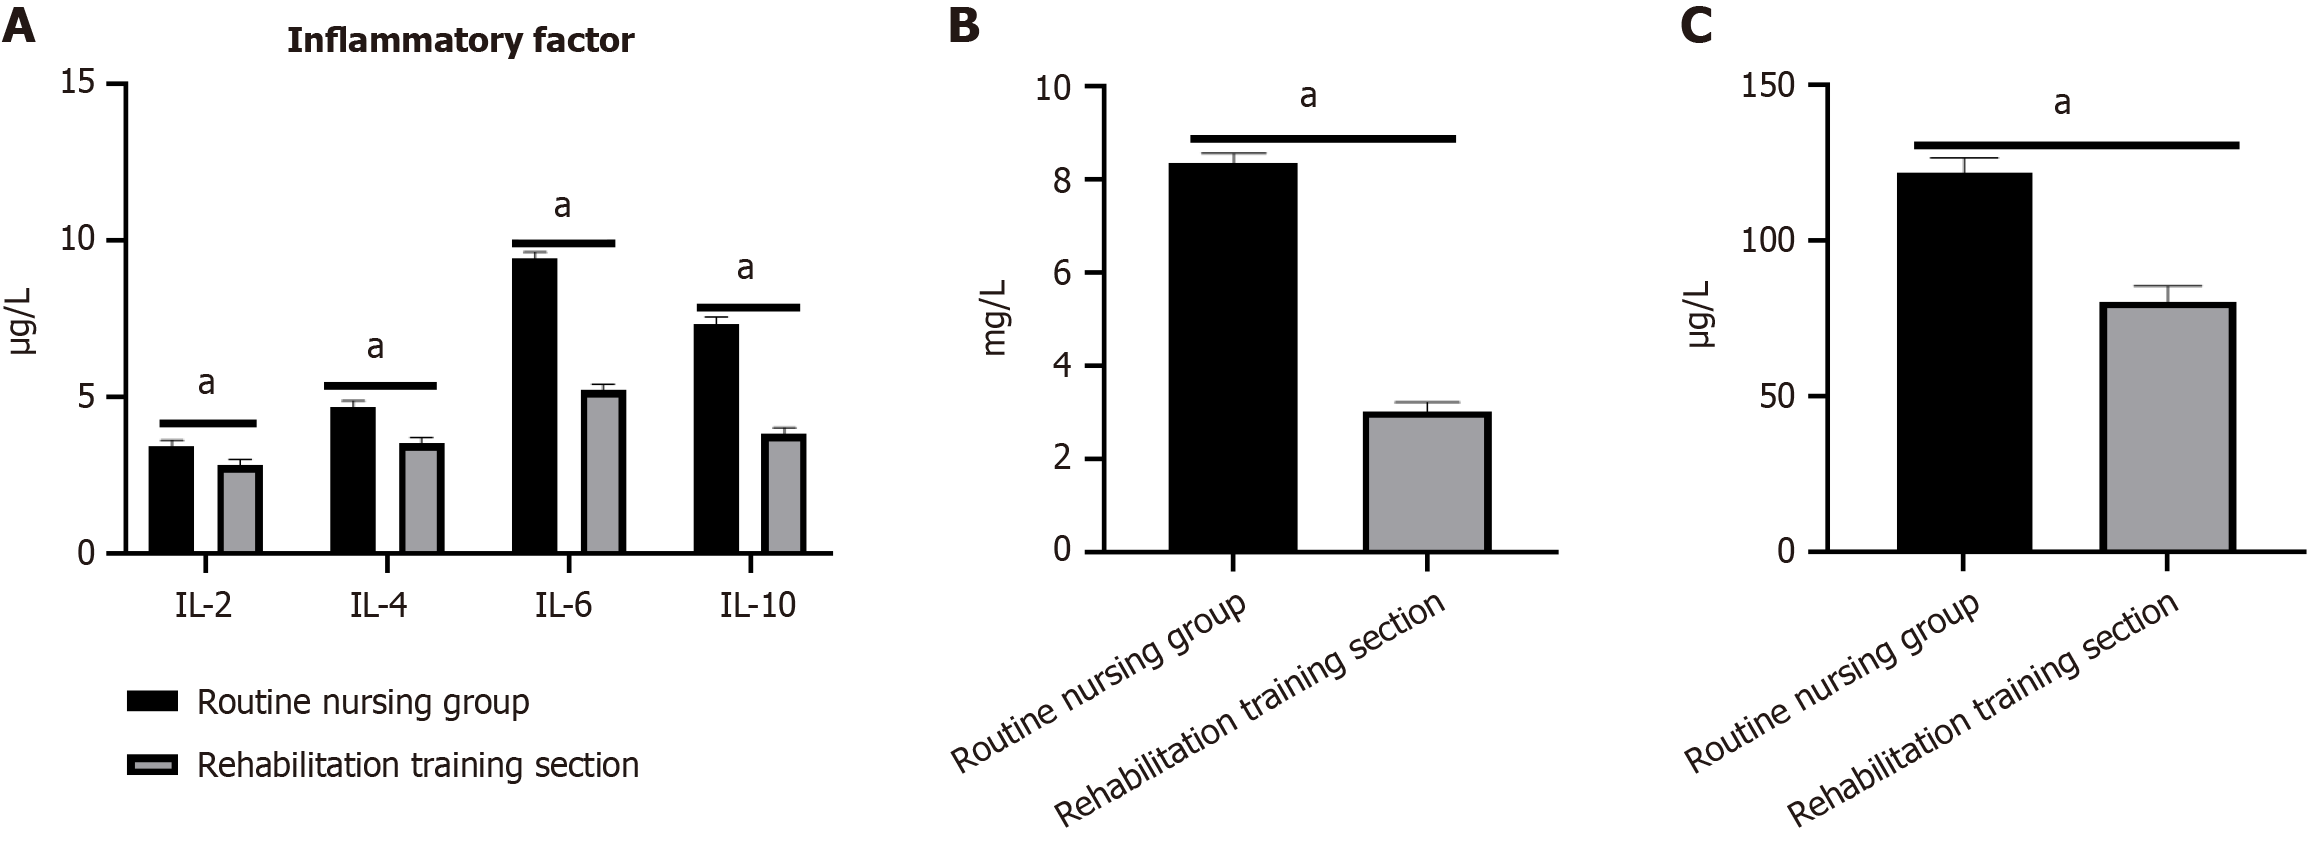
Figure 4 Inflammatory factor levels.
A: Interleukin (IL)-2, IL-4, IL-6, and IL-10; B: High-sensitivity C-reactive protein; C: Tumor necrosis factor-α. aP < 0.05 compared to the routine nursing group. IL: Interleukin.
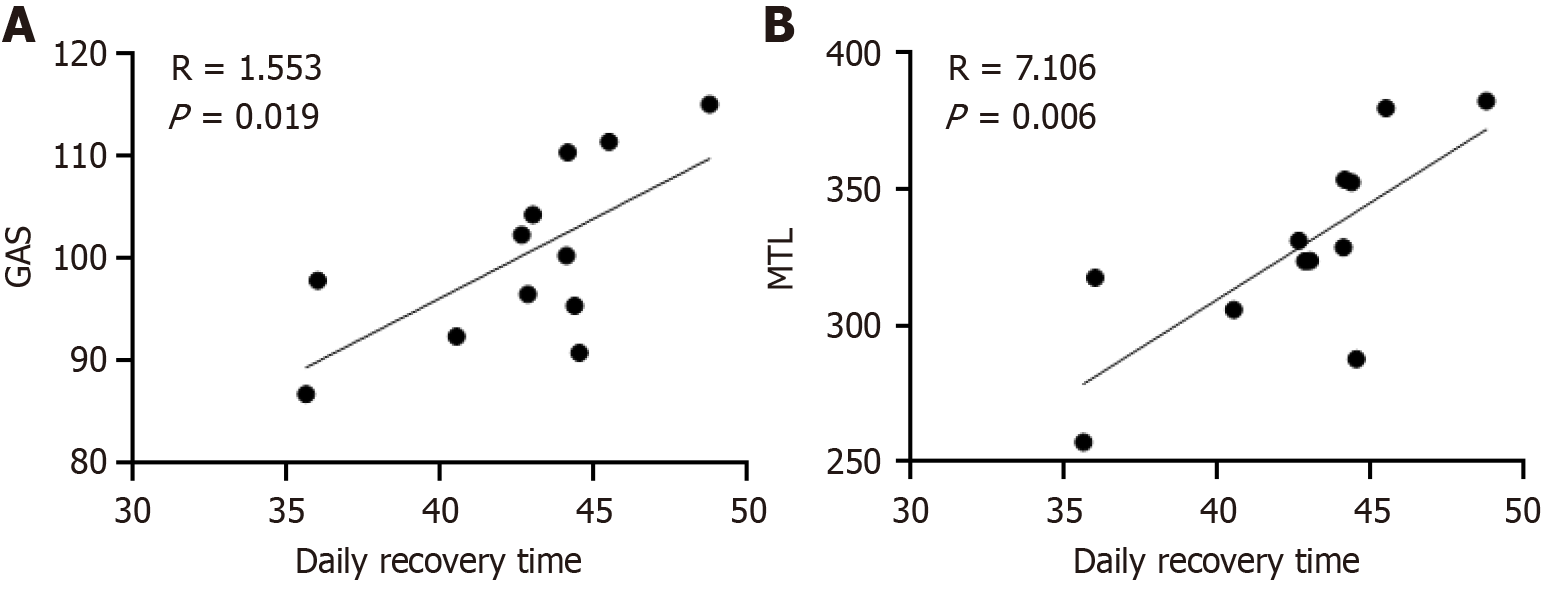
Figure 5 Correlation between gastrointestinal function and postoperative rehabilitation time.
A: Gastrin; B: Motilin. GAS: Gastrin; MTL: Motilin.
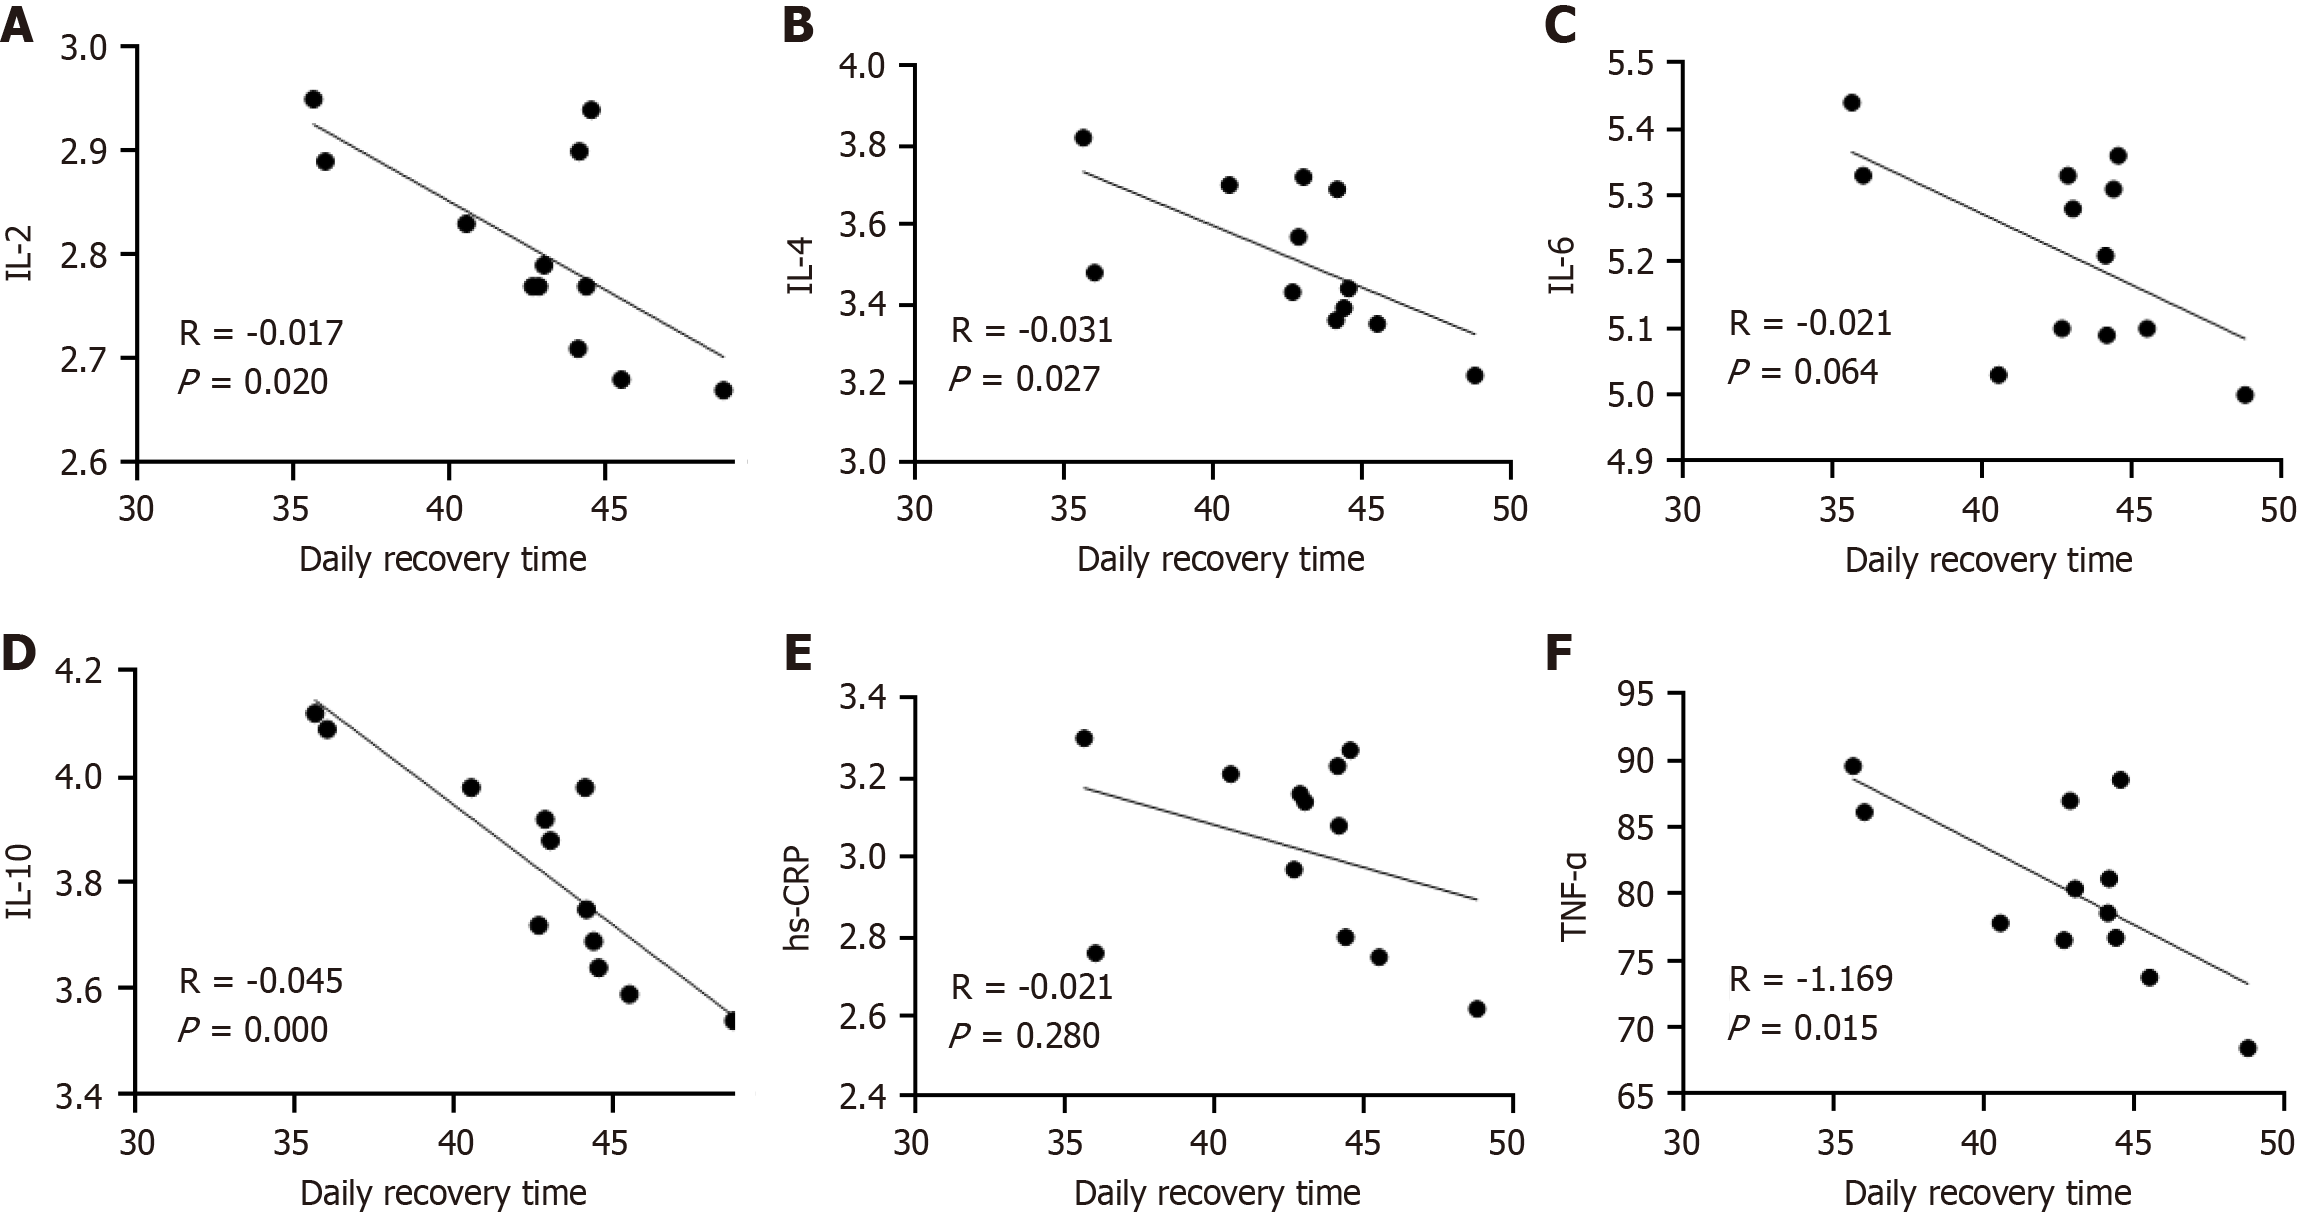
Figure 6 Correlation between inflammatory factors and postoperative rehabilitation time.
A: Interleukin (IL)-2; B: IL-4; C: IL-6; D: IL-10; E: High-sensitivity C-reactive protein; F: Tumor necrosis factor-α. IL: Interleukin; hs-CRP: High-sensitivity C-reactive protein; TNF-α: Tumor necrosis factor-α.
- Citation: Wei XY, Huo HC, Li X, Sun SL, Zhang J. Relationship between postoperative rehabilitation style, gastrointestinal function, and inflammatory factor levels in children with intussusception. World J Gastrointest Surg 2024; 16(8): 2640-2648
- URL: https://www.wjgnet.com/1948-9366/full/v16/i8/2640.htm
- DOI: https://dx.doi.org/10.4240/wjgs.v16.i8.2640


