Copyright
©The Author(s) 2024.
World J Gastrointest Surg. Jul 27, 2024; 16(7): 2281-2295
Published online Jul 27, 2024. doi: 10.4240/wjgs.v16.i7.2281
Published online Jul 27, 2024. doi: 10.4240/wjgs.v16.i7.2281
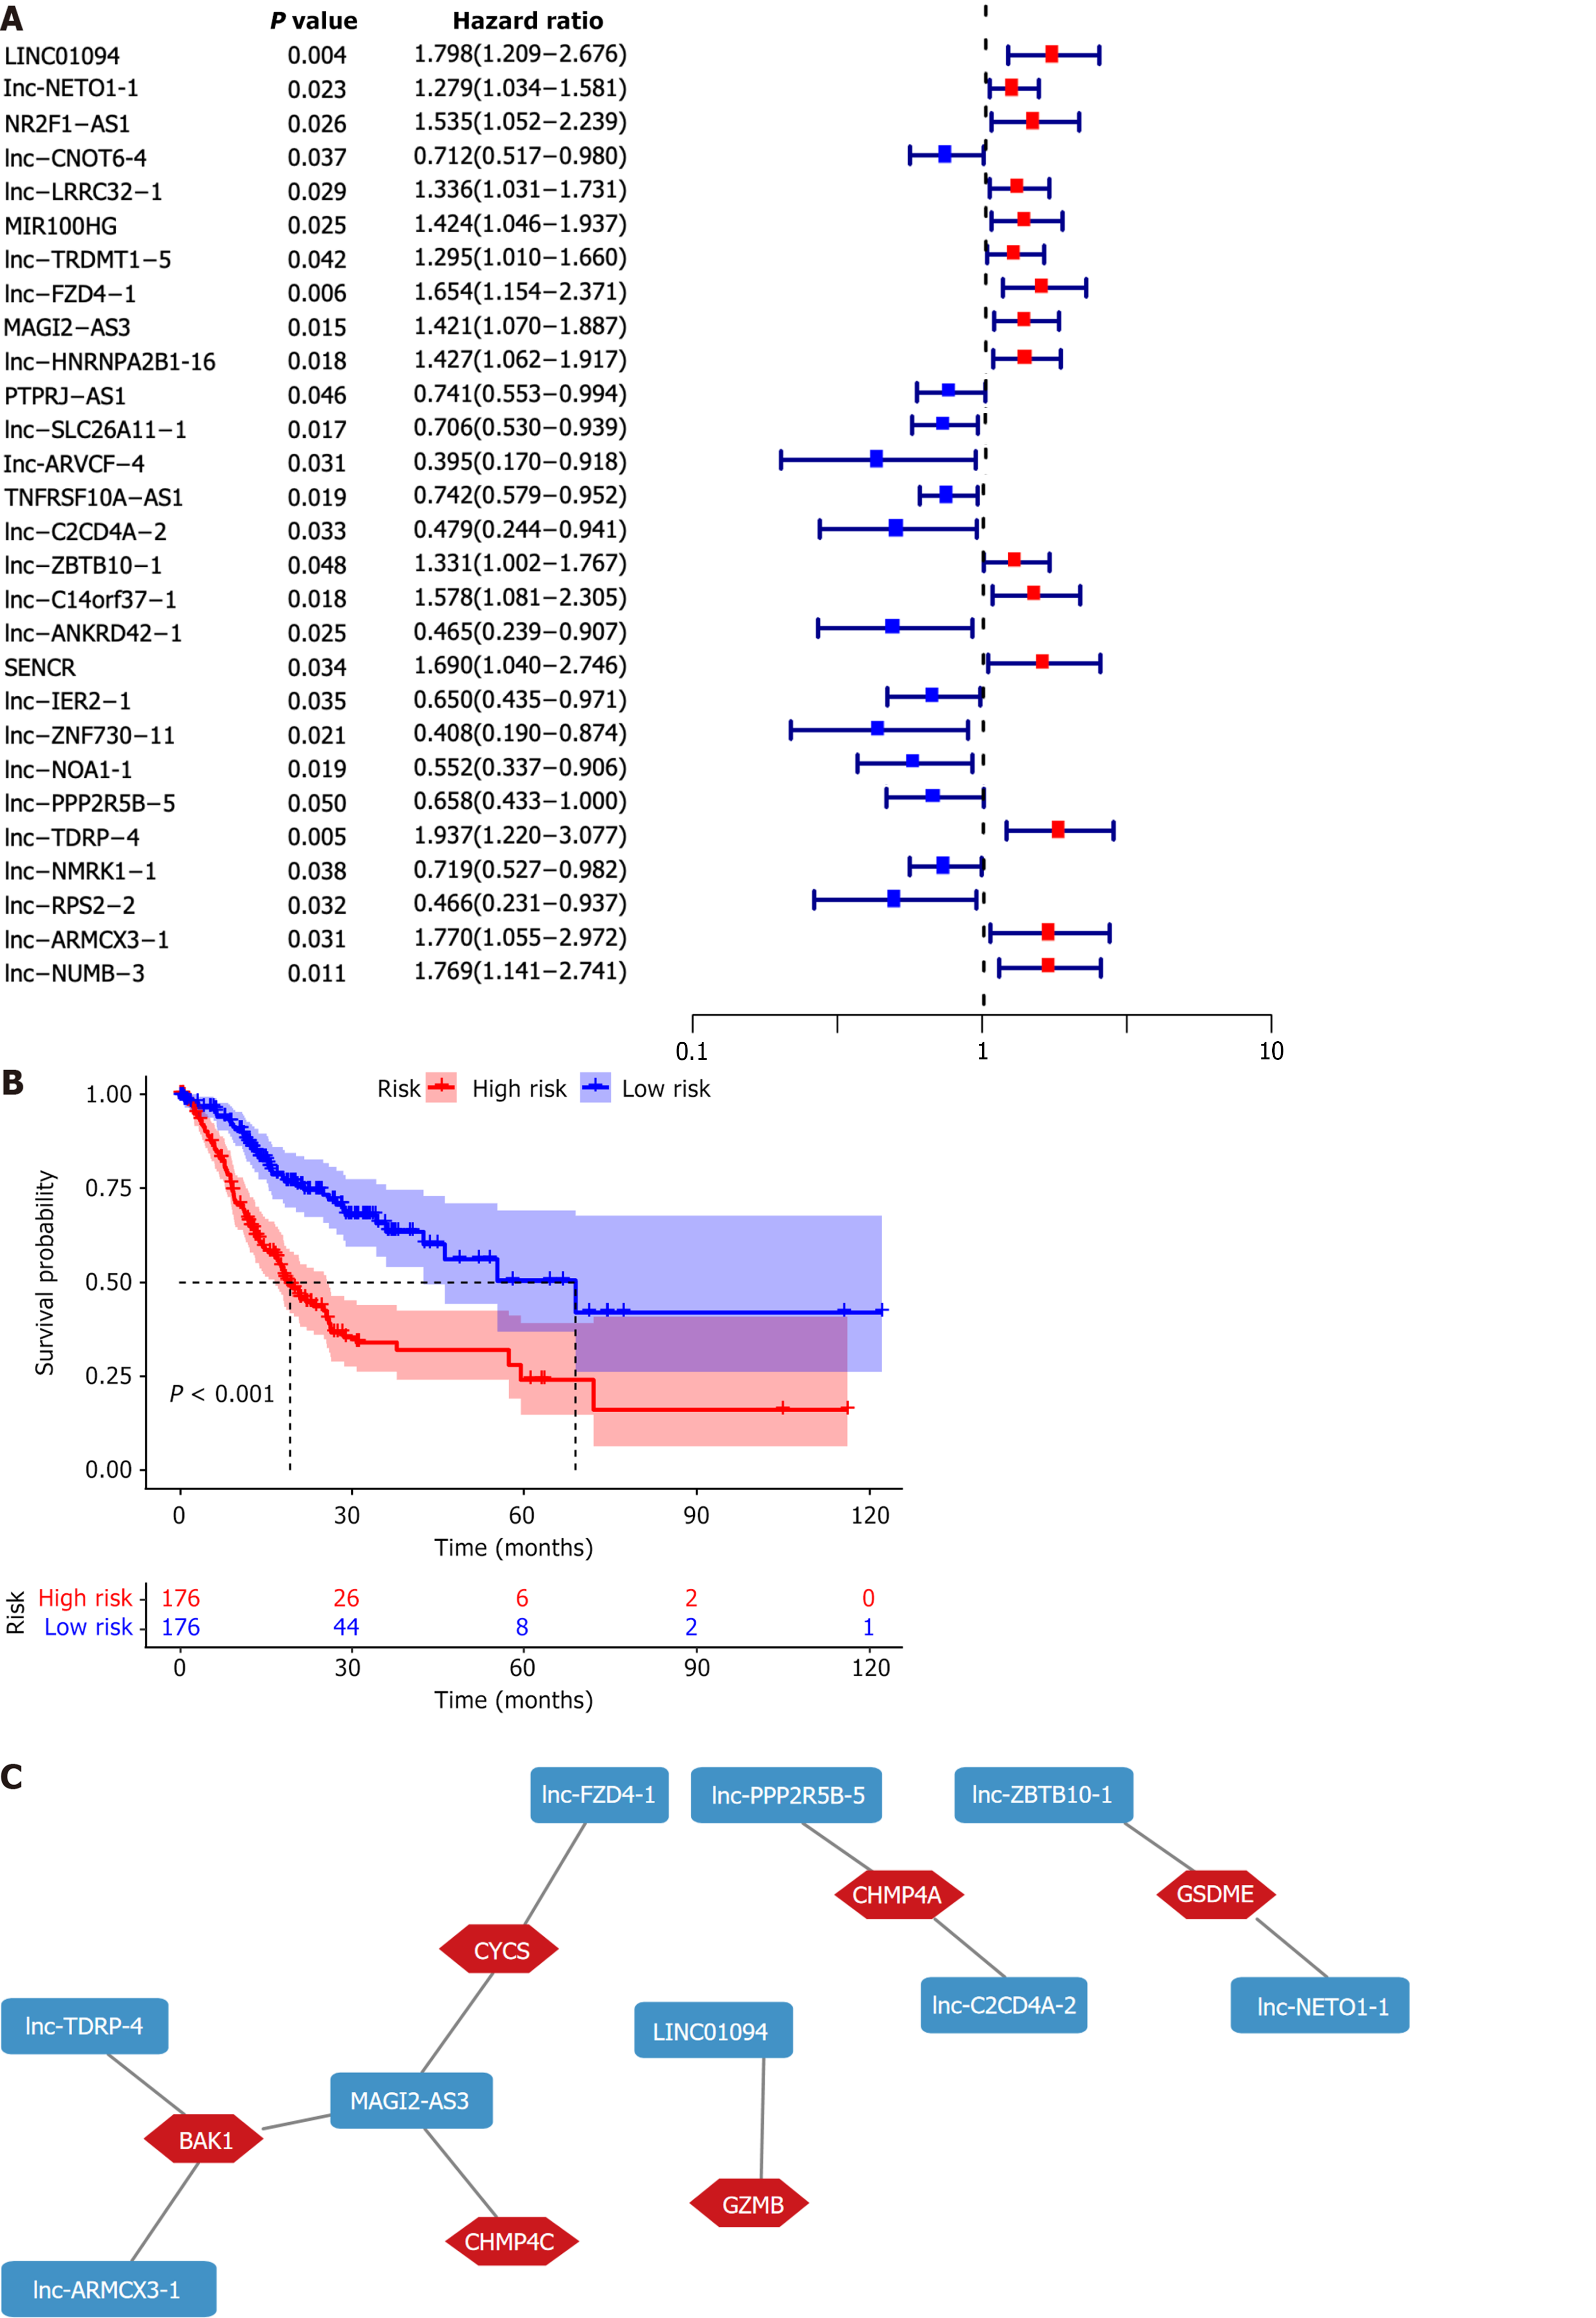
Figure 1 Establishing a risk signature.
A: Univariate cox regression analysis was used to identify 28 pyroptosis-related long non-coding RNAs (PRLs) associated with prognosis; B: Patients were divided into high-risk group (HRG) and low-risk group, and a Kaplan-Meier analysis showed that the HRG's prognosis was worse (P < 0.001); C: Cytoscape visualized the coexpression network between nine PRLs and pyroptosis genes.
Figure 2 Evaluate reliability and accuracy of risk signature.
A and B: The dispersion of patients' survival conditions and risk scores revealed that as the risk score rose, more people died; C: Nine pyroptosis-related long non-coding RNAs' expression heatmap between high-risk group and low-risk group; D: Age, sex, clinical stage, distant metastasis, lymph node metastasis, and tumor size had lower reliability than the risk signature; E: By doing a 1-, 2-, and 3-year receiver operating characteristic analysis, the prognostic utility of the risk signature was confirmed; F: Decision curve analysis was used to assess the dependability of the risk signature.
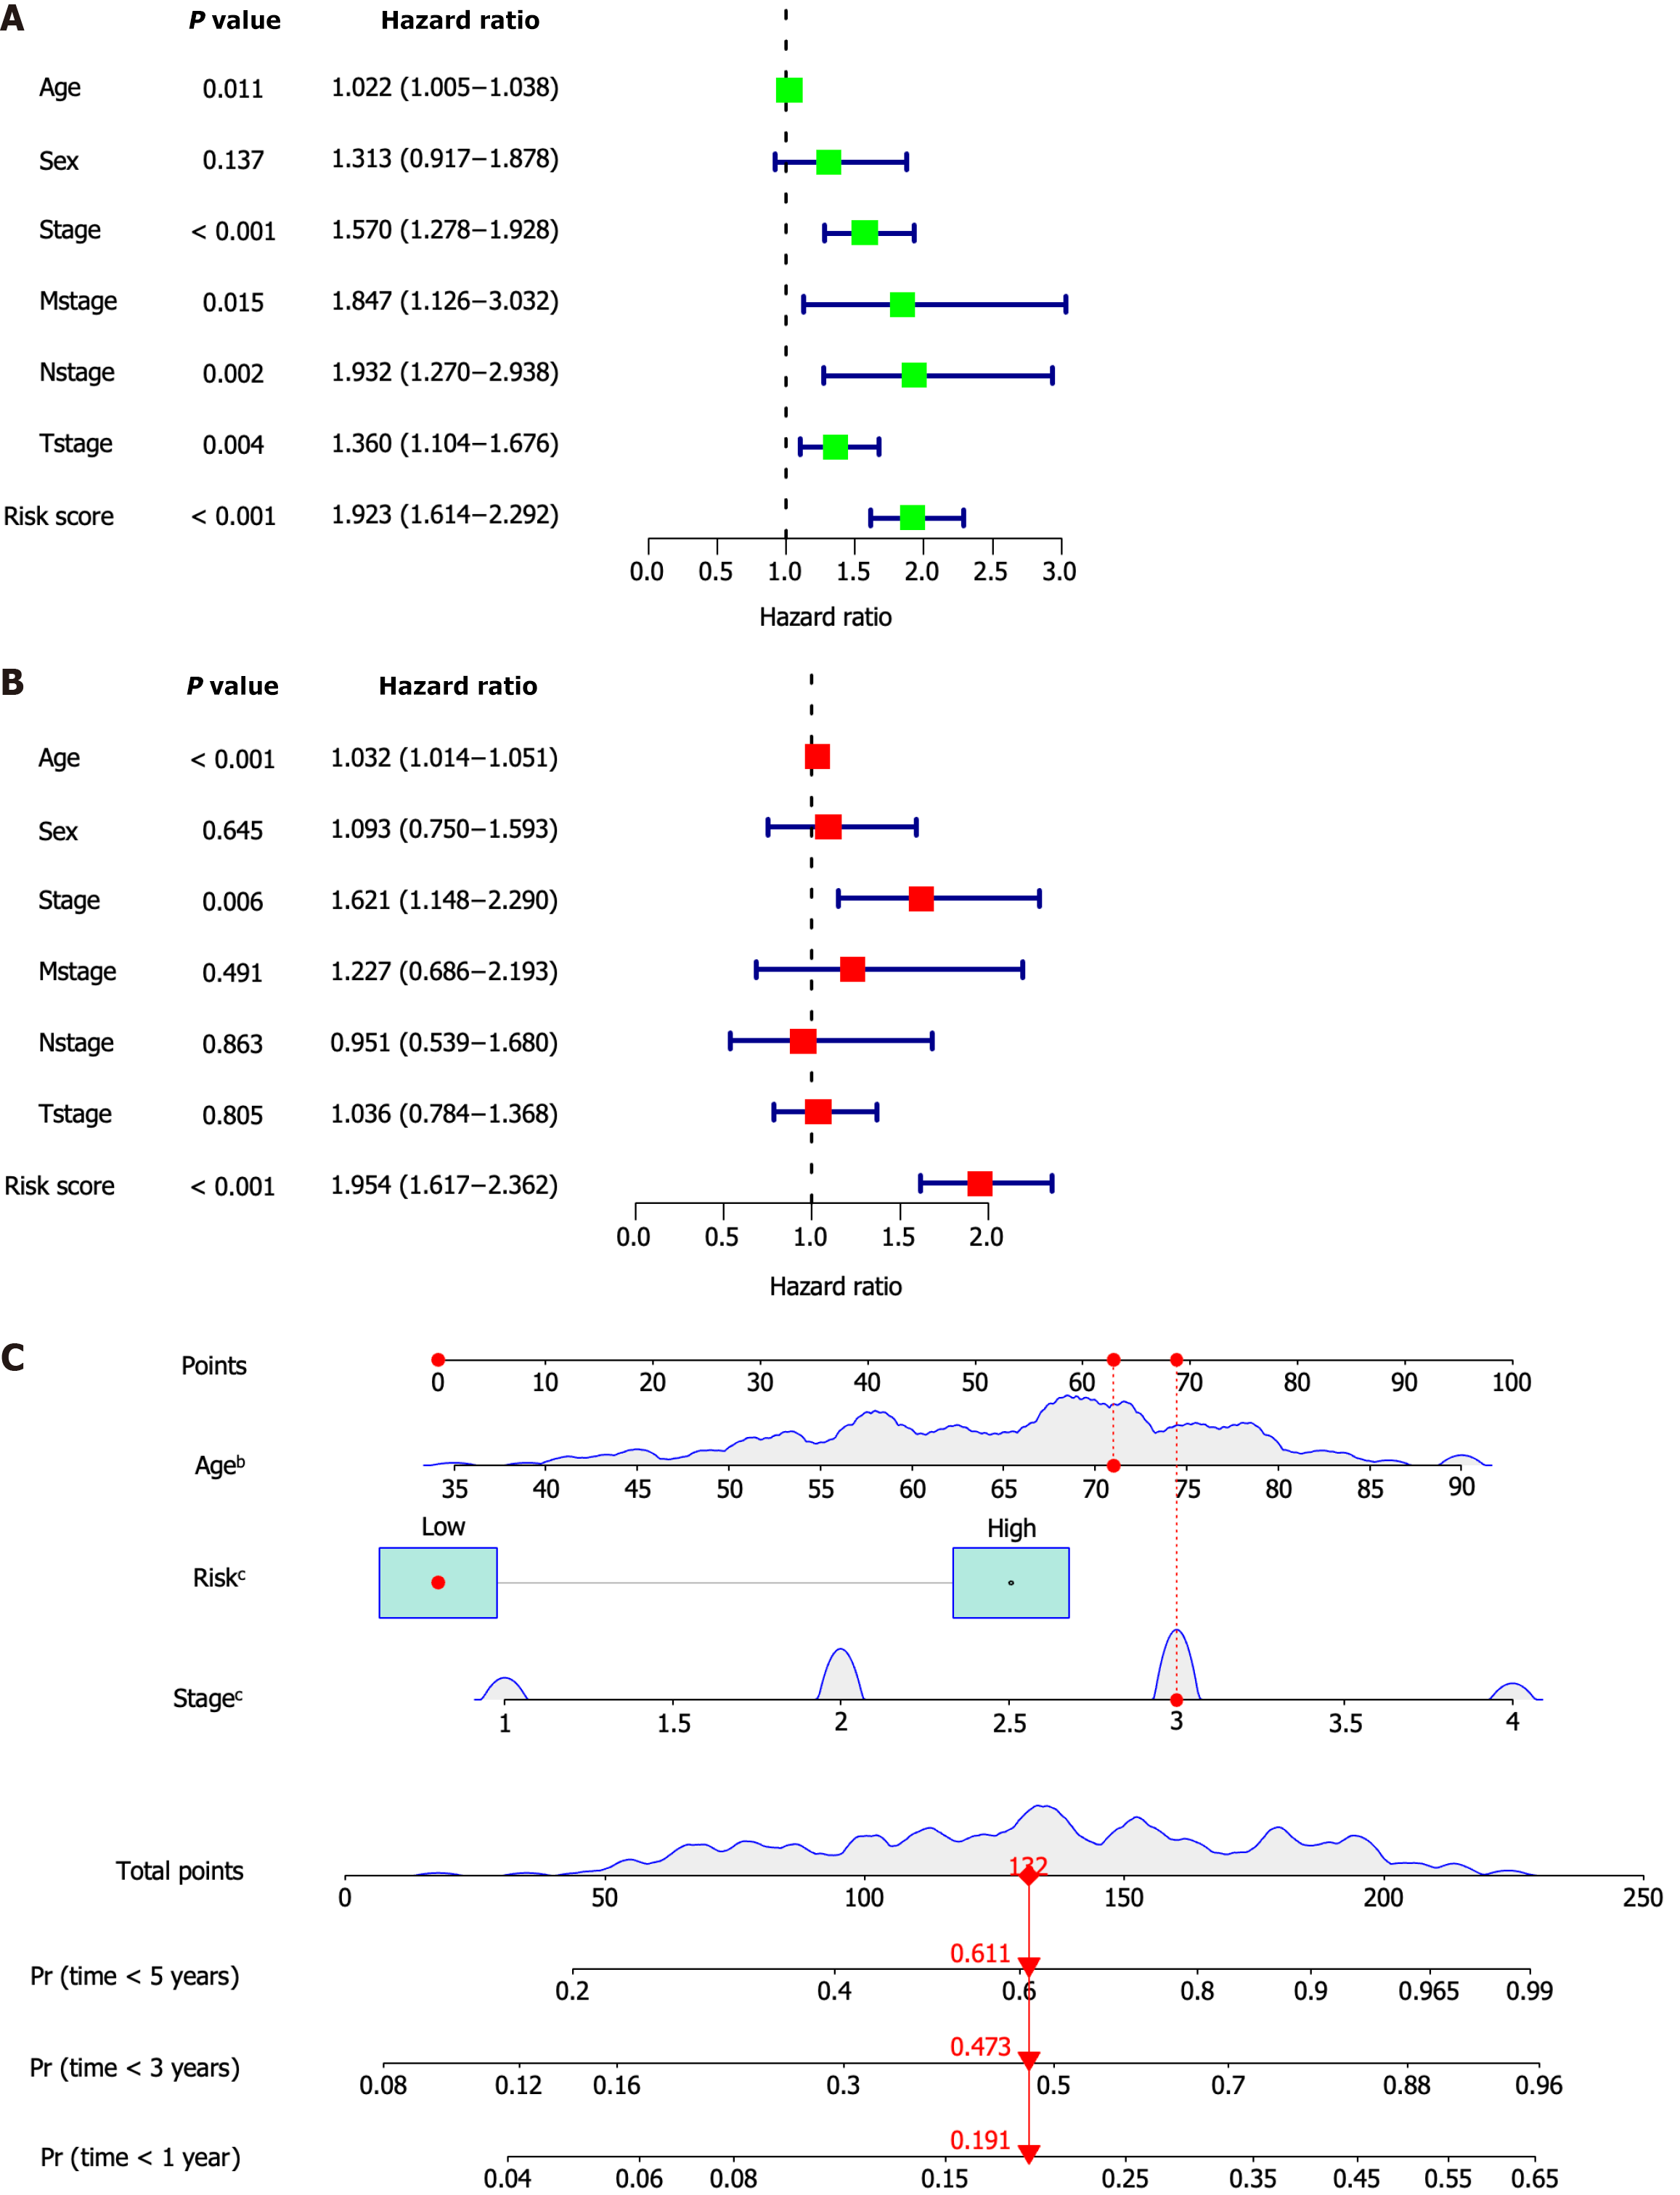
Figure 3 The risk signature's independent prognostic value and nomogram development.
A: Age, clinical stage, distant metastasis (M), lymph node metastasis (N), tumor size (T), and risk score all exhibited prognostic significance, according to a univariate Cox regression analysis; B: Age and risk score may be independent predictors of outcome, according to multivariate Cox regression analysis; C: The clinical stage and the risk score were combined to create a nomogram. bP < 0.01, cP < 0.001.
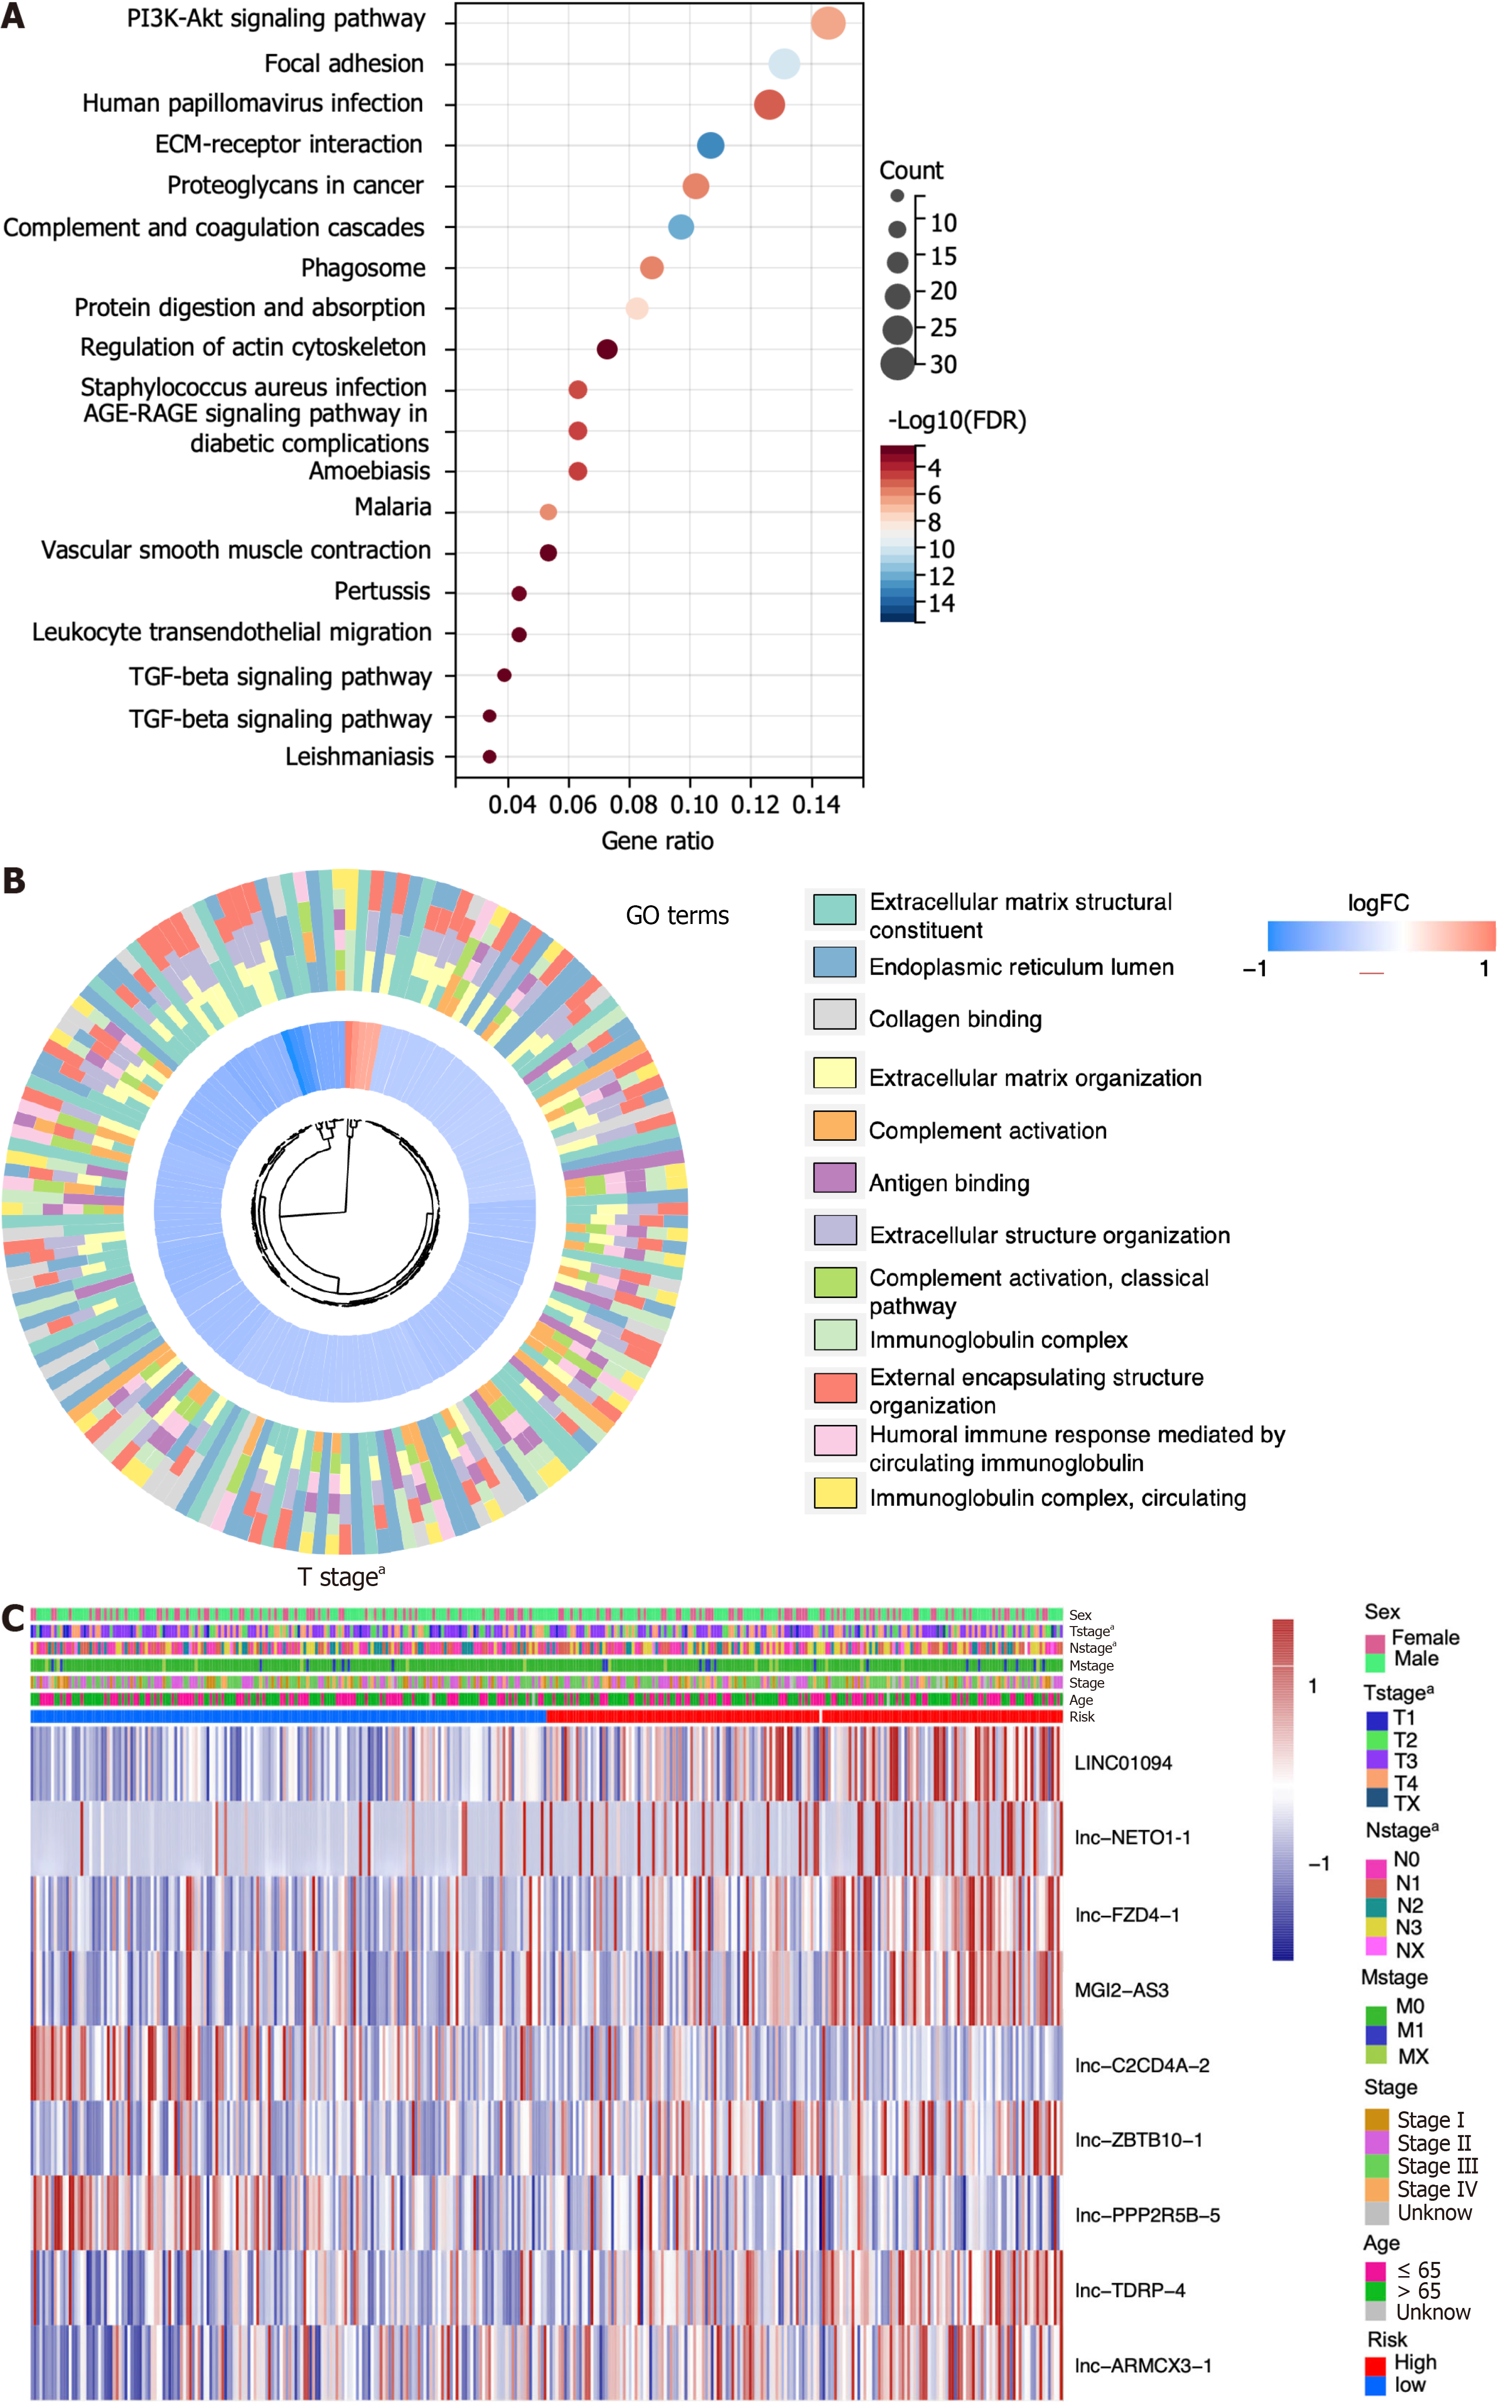
Figure 4 The functional enrichment analysis of differentially expressed genes in high- and low-risk groups was conducted.
A and B: The enrichment of differentially expressed genes between high-risk group and low-risk group was examined using KEGG and GO; C: The heatmap illustrates the relationship between risk score and clinical features (aP < 0.05).
Figure 5 Analyses of immune cell infiltration, immunological function, and immune checkpoints with risk groups.
A: Six algorithms to analyze the immune cell infiltration between different risk populations; B and C: Scores for immune function and the expression of immune checkpoints differentiate between those at high-risk group and low-risk group. aP < 0.05, bP < 0.01, cP < 0.001; ns: Not significant; HLA: Human leukocyte antigen.
- Citation: Wang Y, Li D, Xun J, Wu Y, Wang HL. Construction of prognostic markers for gastric cancer and comprehensive analysis of pyroptosis-related long non-coding RNAs. World J Gastrointest Surg 2024; 16(7): 2281-2295
- URL: https://www.wjgnet.com/1948-9366/full/v16/i7/2281.htm
- DOI: https://dx.doi.org/10.4240/wjgs.v16.i7.2281


