Copyright
©The Author(s) 2024.
World J Gastrointest Surg. Jul 27, 2024; 16(7): 2183-2193
Published online Jul 27, 2024. doi: 10.4240/wjgs.v16.i7.2183
Published online Jul 27, 2024. doi: 10.4240/wjgs.v16.i7.2183
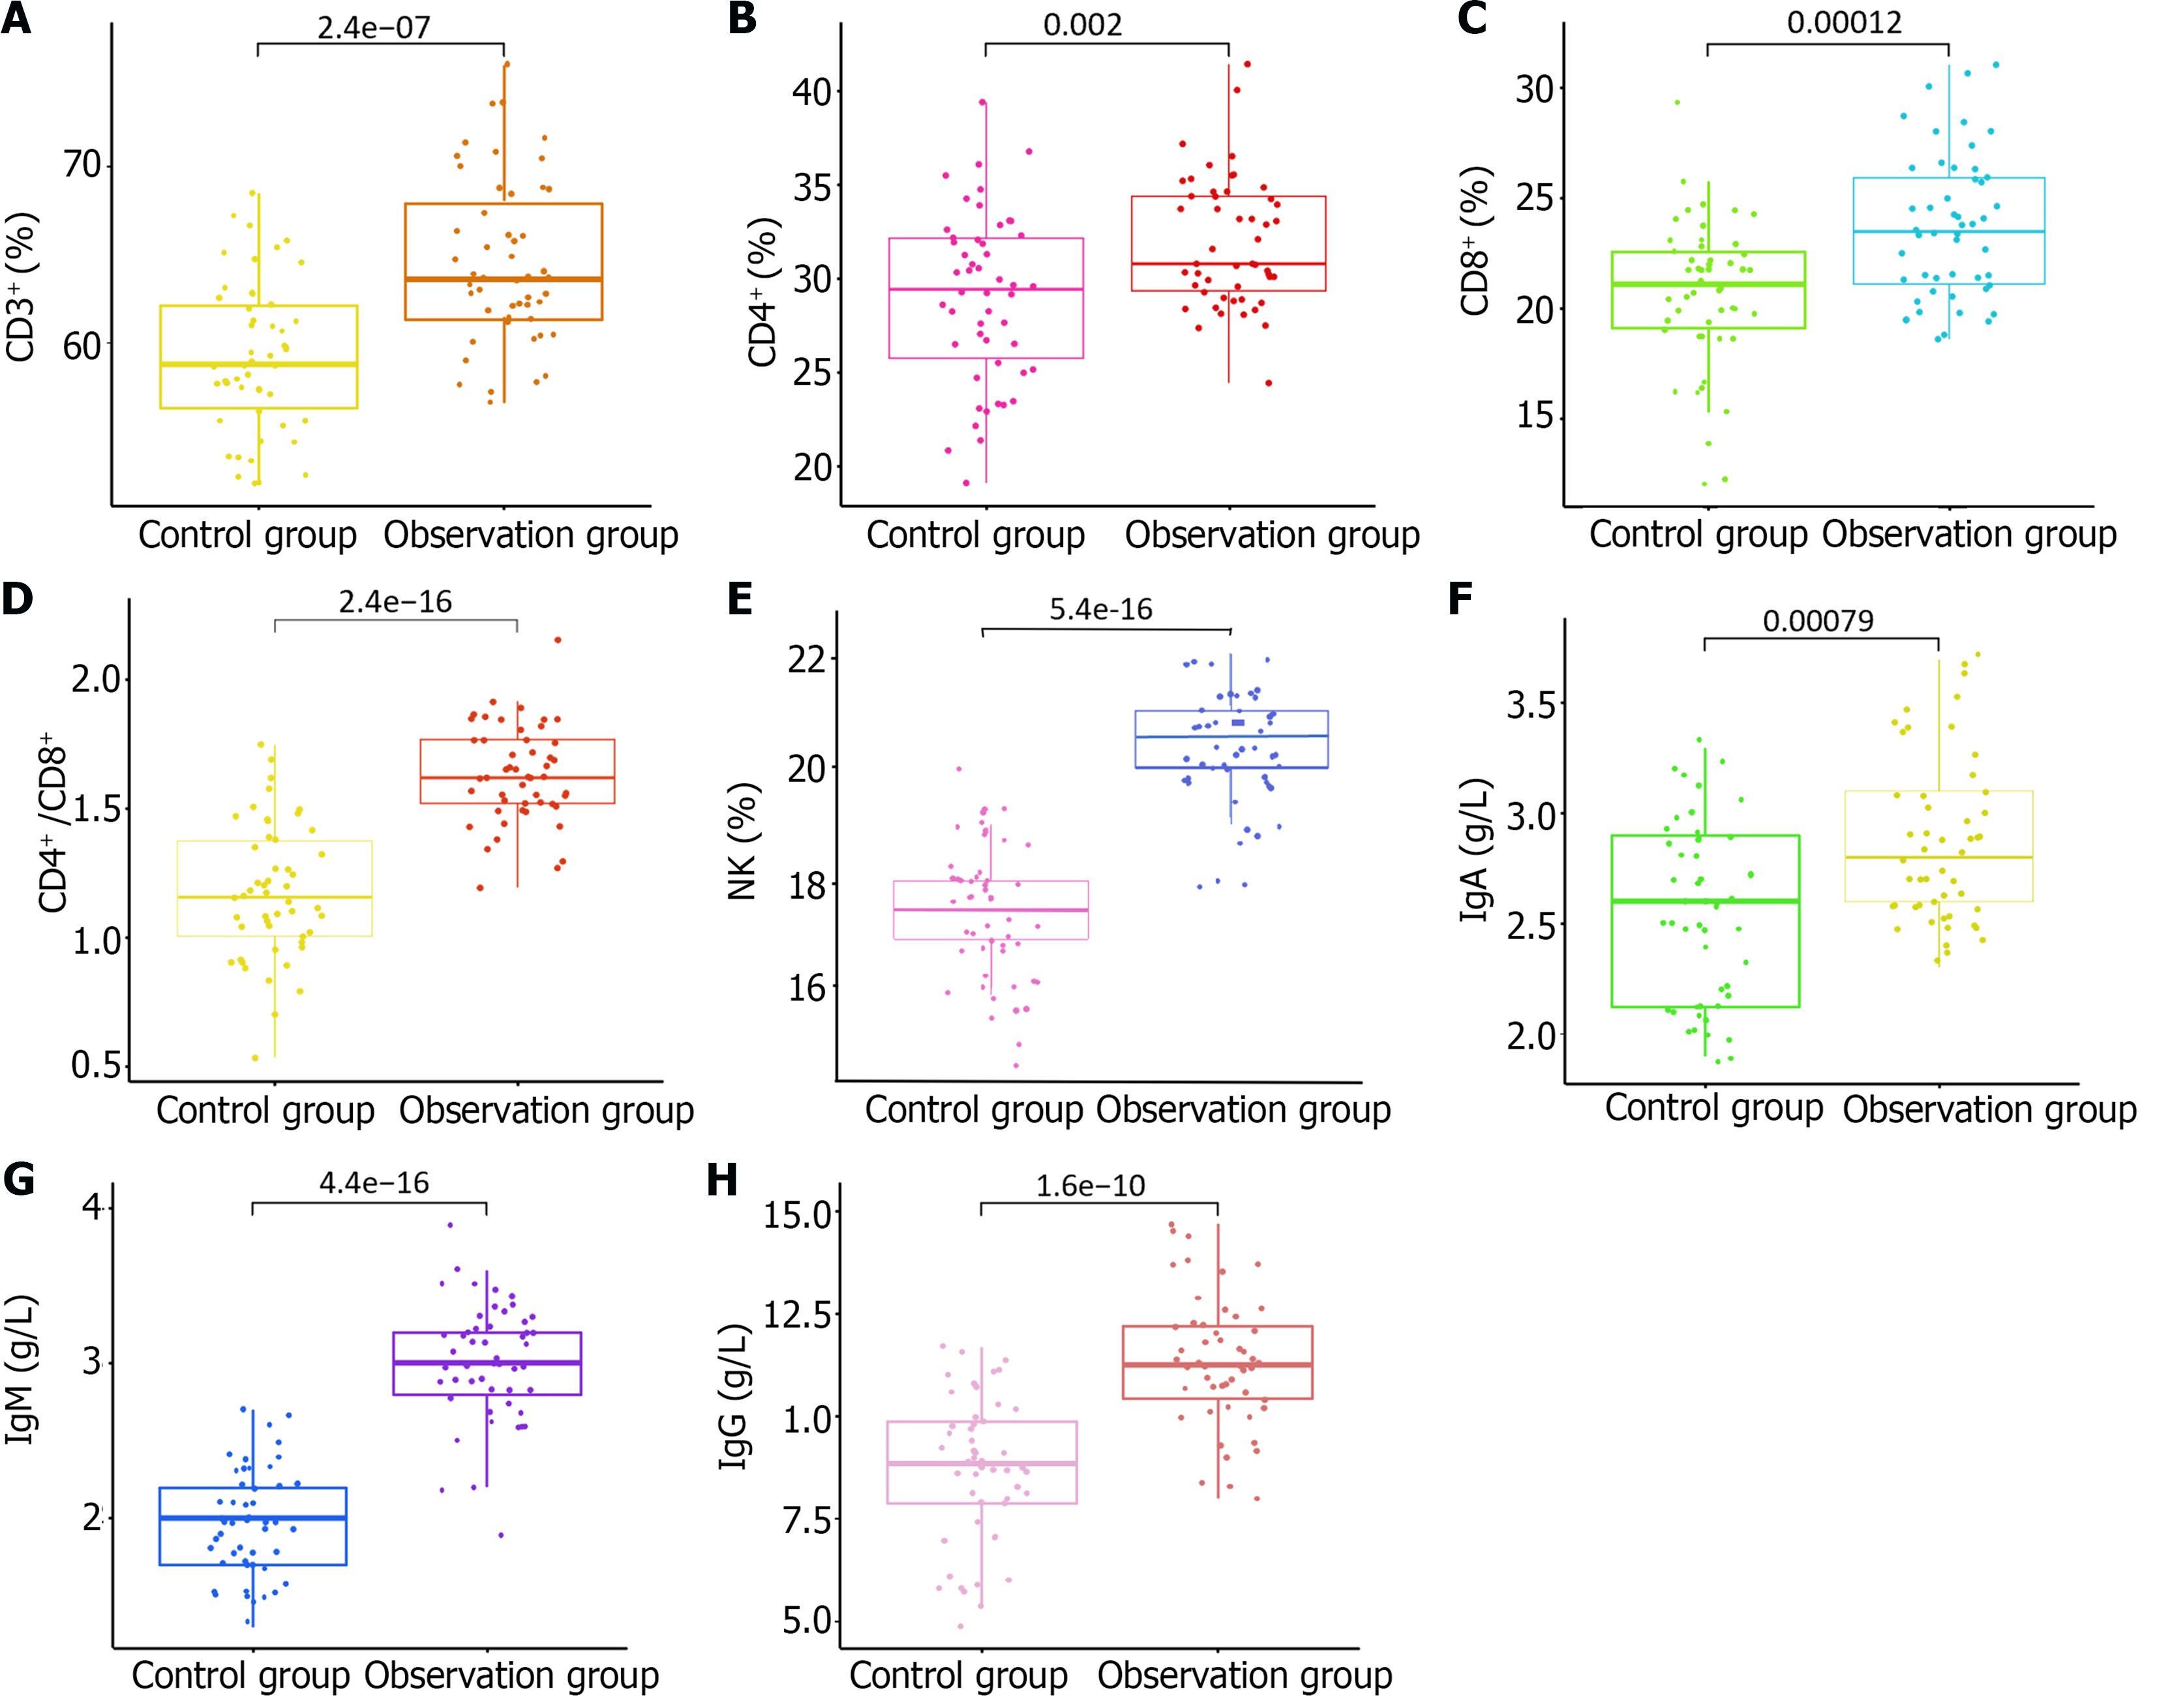
Figure 1 Comparison of immune function between the two groups after treatment.
A: CD3+ T lymphocytes; B: CD4+ T lymphocytes; C: CD8+ T lymphocytes; D: CD4+/CD8+ T lymphocyte ratio; E: NK cells; F: IgG; G: IgA; H: IgM. CD3+: Cluster of differentiation 3; CD4+: Cluster of differentiation 4; CD8+: Cluster of differentiation 8; IgA: Immunoglobulin A; IgG: Immunoglobulin G; IgM: Immunoglobulin M; NK: Natural killer.
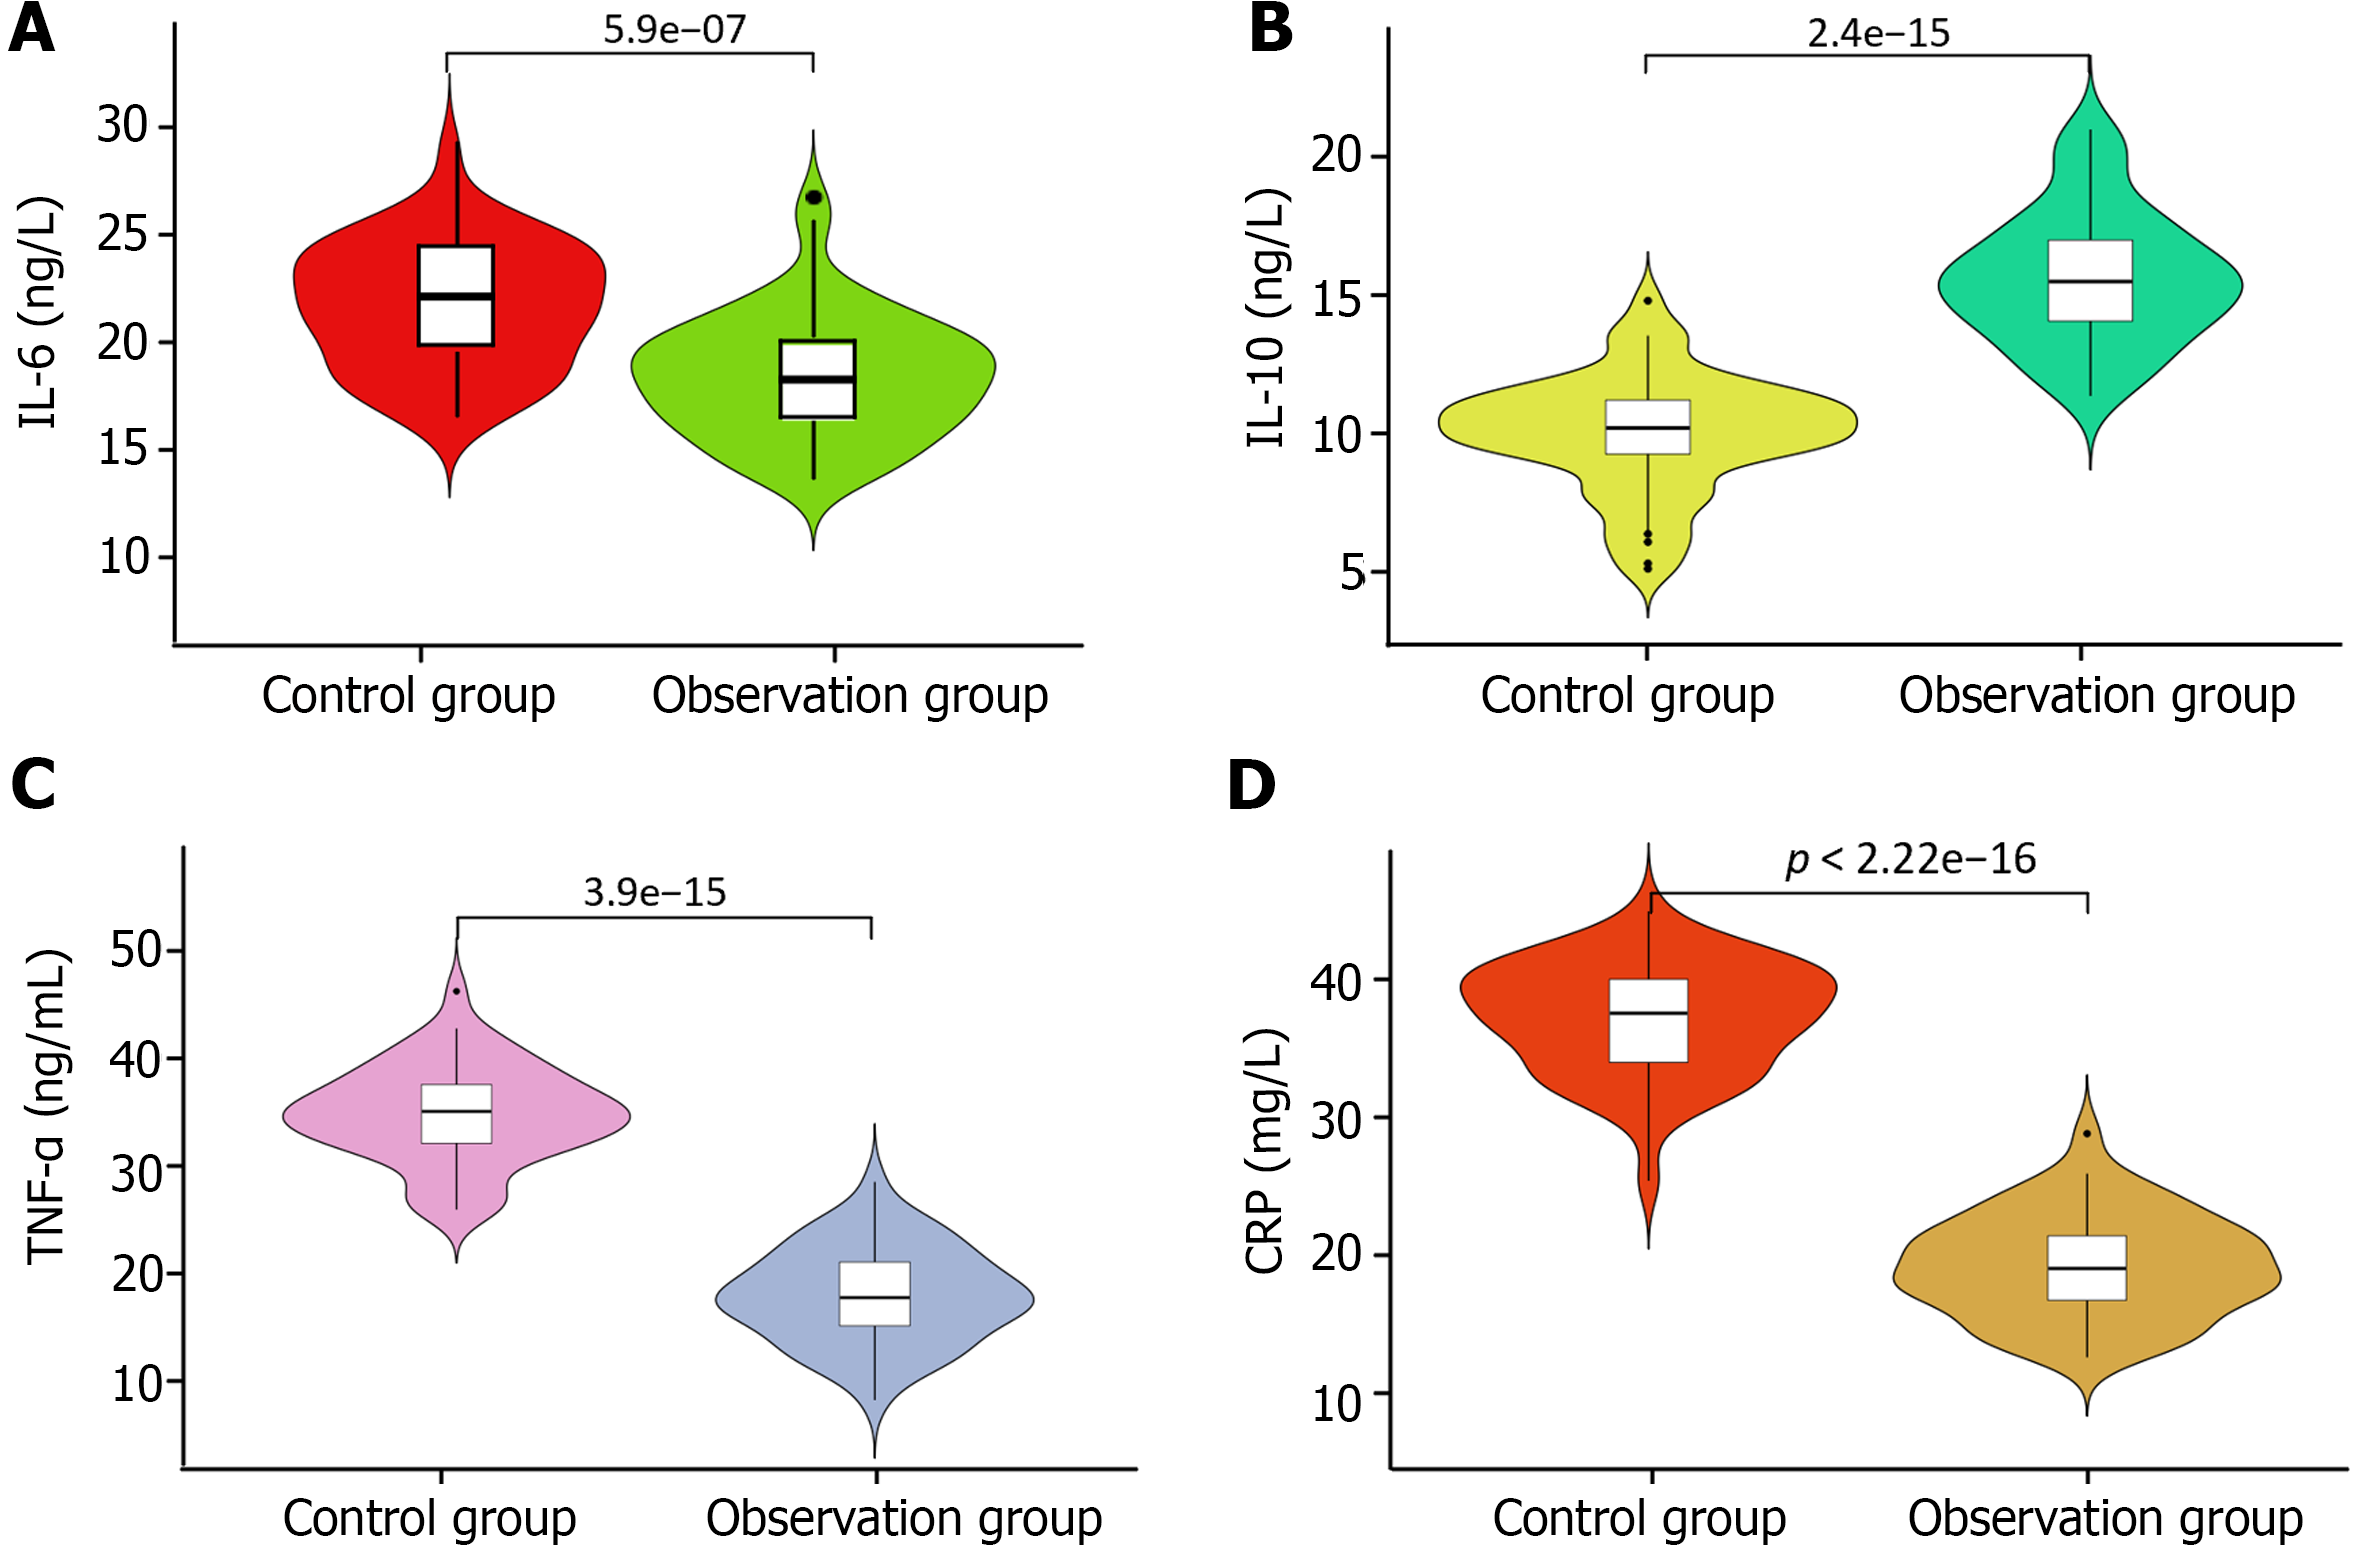
Figure 2 Comparison of levels of inflammatory mediators between the two groups after treatment.
A: Interleukin (IL)-6; B: IL-10; C: Tumor necrosis factor-alpha; D: C-reactive protein. CRP: C-reactive protein; IL-6: Interleukin-6; IL-10: Interleukin-10; TNF-α: Tumor necrosis factor-alpha.
- Citation: Hu Q, Chen XP, Tang ZJ, Zhu XY, Liu C. Therapeutic effects of Buzhong Yiqi decoction in patients with spleen and stomach qi deficiency after routine surgery and chemotherapy for colorectal cancer. World J Gastrointest Surg 2024; 16(7): 2183-2193
- URL: https://www.wjgnet.com/1948-9366/full/v16/i7/2183.htm
- DOI: https://dx.doi.org/10.4240/wjgs.v16.i7.2183


