Copyright
©The Author(s) 2024.
World J Gastrointest Surg. Jun 27, 2024; 16(6): 1825-1834
Published online Jun 27, 2024. doi: 10.4240/wjgs.v16.i6.1825
Published online Jun 27, 2024. doi: 10.4240/wjgs.v16.i6.1825
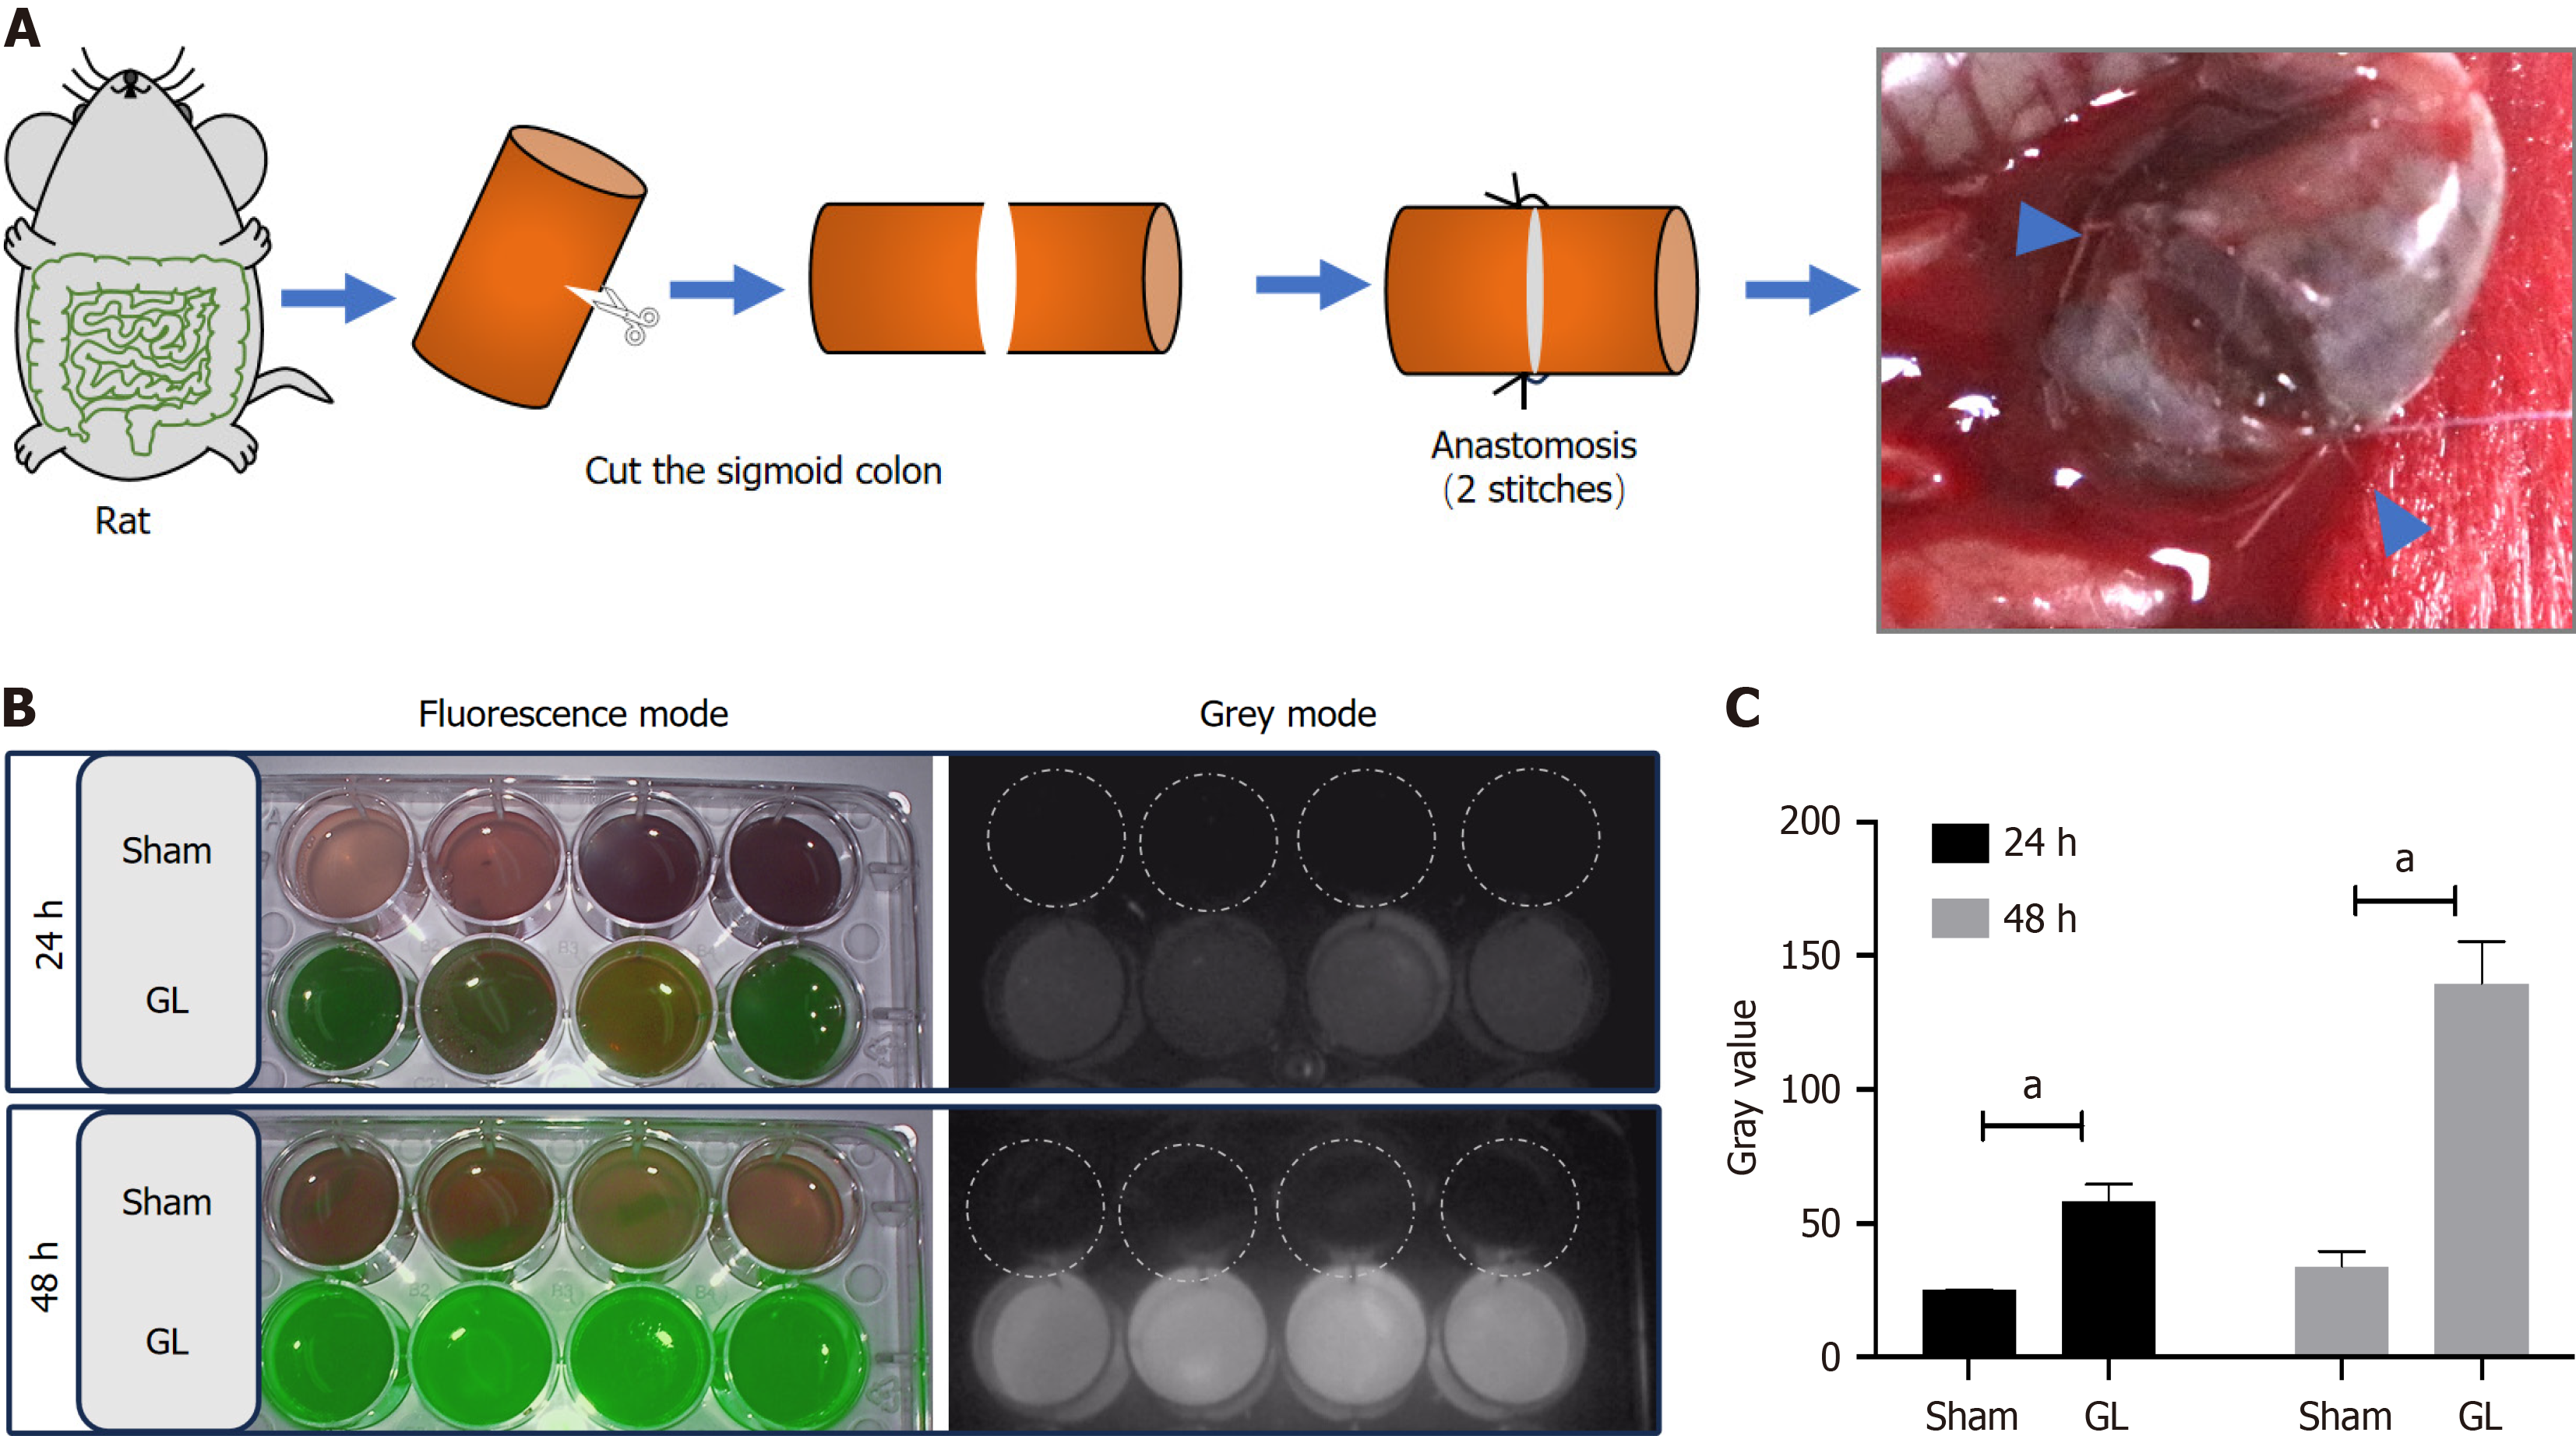
Figure 1 Indocyanine green test diagnosed leakage in rat gut leakage model.
A: Gut anastomotic leakage model in rat. The sigmoid colon was cut, disassociated, and anastomosed with two stitches (blue triangles); B: Indocyanine green (ICG) test results of peritoneal fluids between gut leakage (GL) group and sham group at 24 and 48 h. Data show green fluorescence in the GL model; C: Gray values indicate ICG test results in each group at 24 and 48 h. Data show increased gray values in the GL model compared with that in the sham group. Data are presented as a bar graph with mean ± SD and were compared using the student’s t test, aP < 0.0001.
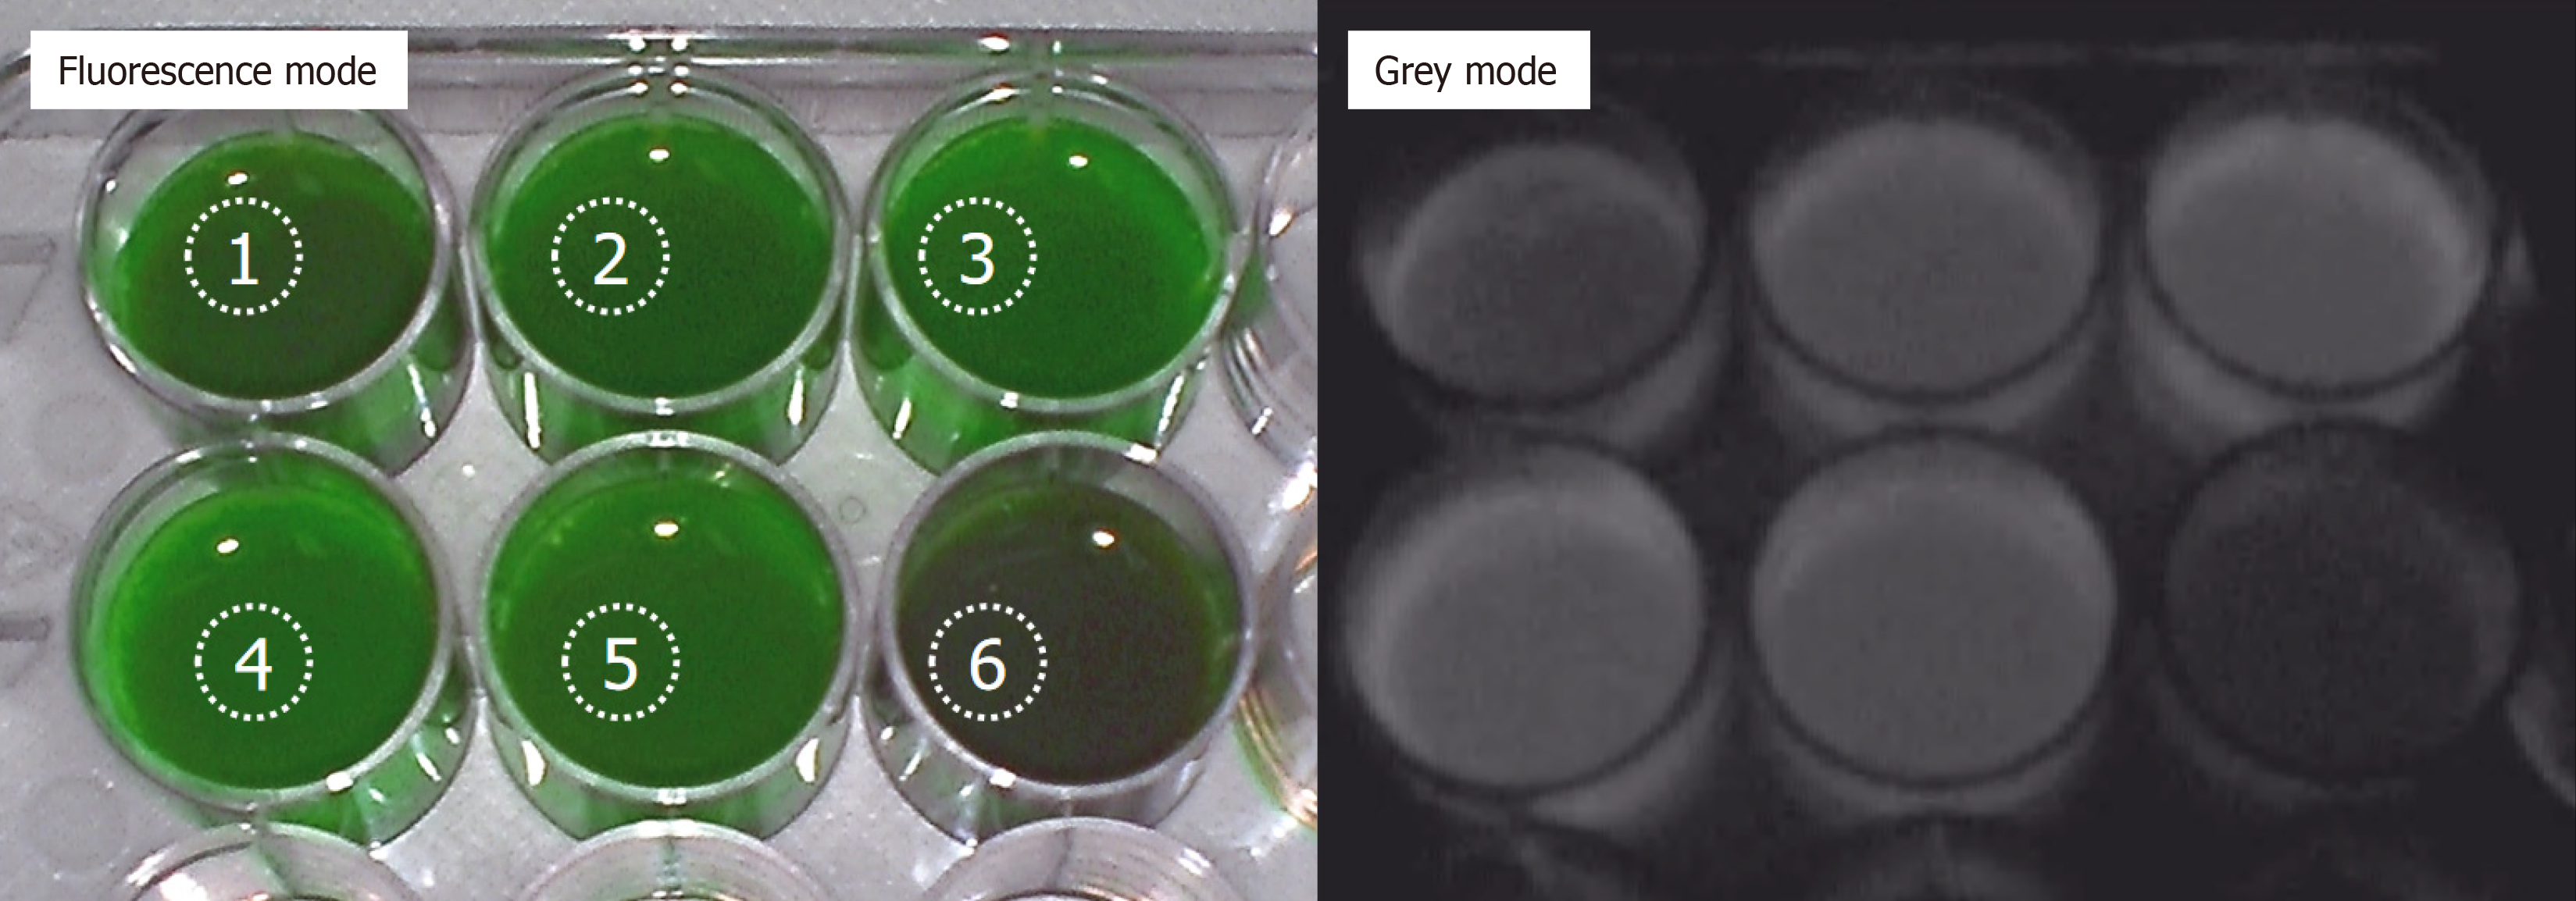
Figure 2 Indocyanine green detected in ostomy fluids in patients with enterostomy stomas.
Indocyanine green test results of ostomy liquids from six patients using fluorescence and gray modes. The collection can be seen in green in the fluorescence mode.
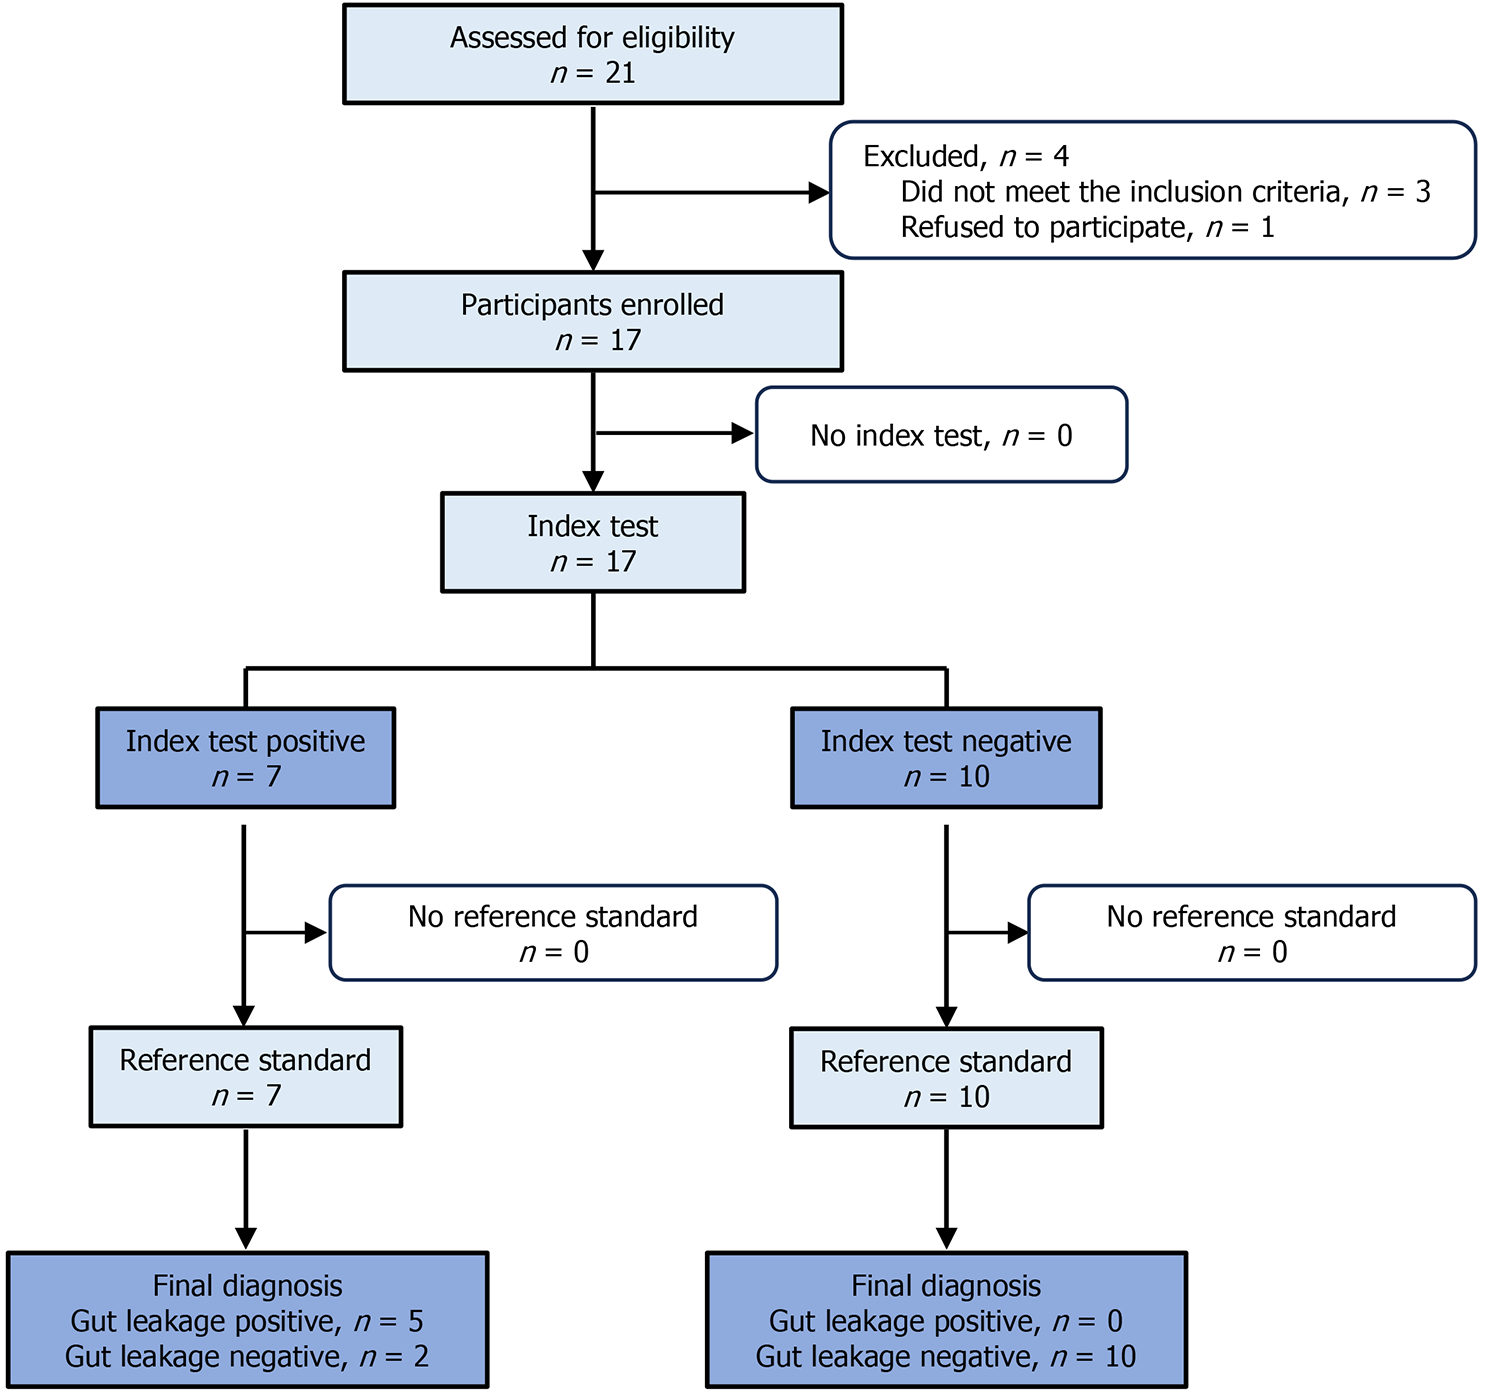
Figure 3 STARD flow diagram of the diagnostic test.
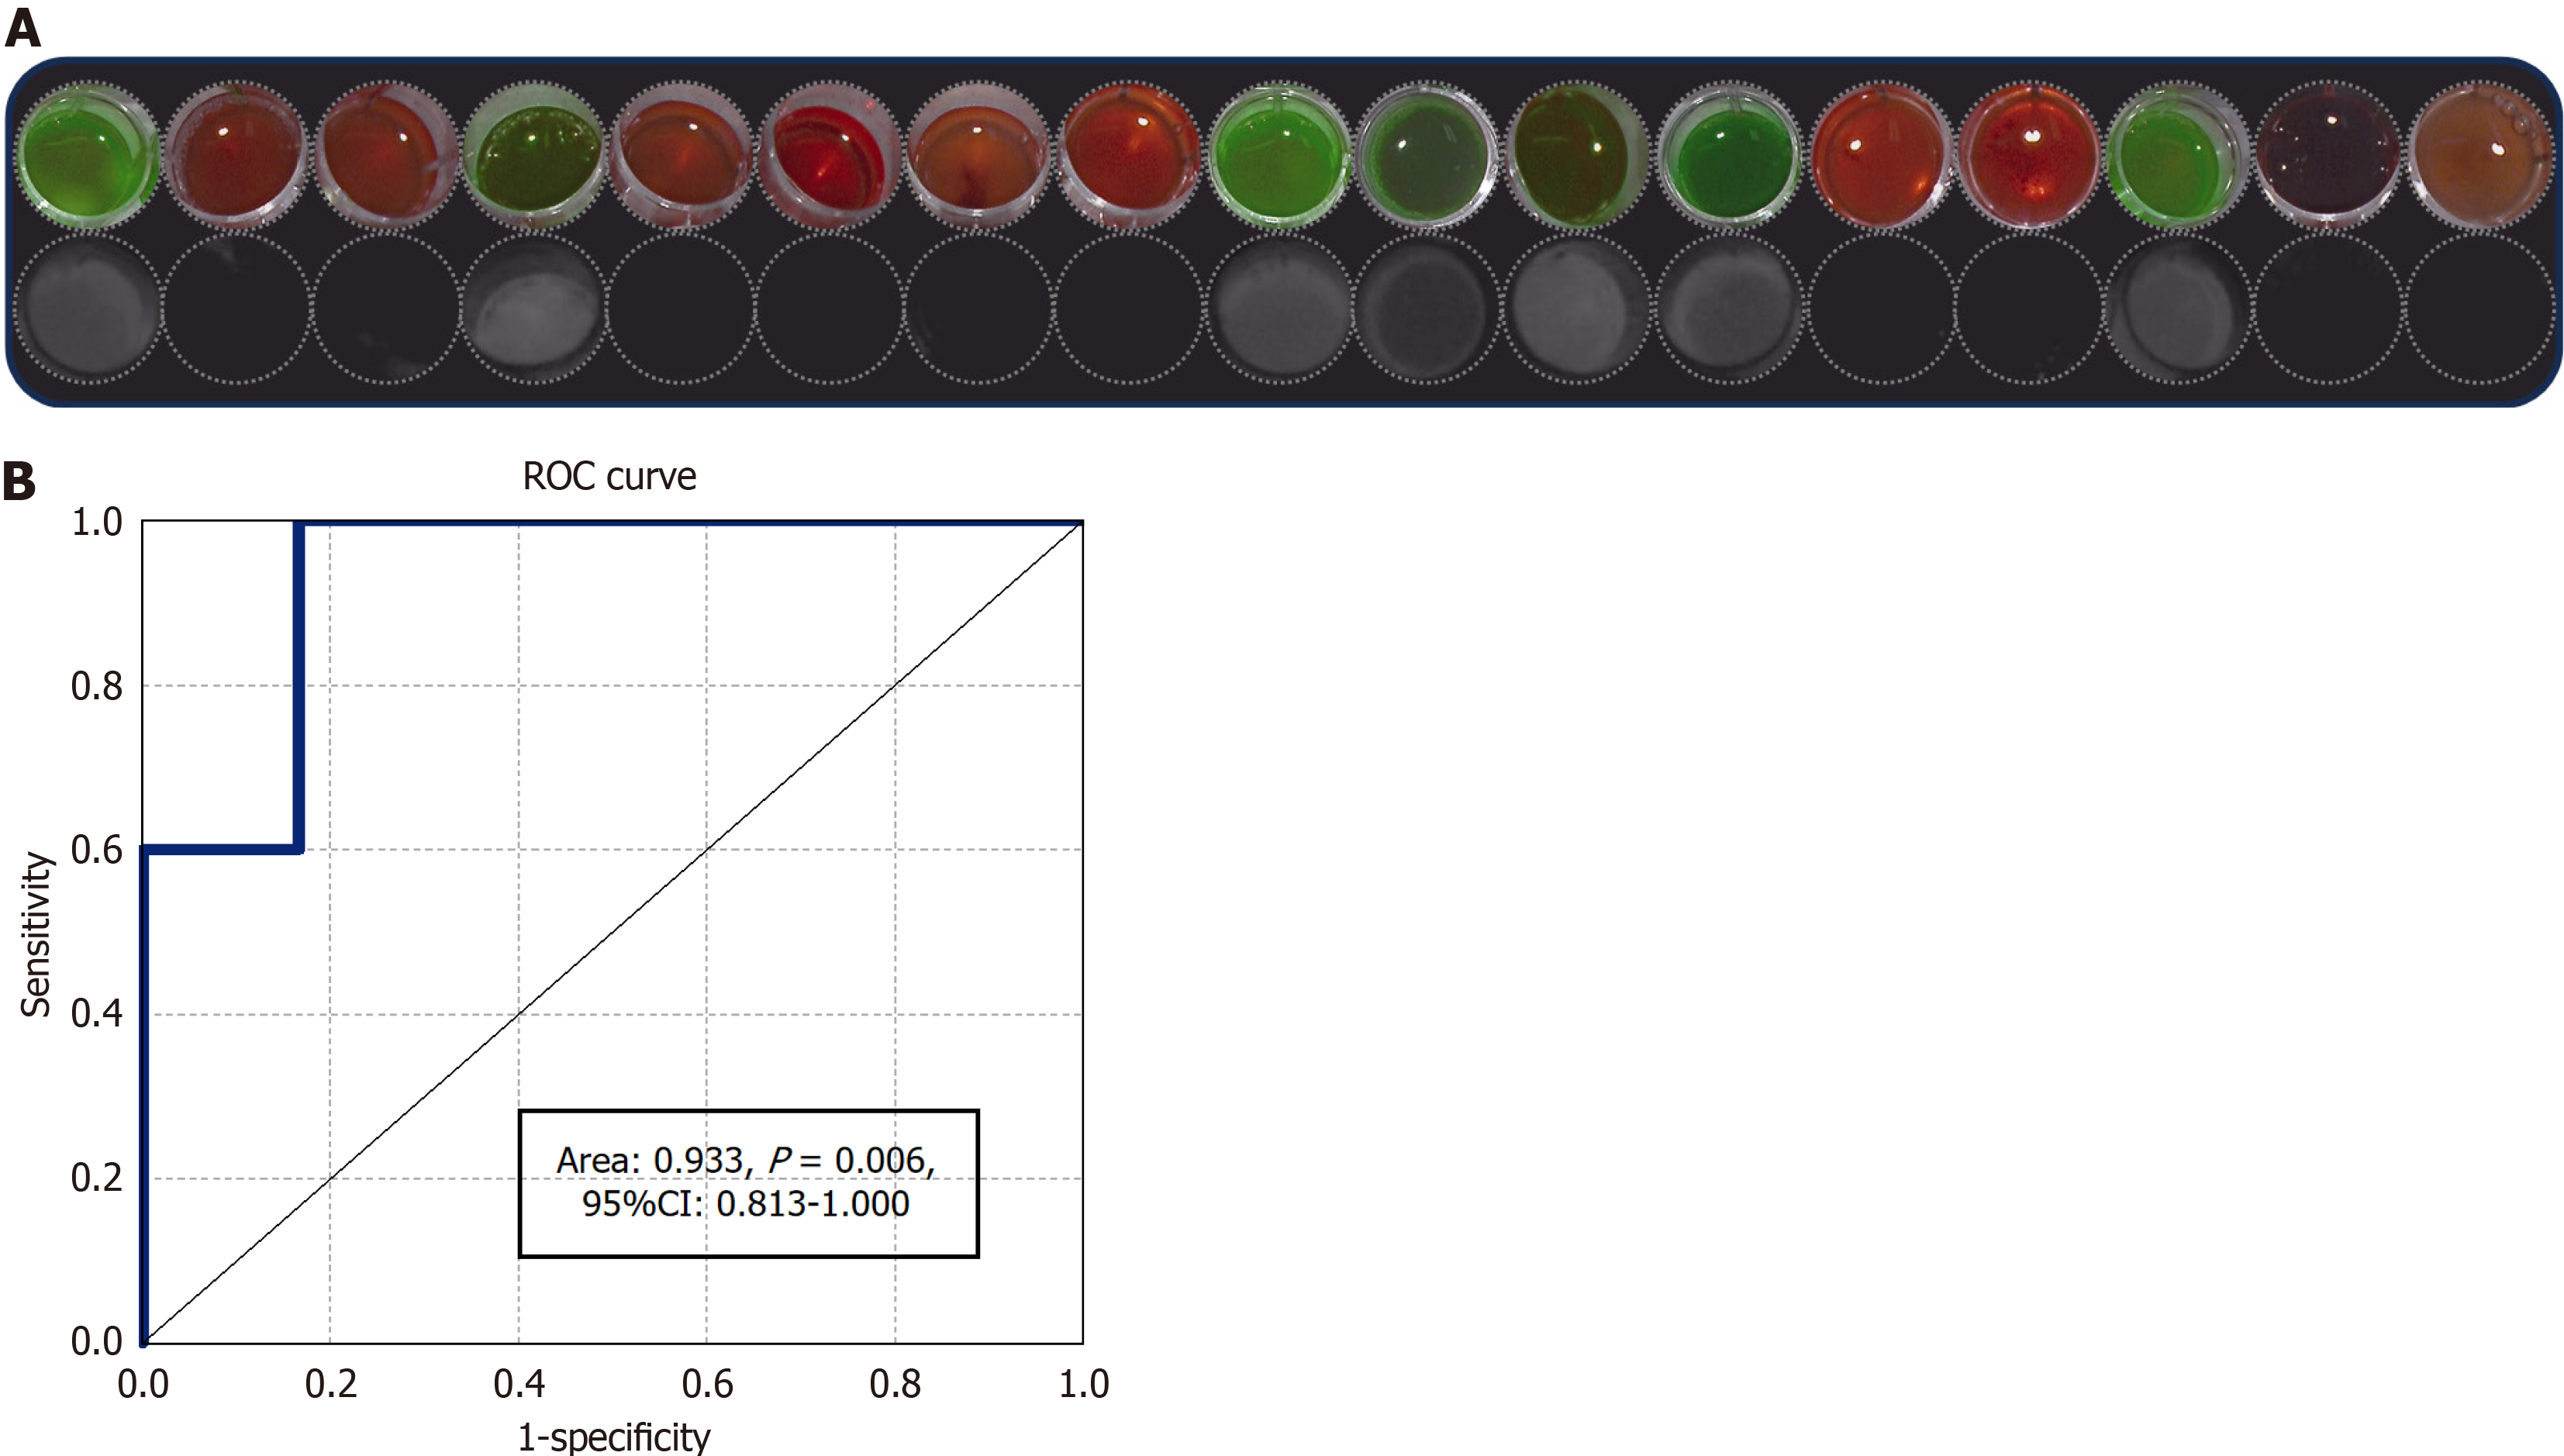
Figure 4 Diagnostic test results.
A: Indocyanine green (ICG) test results of drainage fluids from 17 patients using fluorescence and gray modes; B: Receiver operating curves of predictive values of ICG for identifying postoperative gut leakage in patients.
- Citation: Huang Y, Li TY, Weng JF, Liu H, Xu YJ, Zhang S, Gu WL. Peritoneal fluid indocyanine green test for diagnosis of gut leakage in anastomotic leakage rats and colorectal surgery patients. World J Gastrointest Surg 2024; 16(6): 1825-1834
- URL: https://www.wjgnet.com/1948-9366/full/v16/i6/1825.htm
- DOI: https://dx.doi.org/10.4240/wjgs.v16.i6.1825


