Copyright
©The Author(s) 2024.
World J Gastrointest Surg. Jun 27, 2024; 16(6): 1775-1790
Published online Jun 27, 2024. doi: 10.4240/wjgs.v16.i6.1775
Published online Jun 27, 2024. doi: 10.4240/wjgs.v16.i6.1775
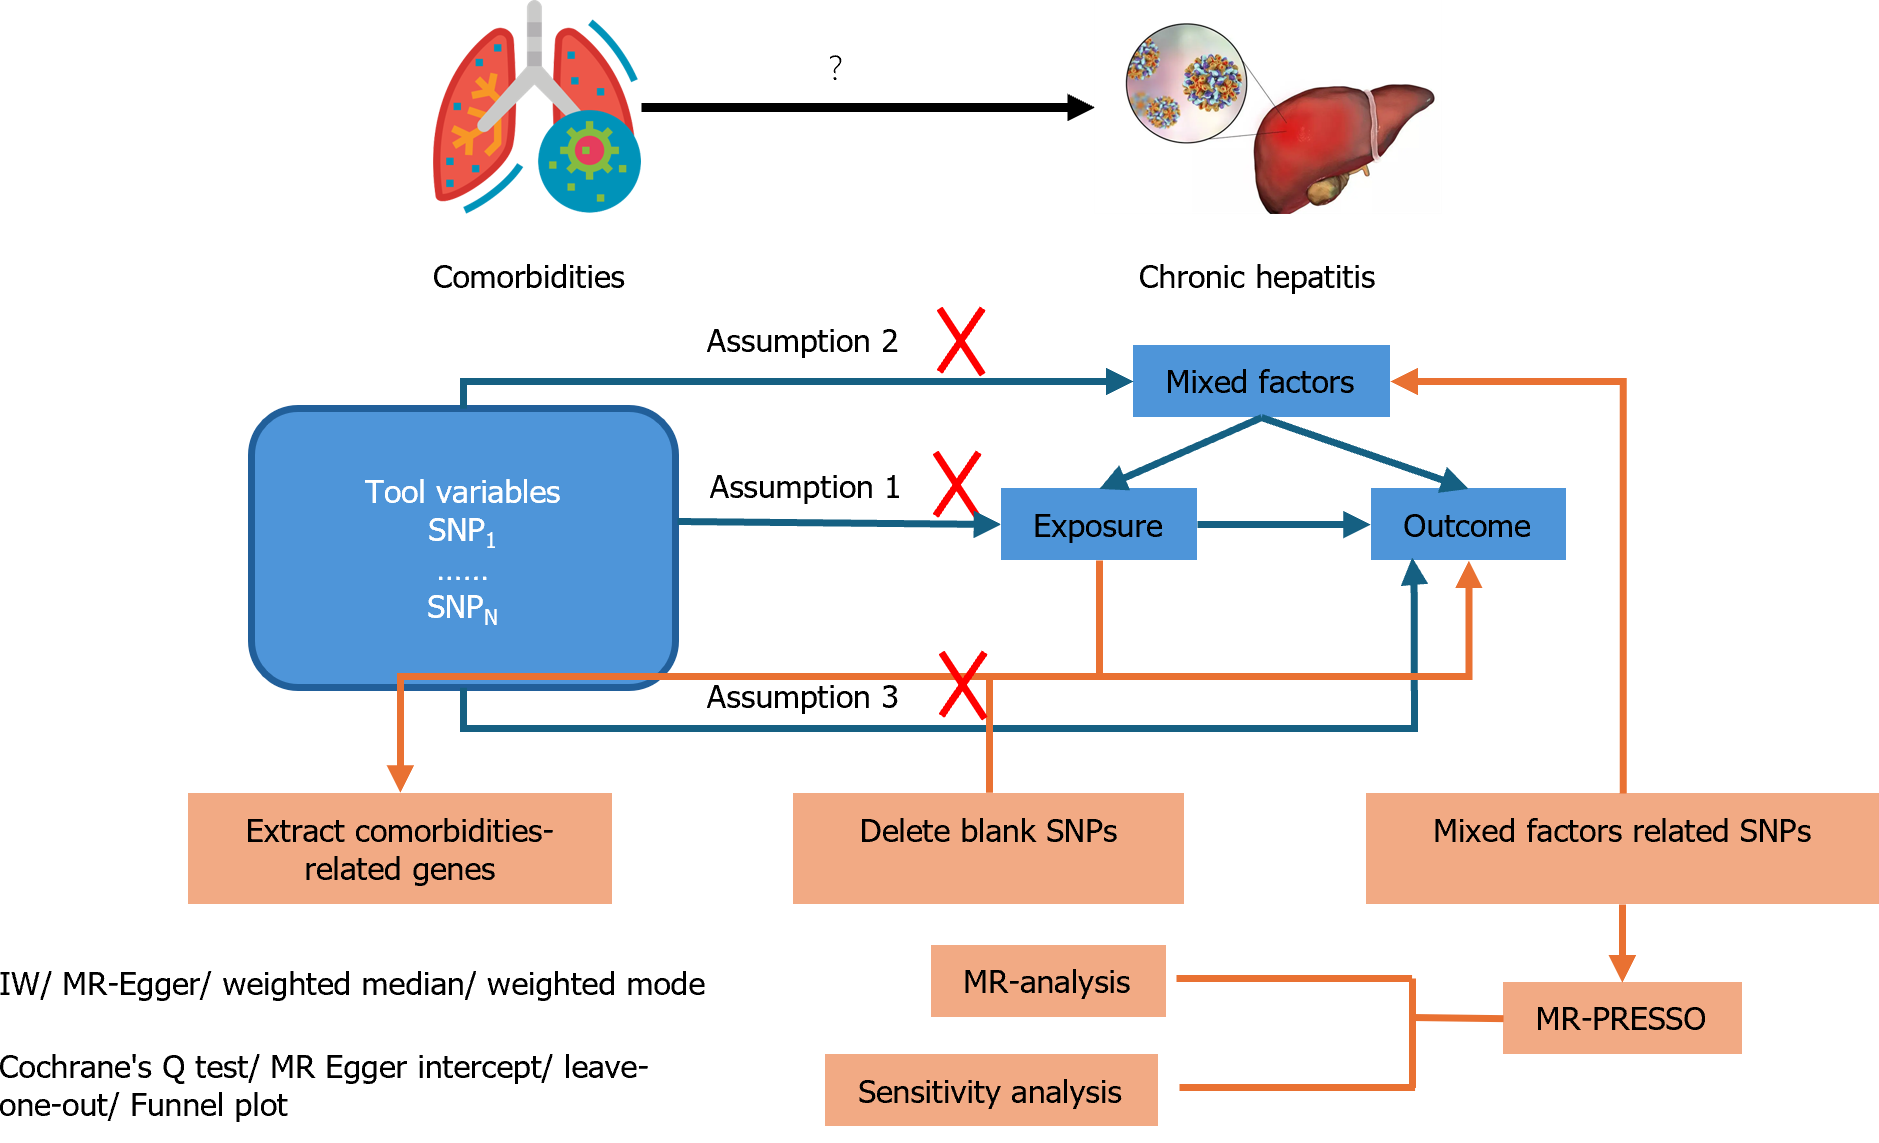
Figure 1 Mendelian randomization analysis.
MR: Mendelian randomization; SNP: Single nucleotide polymorphism.
Figure 2 Forest plot of the comorbidities.
A and B: type 2 diabetes mellitus; C and D: Hyperlipidemia; E and F: Hypertension affecting chronic hepatitis B infection (upper panel) and chronic hepatitis C infection (lower panel). MR: Mendelian randomization.
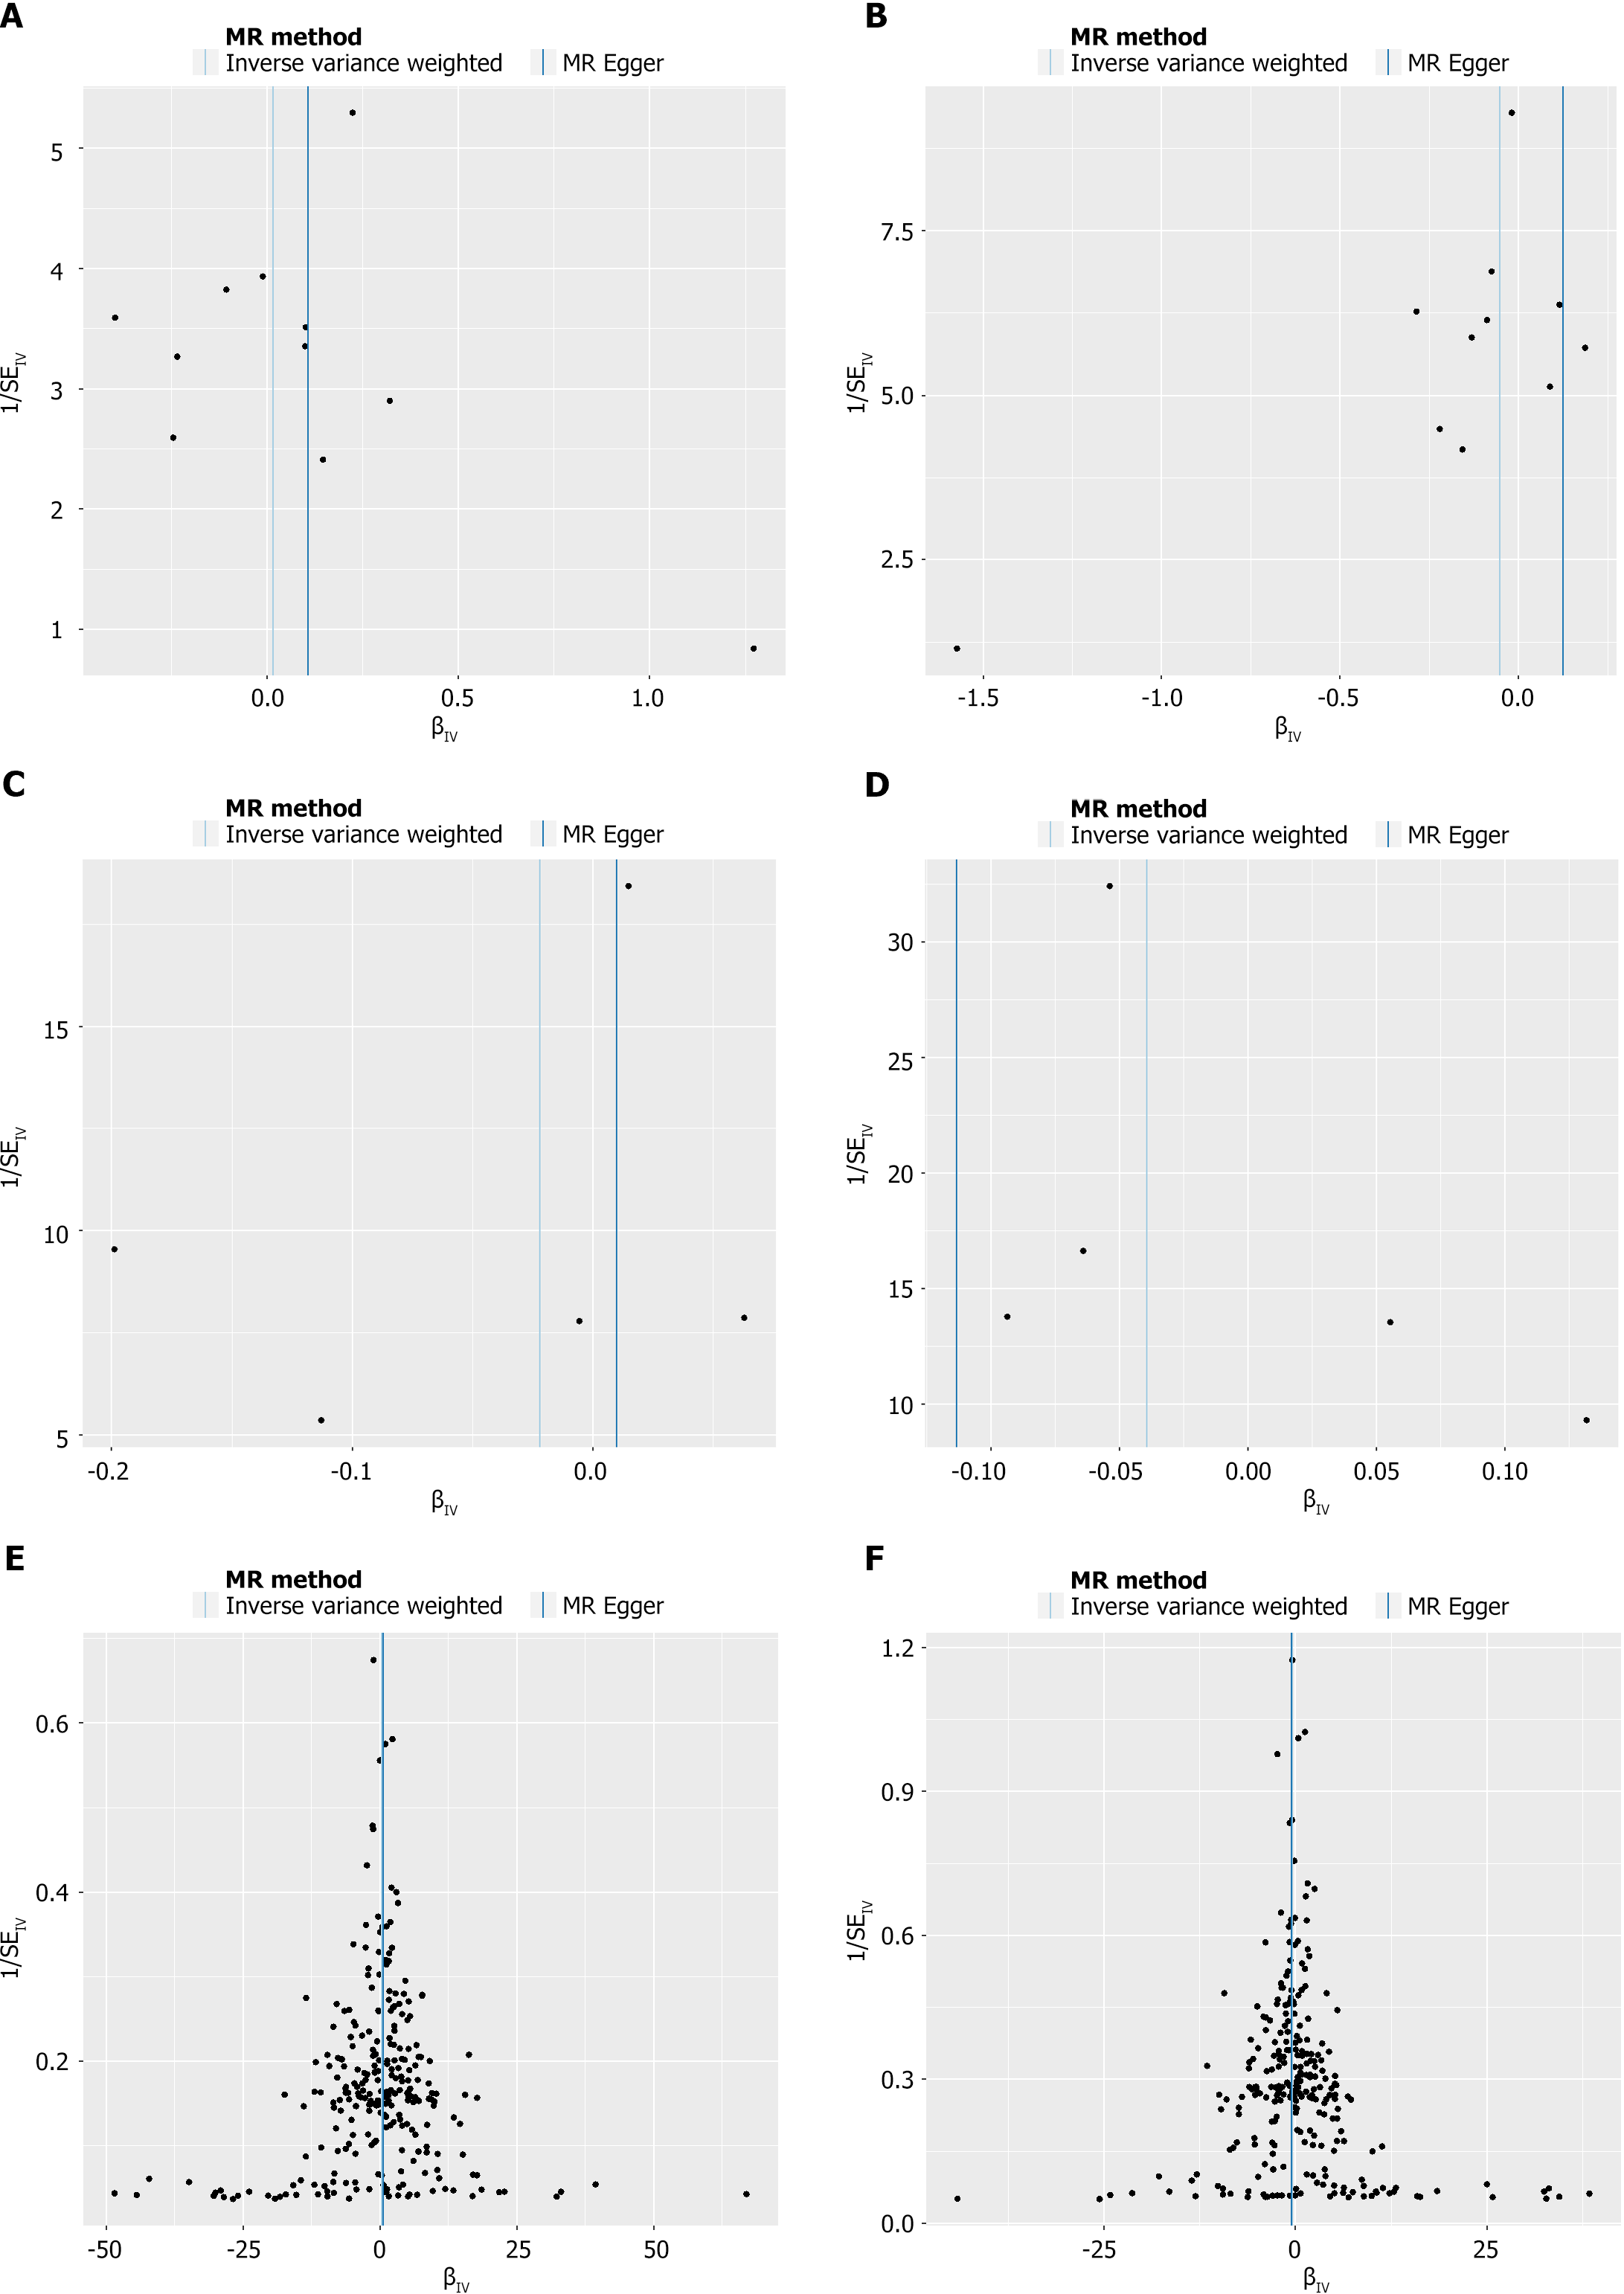
Figure 3 Funnel plot of the comorbidities.
A and B: Type 2 diabetes mellitus; C and D: Hyperlipidemia; E and F: Hypertension affecting chronic hepatitis B infection (upper panel) and chronic hepatitis C infection (lower panel). MR: Mendelian randomization.
Figure 4 Leave one-out plot of the comorbidities.
A and B: Type 2 diabetes mellitus; C and D: Hyperlipidemia; E and F: Hypertension affecting chronic hepatitis B infection (upper panel) and chronic hepatitis C infection (lower panel). MR: Mendelian randomization.
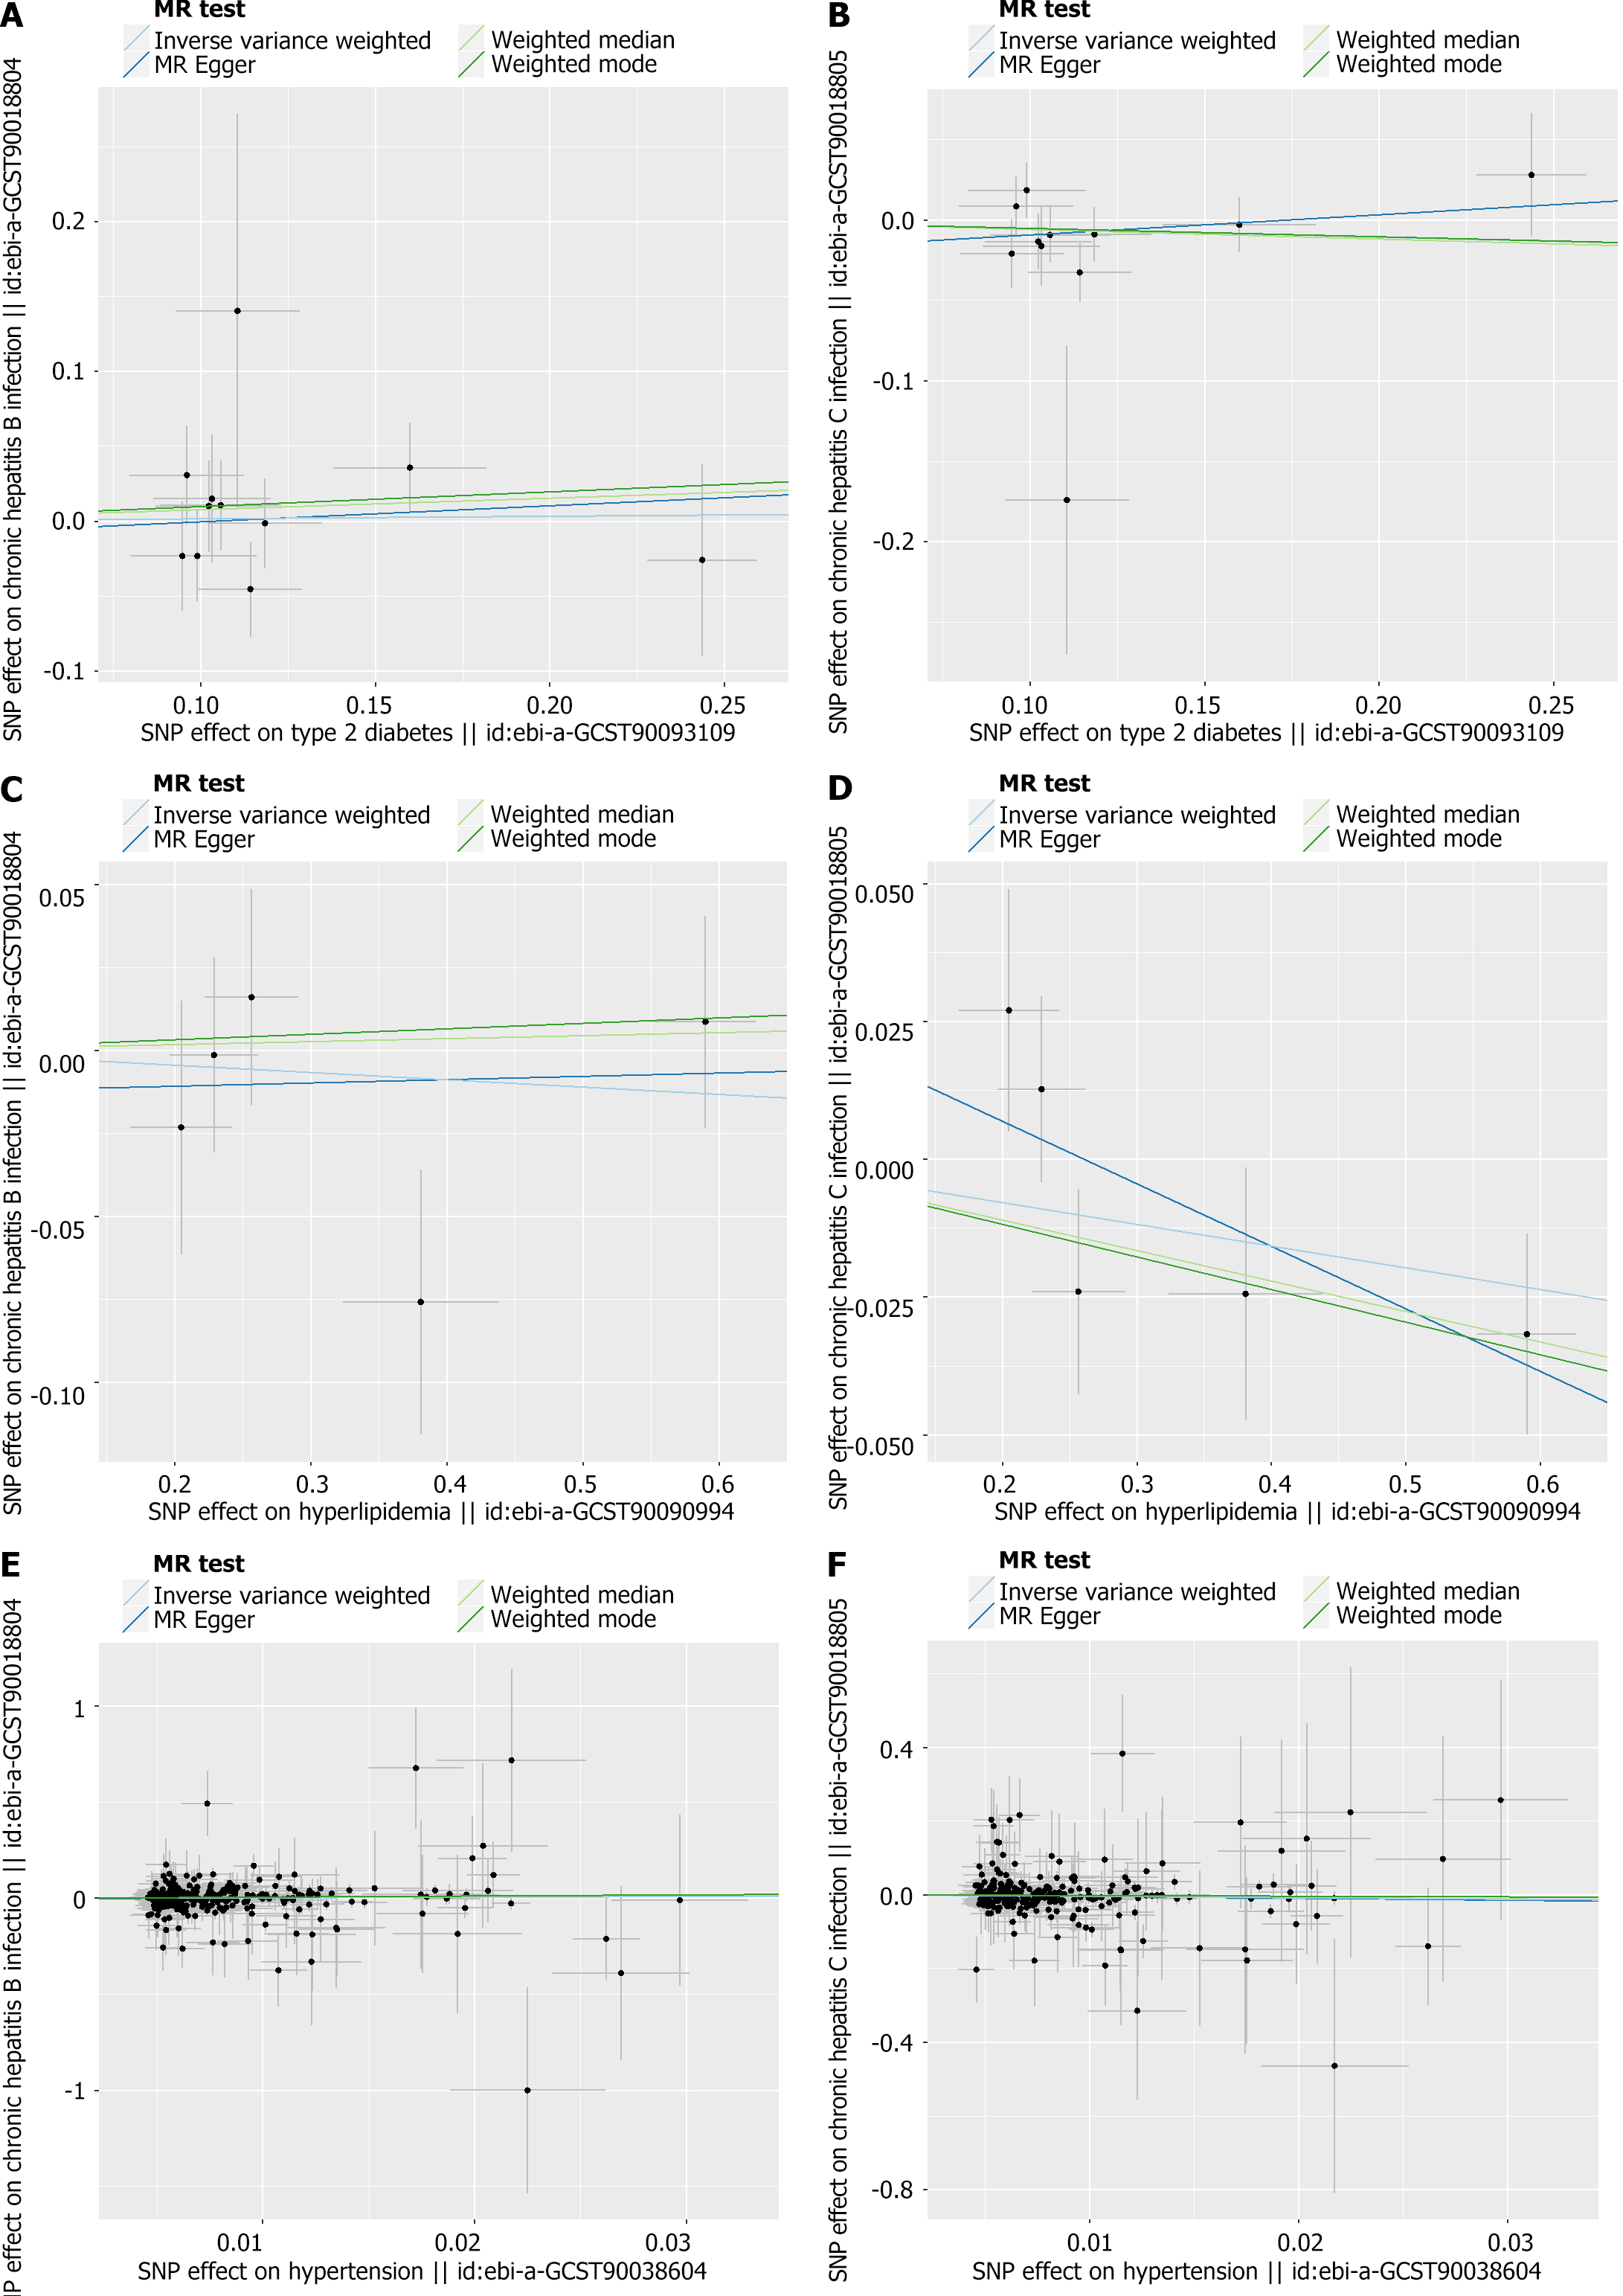
Figure 5 Scatter plot of the comorbidities.
A and B: Type 2 diabetes mellitus; C and D: Hyperlipidemia; E and F: Hypertension affecting chronic hepatitis B infection (upper panel) and chronic hepatitis C infection (lower panel). MR: Mendelian randomization.
- Citation: Liang LB, Liu XP, Mao TR, Su QL. Metabolic disorders and hepatitis: Insights from a Mendelian randomization study. World J Gastrointest Surg 2024; 16(6): 1775-1790
- URL: https://www.wjgnet.com/1948-9366/full/v16/i6/1775.htm
- DOI: https://dx.doi.org/10.4240/wjgs.v16.i6.1775


