Copyright
©The Author(s) 2024.
World J Gastrointest Surg. Feb 27, 2024; 16(2): 503-510
Published online Feb 27, 2024. doi: 10.4240/wjgs.v16.i2.503
Published online Feb 27, 2024. doi: 10.4240/wjgs.v16.i2.503
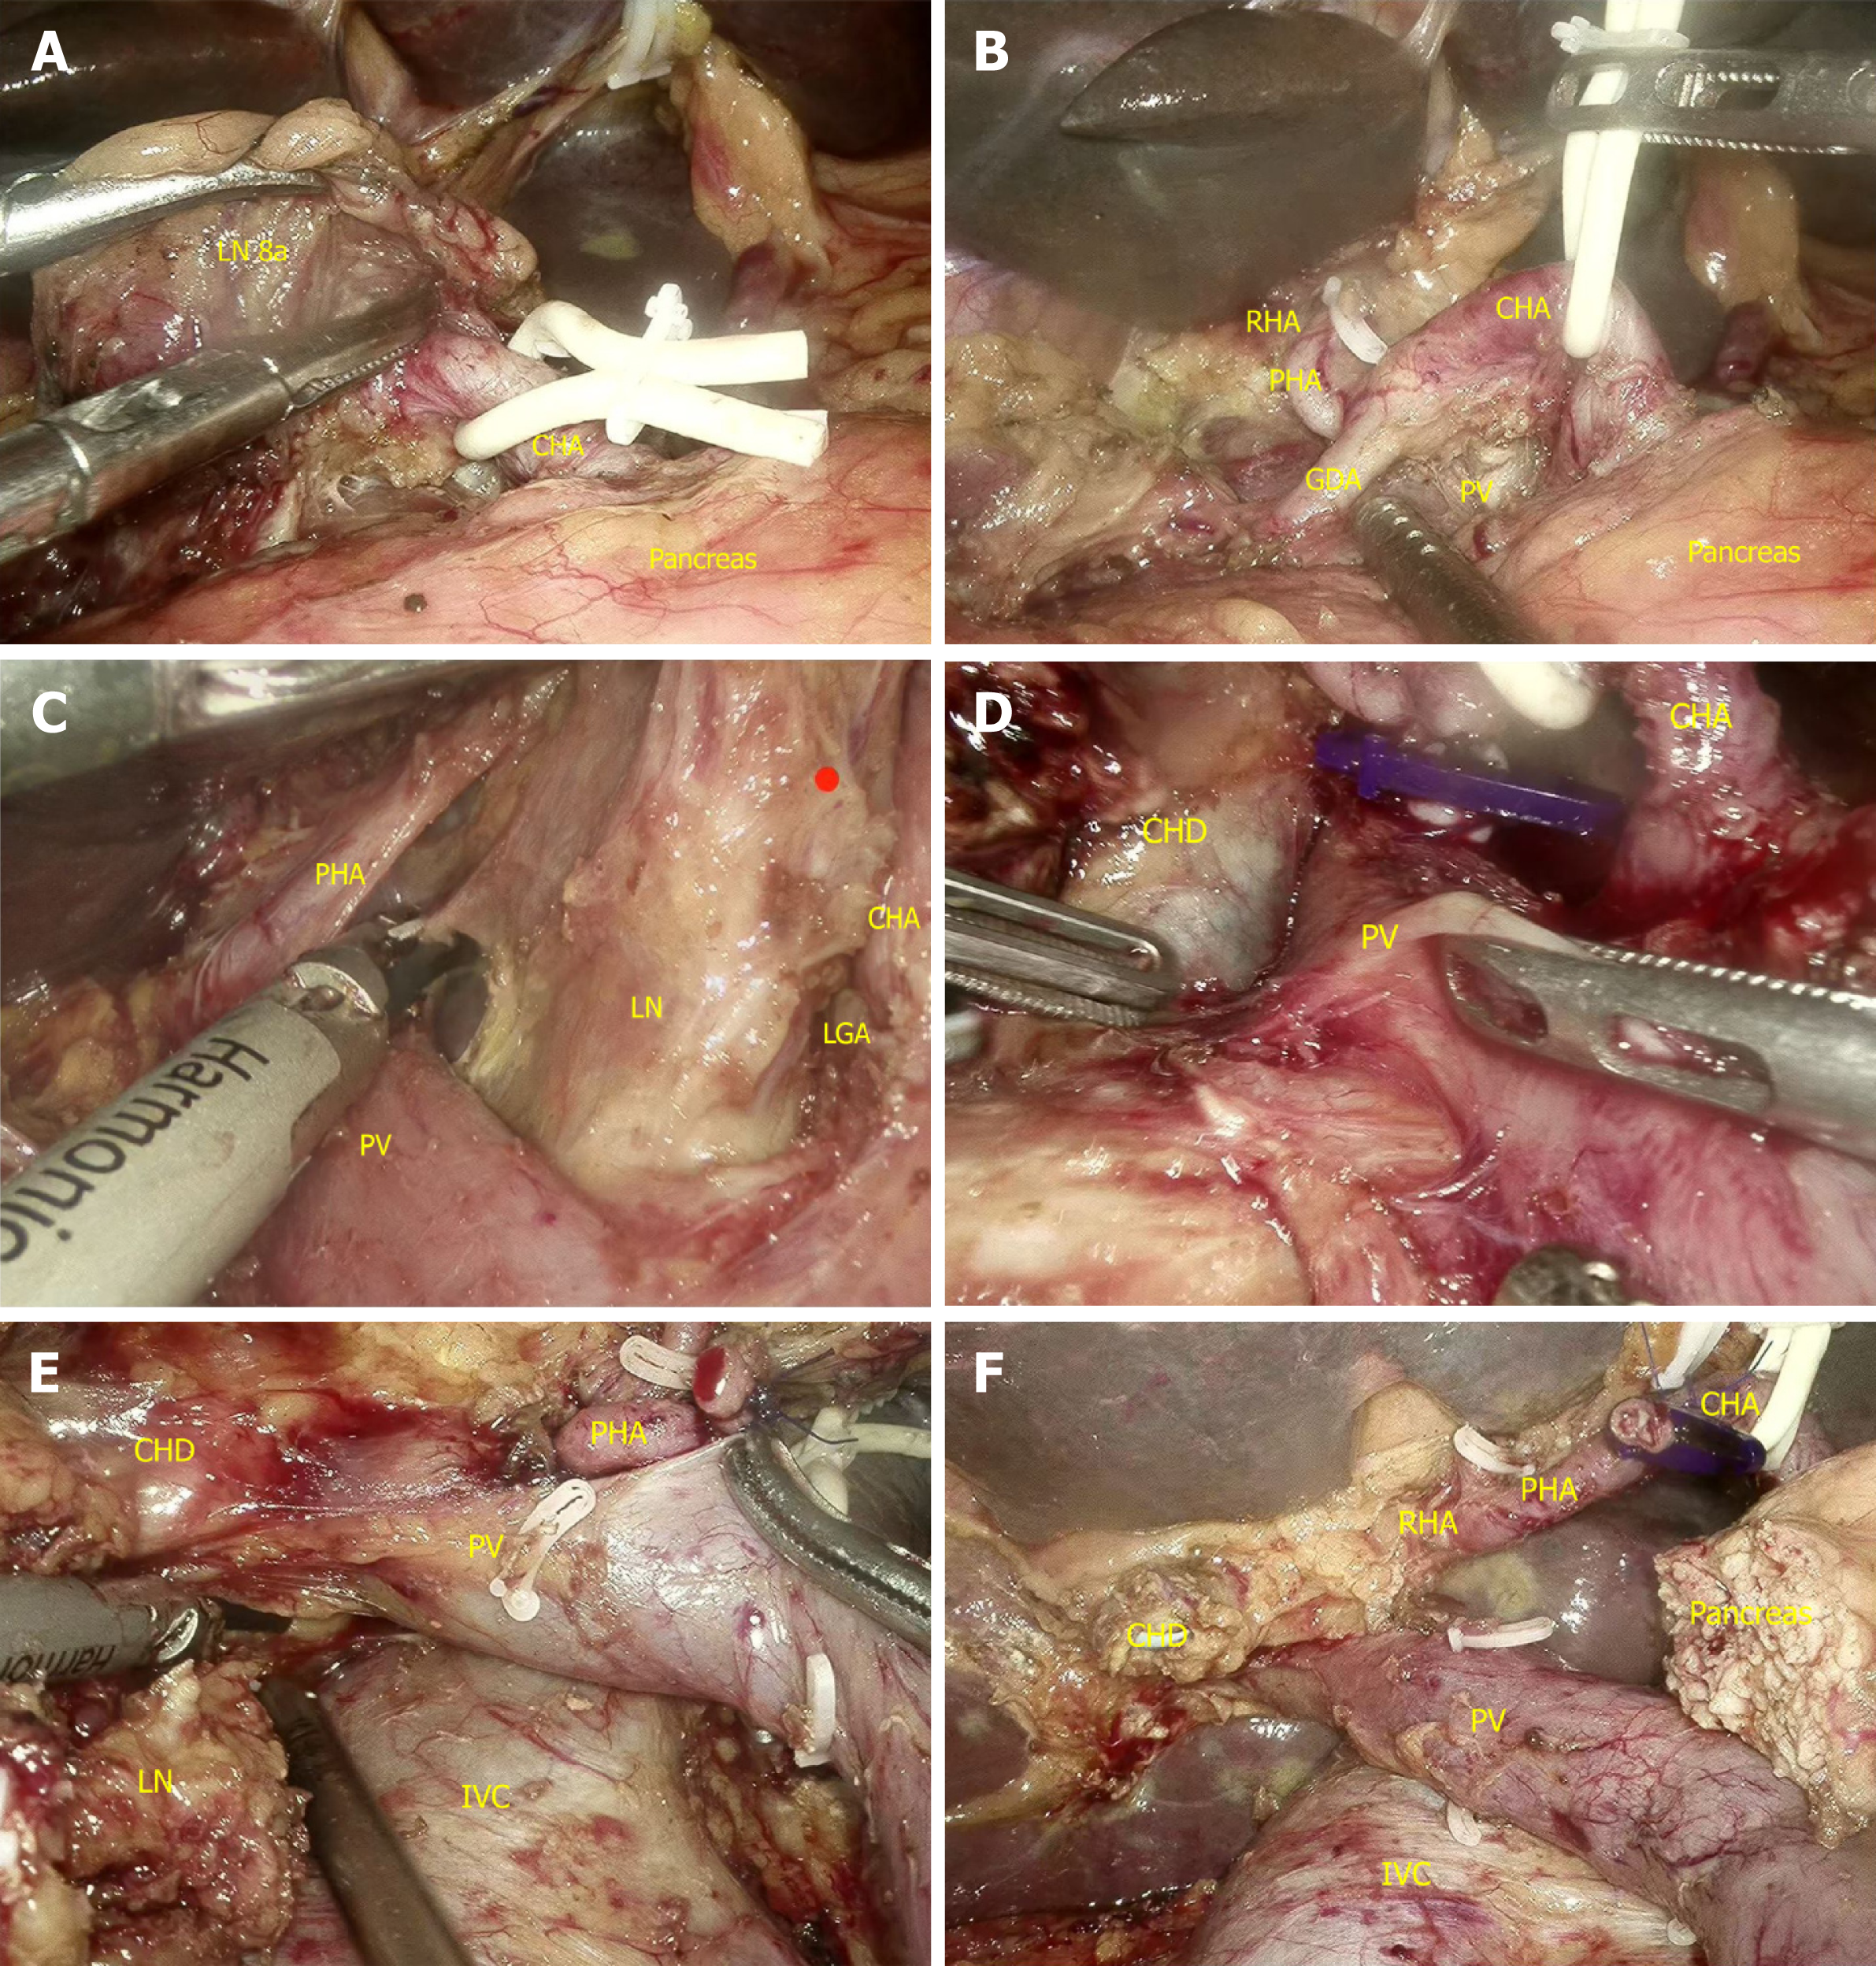
Figure 1 Visualization of the surgical fields after the completion of each surgical step via the five-step four-zone method.
A: The common hepatic artery was exposed and suspended along the No. 8a lymph node; B: The surgical field after the dissection of the upper zone of the hepatic artery (HA)/portal vein (PV) axis; C: The surgical field after the dissection of the left zone of the HA/PV axis; D: The surgical field after the dissection of the right zone of the HA/PV axis; E: The surgical field after the dissection of the lower zone of the HA/PV axis; F: The surgical field of the hepatic hilum region after the completion of the dissection. LN 8a: No. 8a lymph node; CHA: Common hepatic artery; GDA: Gastroduodenal artery; RHA: Right hepatic artey; PHA: Proper hepatic artery; LN: Lymph node; LGA: Left gastric artery; CHD: Common hepatic duct; IVC: Inferior vena cave.
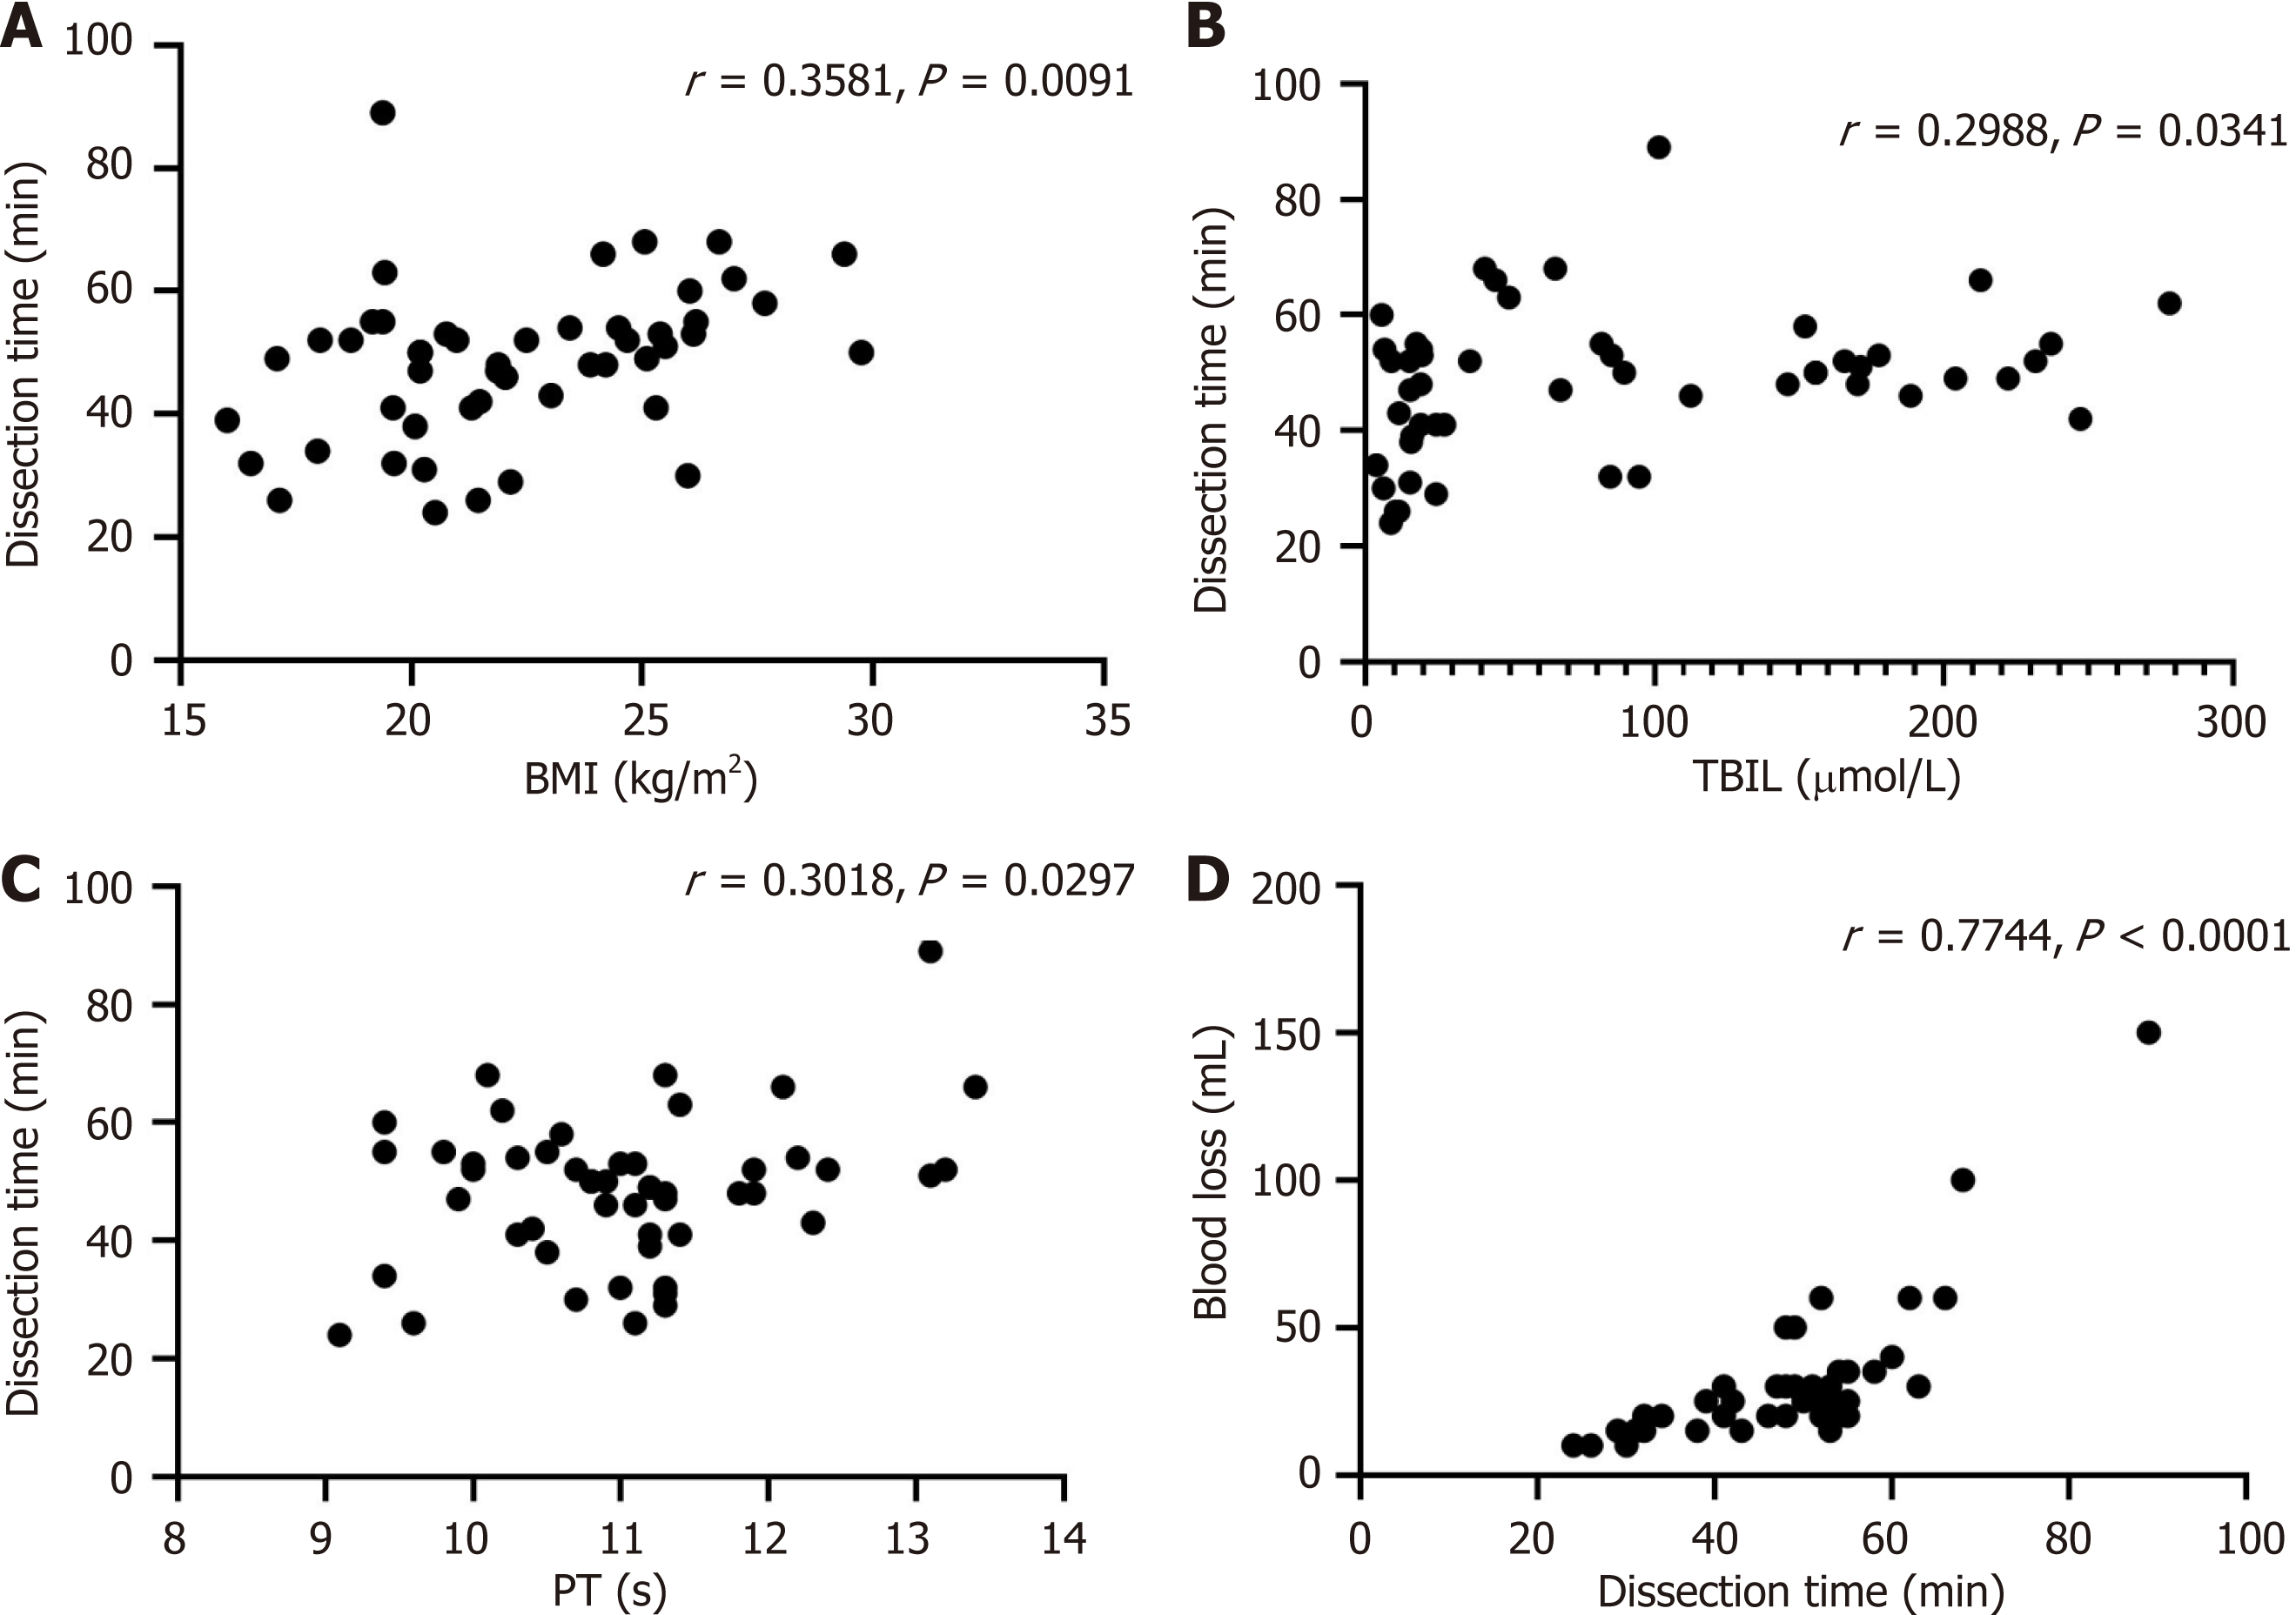
Figure 2 Correlations between body mass index, total bilirubin level, prothrombin time, blood loss and lymph node dissection time.
A: Body mass index; B: Total bilirubin; C: Prothrombin time; D: Blood loss. BMI: Body mass index; TBIL: Total bilirubin; PT: Prothrombin time.
Figure 3 The effects of body mass index and total bilirubin on lymph node dissection time.
A: Body mass index; B: Total bilirubin. aP < 0.05. BMI: Body mass index; TBIL: Total bilirubin.
- Citation: Hu XS, Wang Y, Pan HT, Zhu C, Chen SL, Liu HC, Pang Q, Jin H. "Five steps four quadrants" modularized en bloc dissection technique for accessing hepatic hilum lymph nodes in laparoscopic pancreaticoduodenectomy. World J Gastrointest Surg 2024; 16(2): 503-510
- URL: https://www.wjgnet.com/1948-9366/full/v16/i2/503.htm
- DOI: https://dx.doi.org/10.4240/wjgs.v16.i2.503


