Copyright
©The Author(s) 2024.
World J Gastrointest Surg. Dec 27, 2024; 16(12): 3818-3834
Published online Dec 27, 2024. doi: 10.4240/wjgs.v16.i12.3818
Published online Dec 27, 2024. doi: 10.4240/wjgs.v16.i12.3818
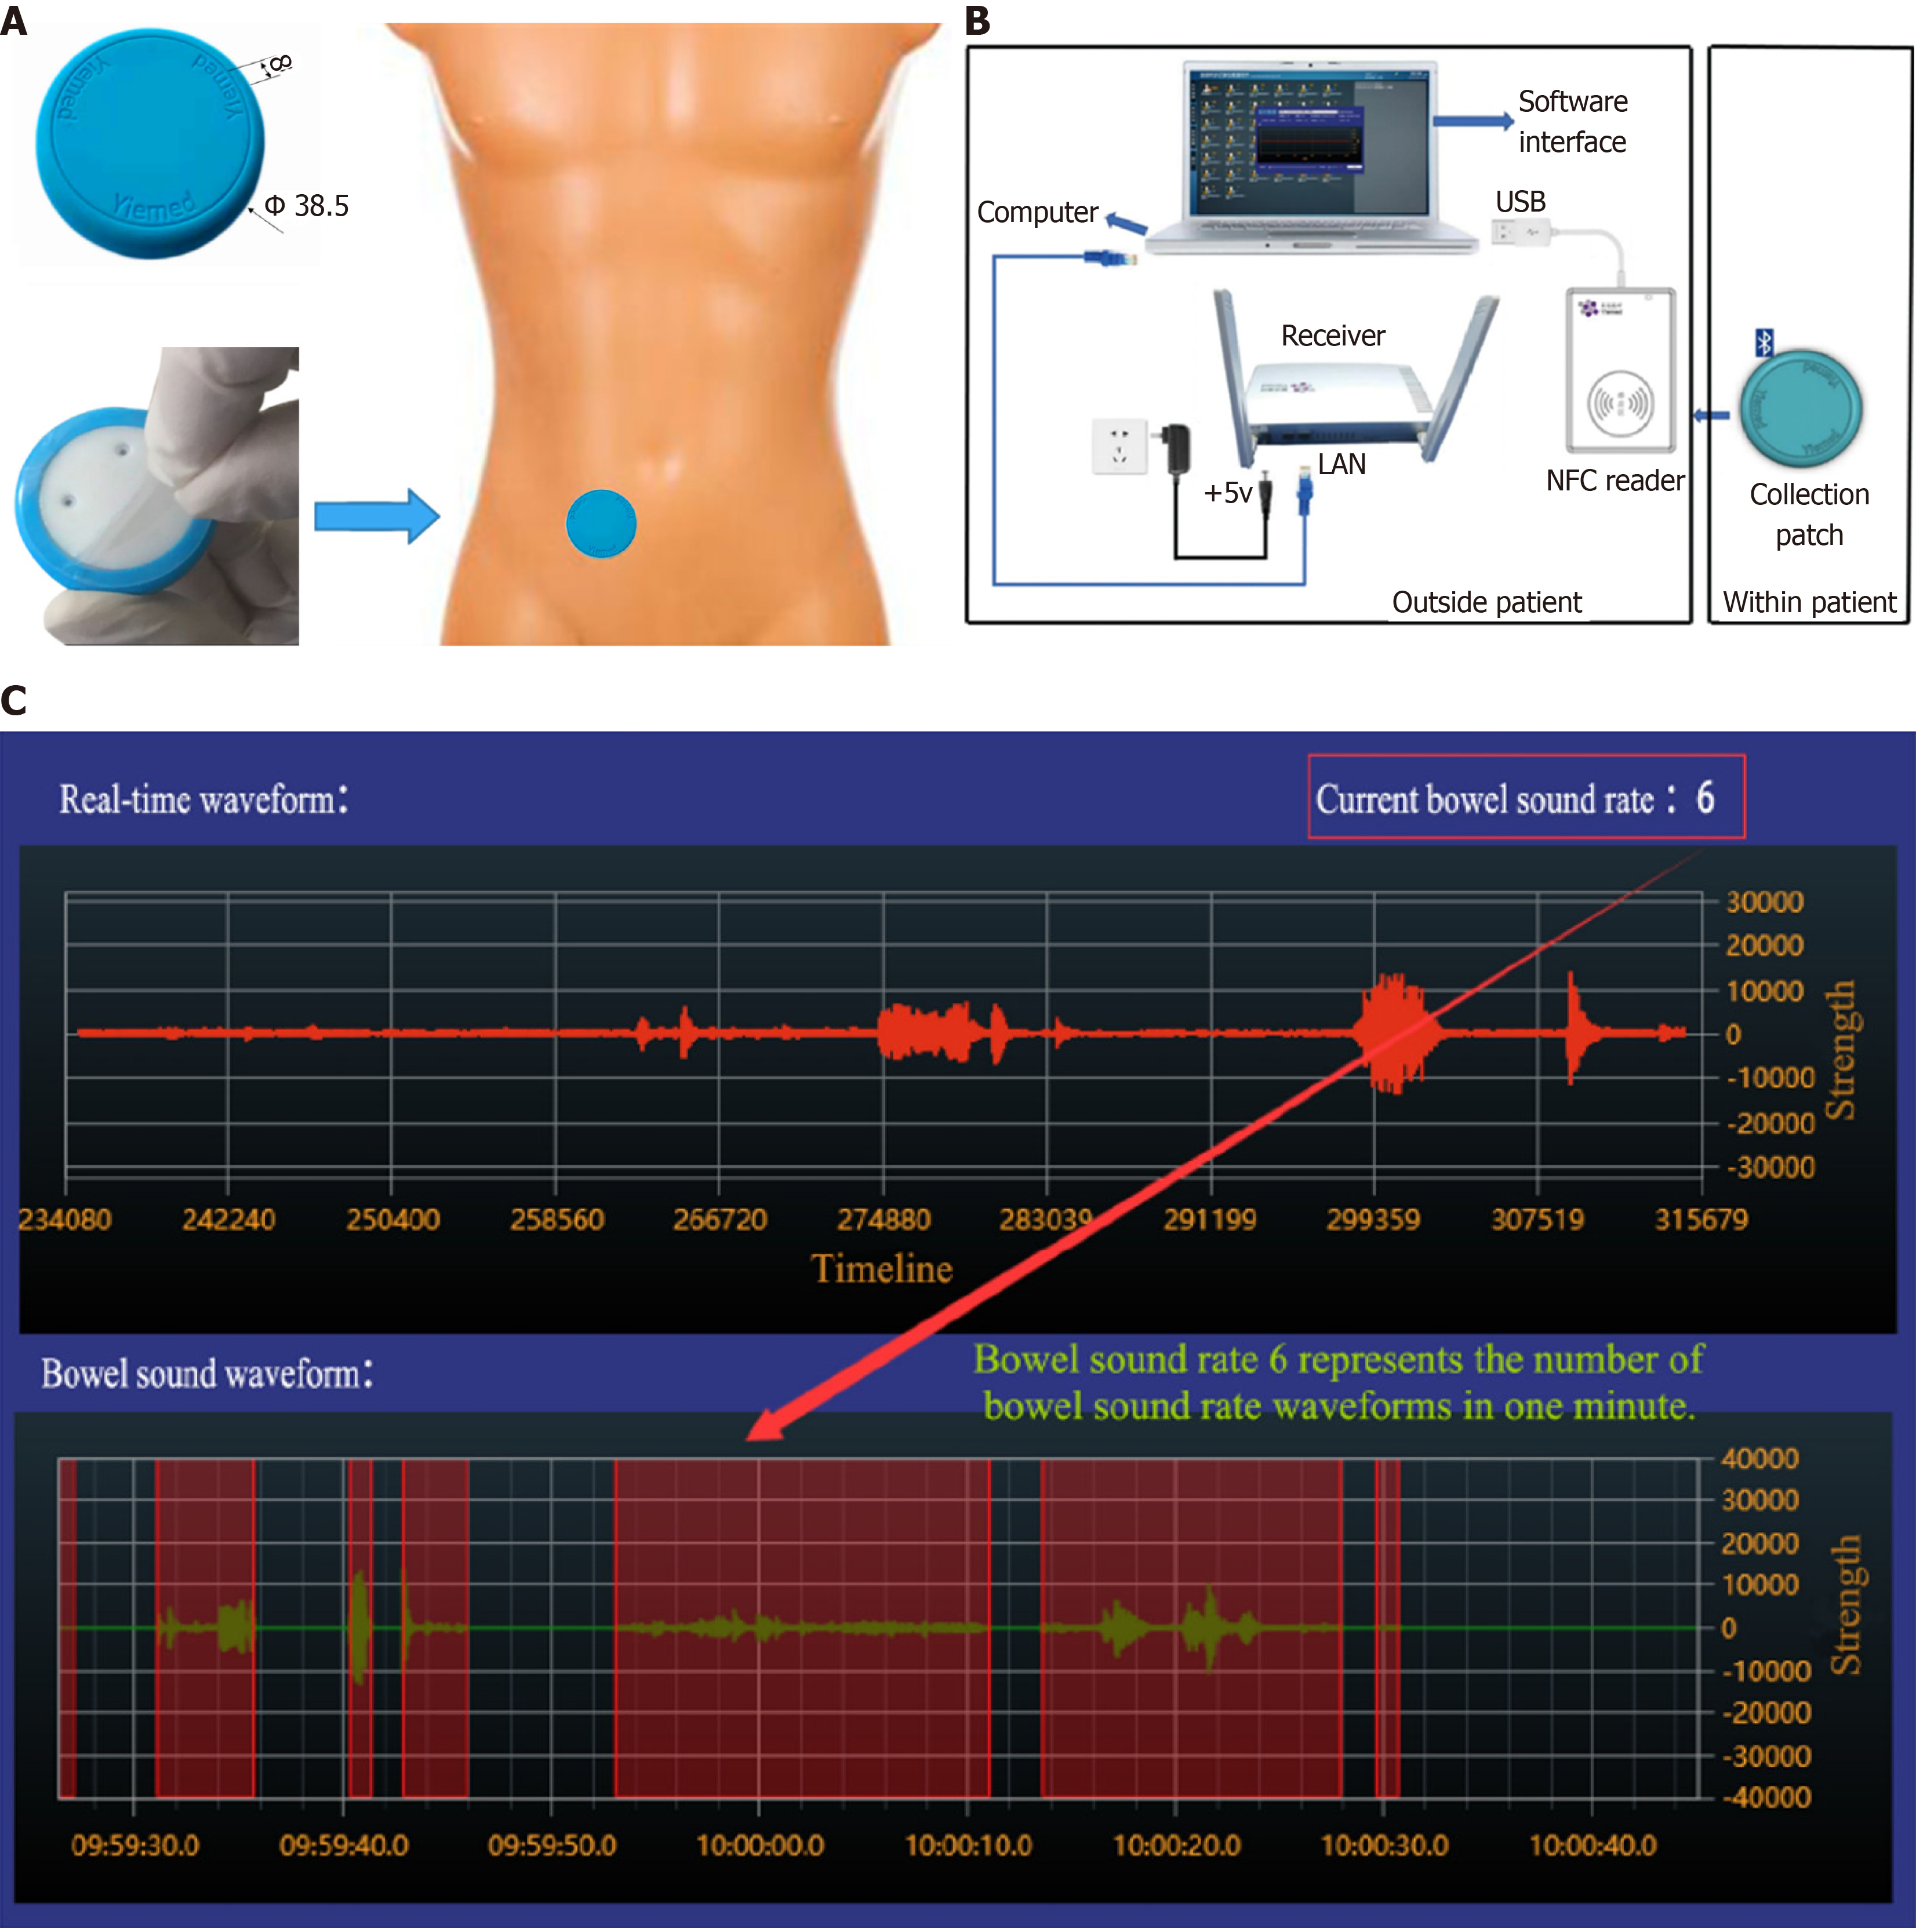
Figure 1 Continuous auscultation recorder (from operating instructions and technical instructions of continuous auscultation recorder).
A: The structure of the collection patch and its use site; B: Schematic of the working principle; C: Sound collection.
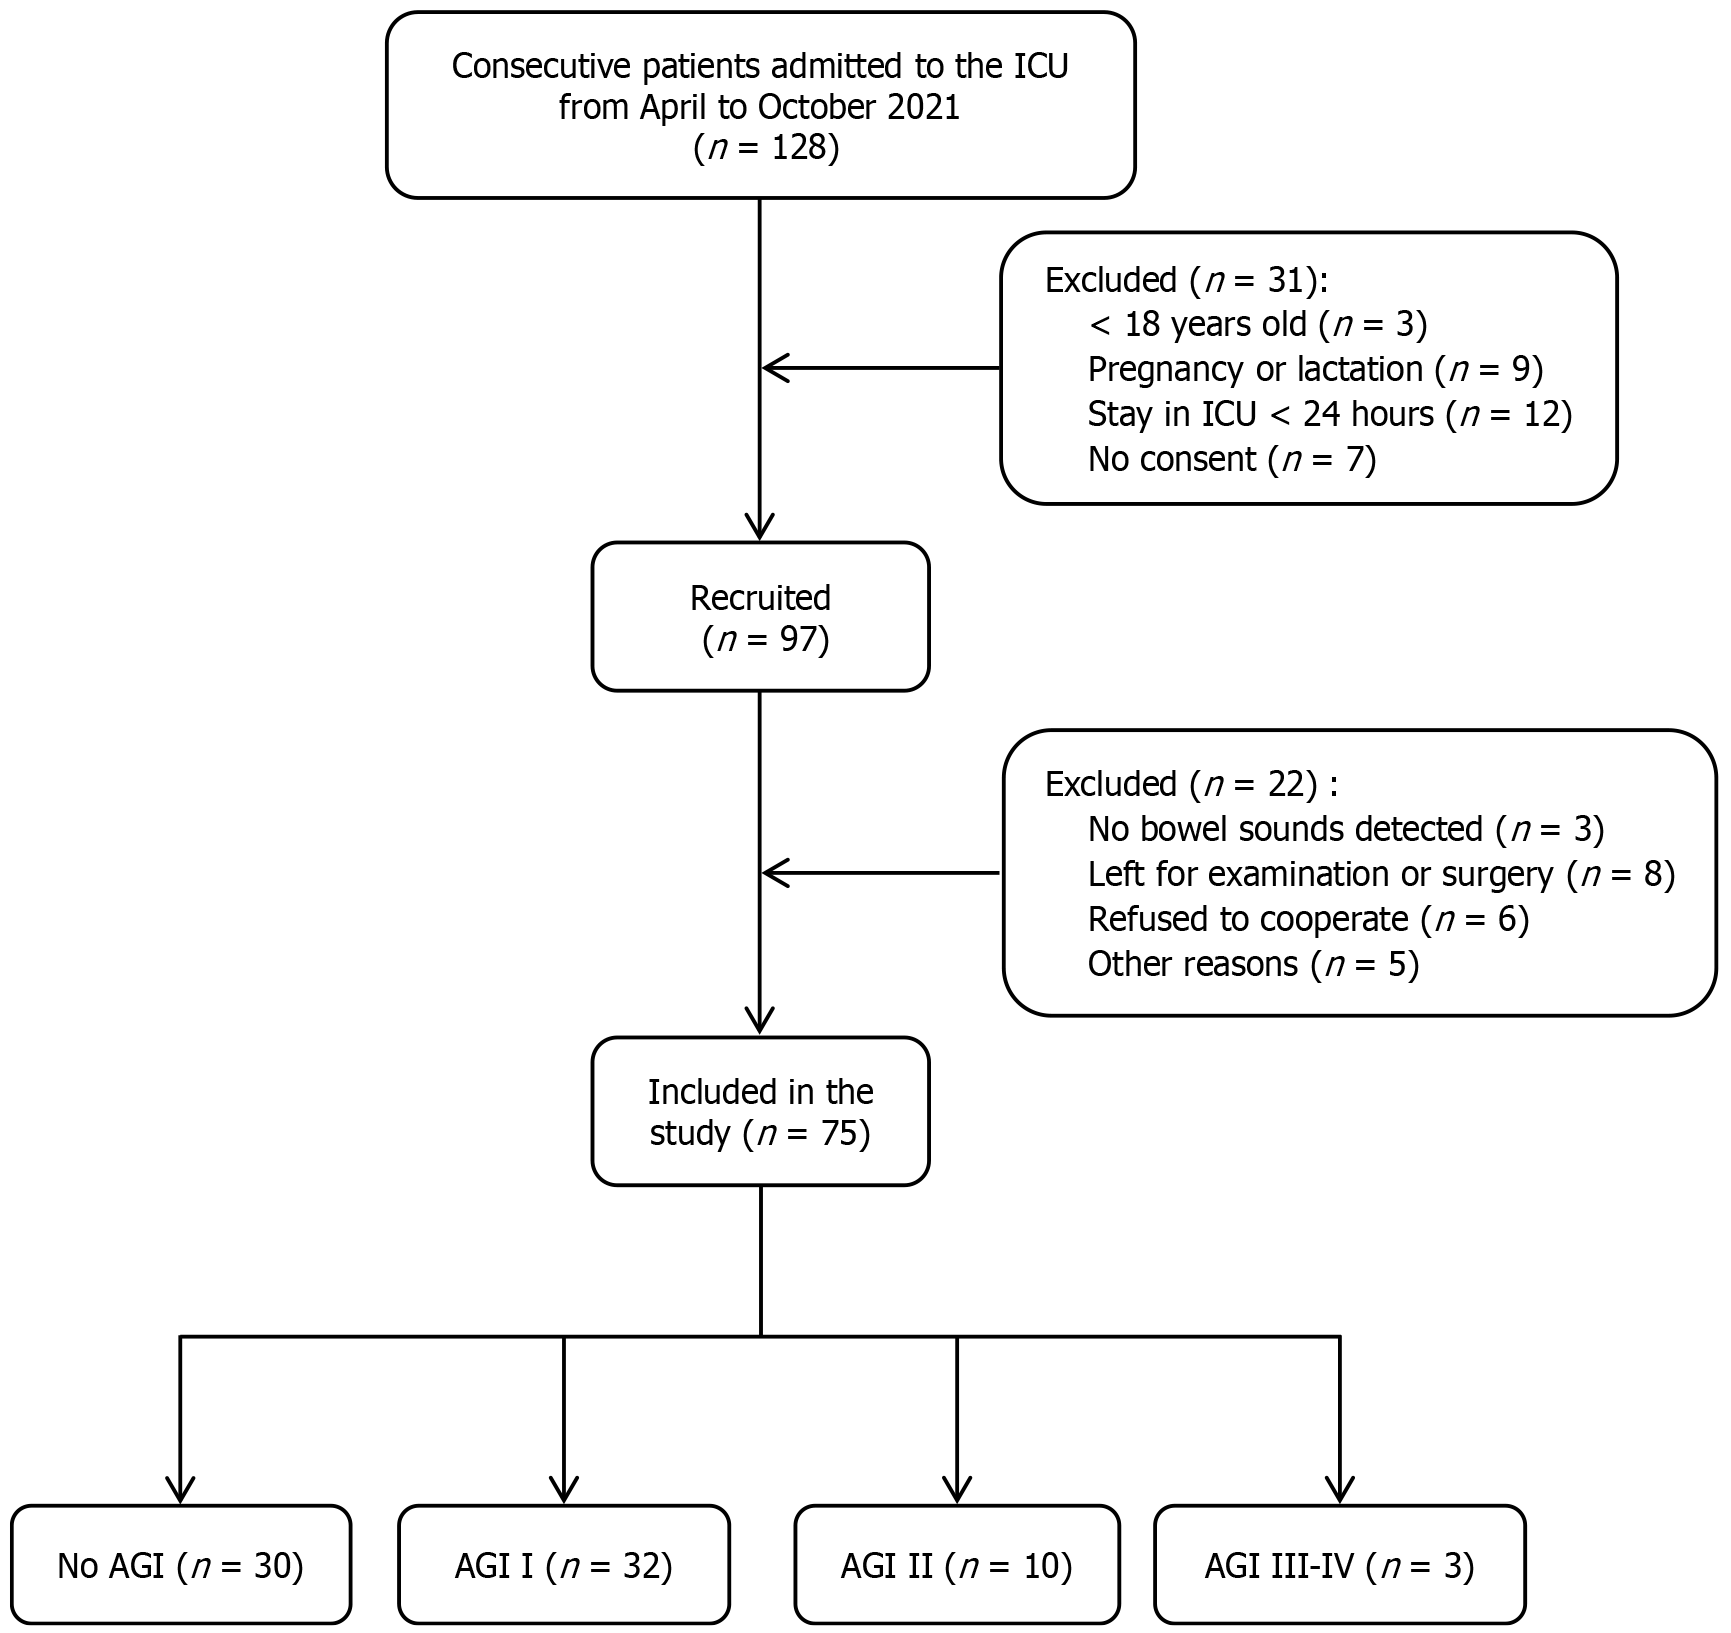
Figure 2 Enrolment flowchart for study participants.
ICU: Intensive care unit; AGI: Acute gastrointestinal injury.
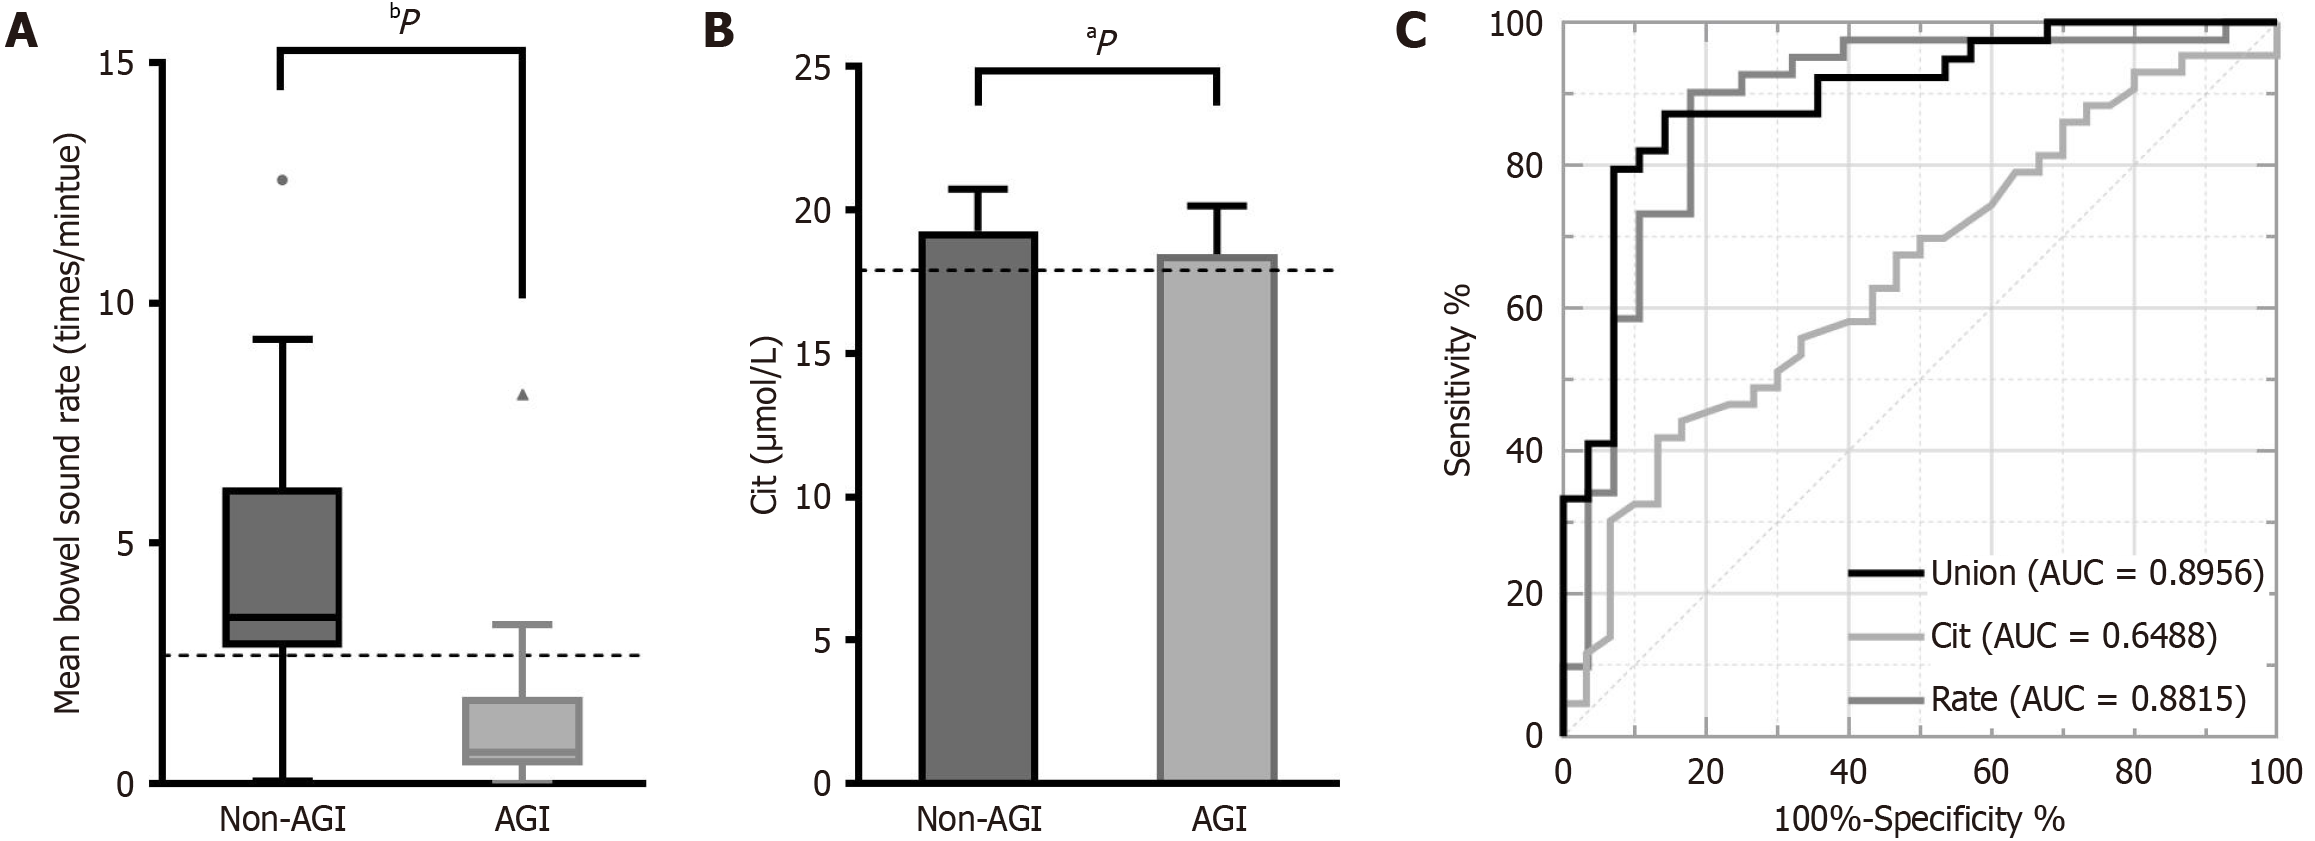
Figure 3 Area under the receiver operating characteristic curve.
A: Shows a significant difference in mean bowel sound rate between the acute gastrointestinal injury (AGI) and non-AGI groups, P < 0.0001; B: Shows a significant difference in citrulline (Cit) level between the AGI and non-AGI groups, P = 0.0337; C: The area under the receiver operating characteristic (ROC) curve of the mean bowel sound rate is 0.8815. The area under the ROC curve of Cit is 0.6488. The critical values are 17.91 μmol/L and 2.665 counts per minute, respectively, as indicated by the dotted lines in A and B. The area under the ROC curve of the mean bowel sound rate combined with Cit level is 0.8956. Cit: Citrulline; Union: Mean bowel sound rate combined with citrulline level; Rate: Mean bowel sound rate; AUC: Area under the curve; AGI: Acute gastrointestinal injury. aP < 0.05, bP < 0.01 vs non-AGI.
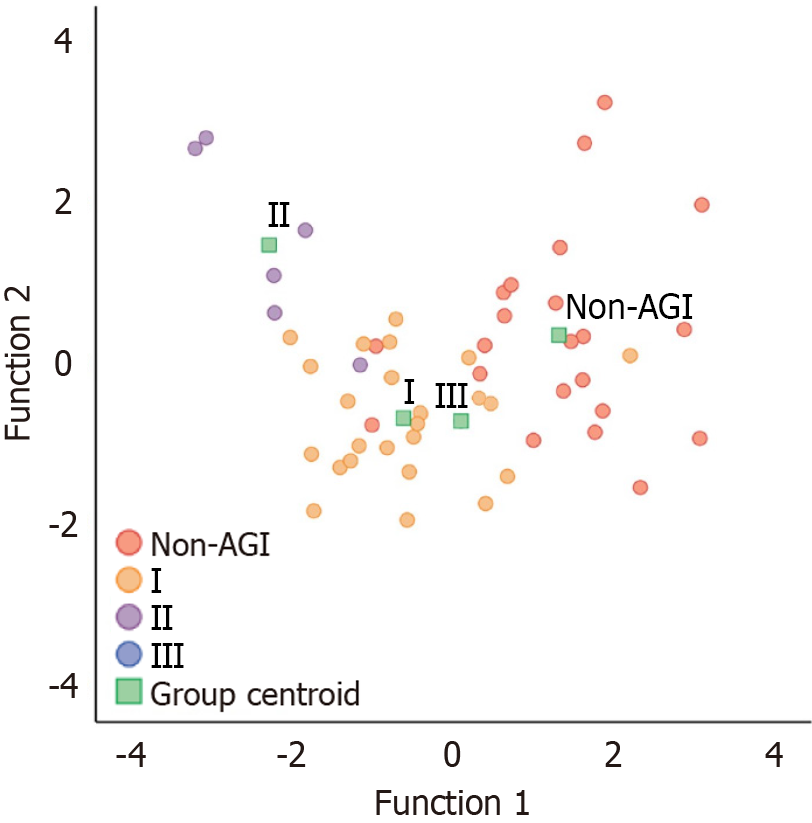
Figure 4 Canonical discriminant function.
Various observation indicators of acute gastrointestinal injury (AGI) to be evaluated are substituted into the following two discriminant functions; the AGI class to which the AGI being assessed belongs can be determined by identifying the group centroid closest to the obtained (Y1, Y2). I, II, III, and non-AGI are the AGI I group, AGI II group, AGI III group, and non-AGI group, respectively. AGI: Acute gastrointestinal injury.
- Citation: Sun YH, Song YY, Sha S, Sun Q, Huang DC, Gao L, Li H, Shi QD. Diagnostic value of digital continuous bowel sounds in critically ill patients with acute gastrointestinal injury: A prospective observational study. World J Gastrointest Surg 2024; 16(12): 3818-3834
- URL: https://www.wjgnet.com/1948-9366/full/v16/i12/3818.htm
- DOI: https://dx.doi.org/10.4240/wjgs.v16.i12.3818


