Copyright
©The Author(s) 2024.
World J Gastrointest Surg. Dec 27, 2024; 16(12): 3794-3805
Published online Dec 27, 2024. doi: 10.4240/wjgs.v16.i12.3794
Published online Dec 27, 2024. doi: 10.4240/wjgs.v16.i12.3794
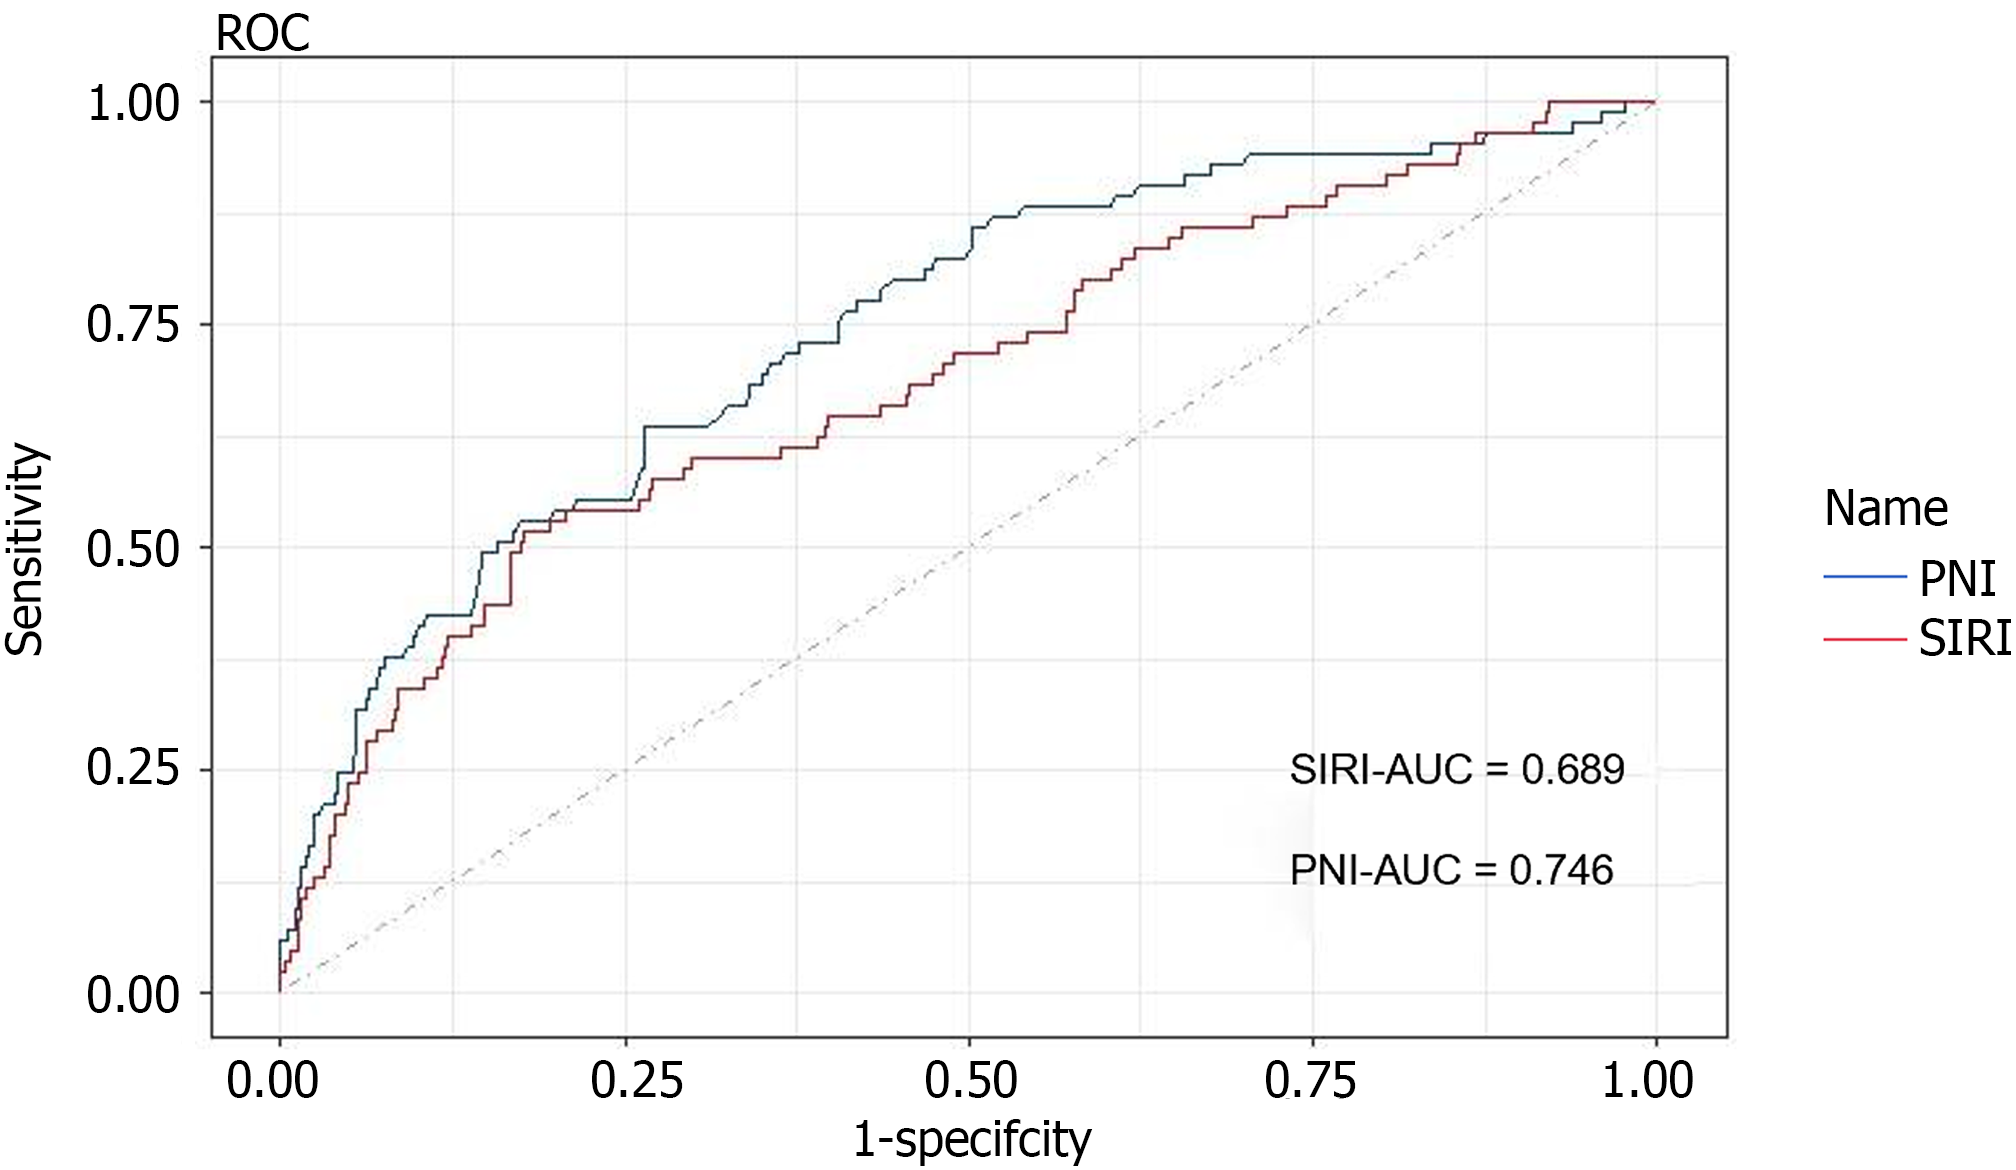
Figure 1 Area under the receiver operating characteristic curve of prognostic nutritional index and systemic inflammation response index.
PNI: Prognostic nutritional index; SIRI: Systemic inflammation response index; ROC: Receiver operating characteristic; AUC: Area under receiver operating characteristic curve.
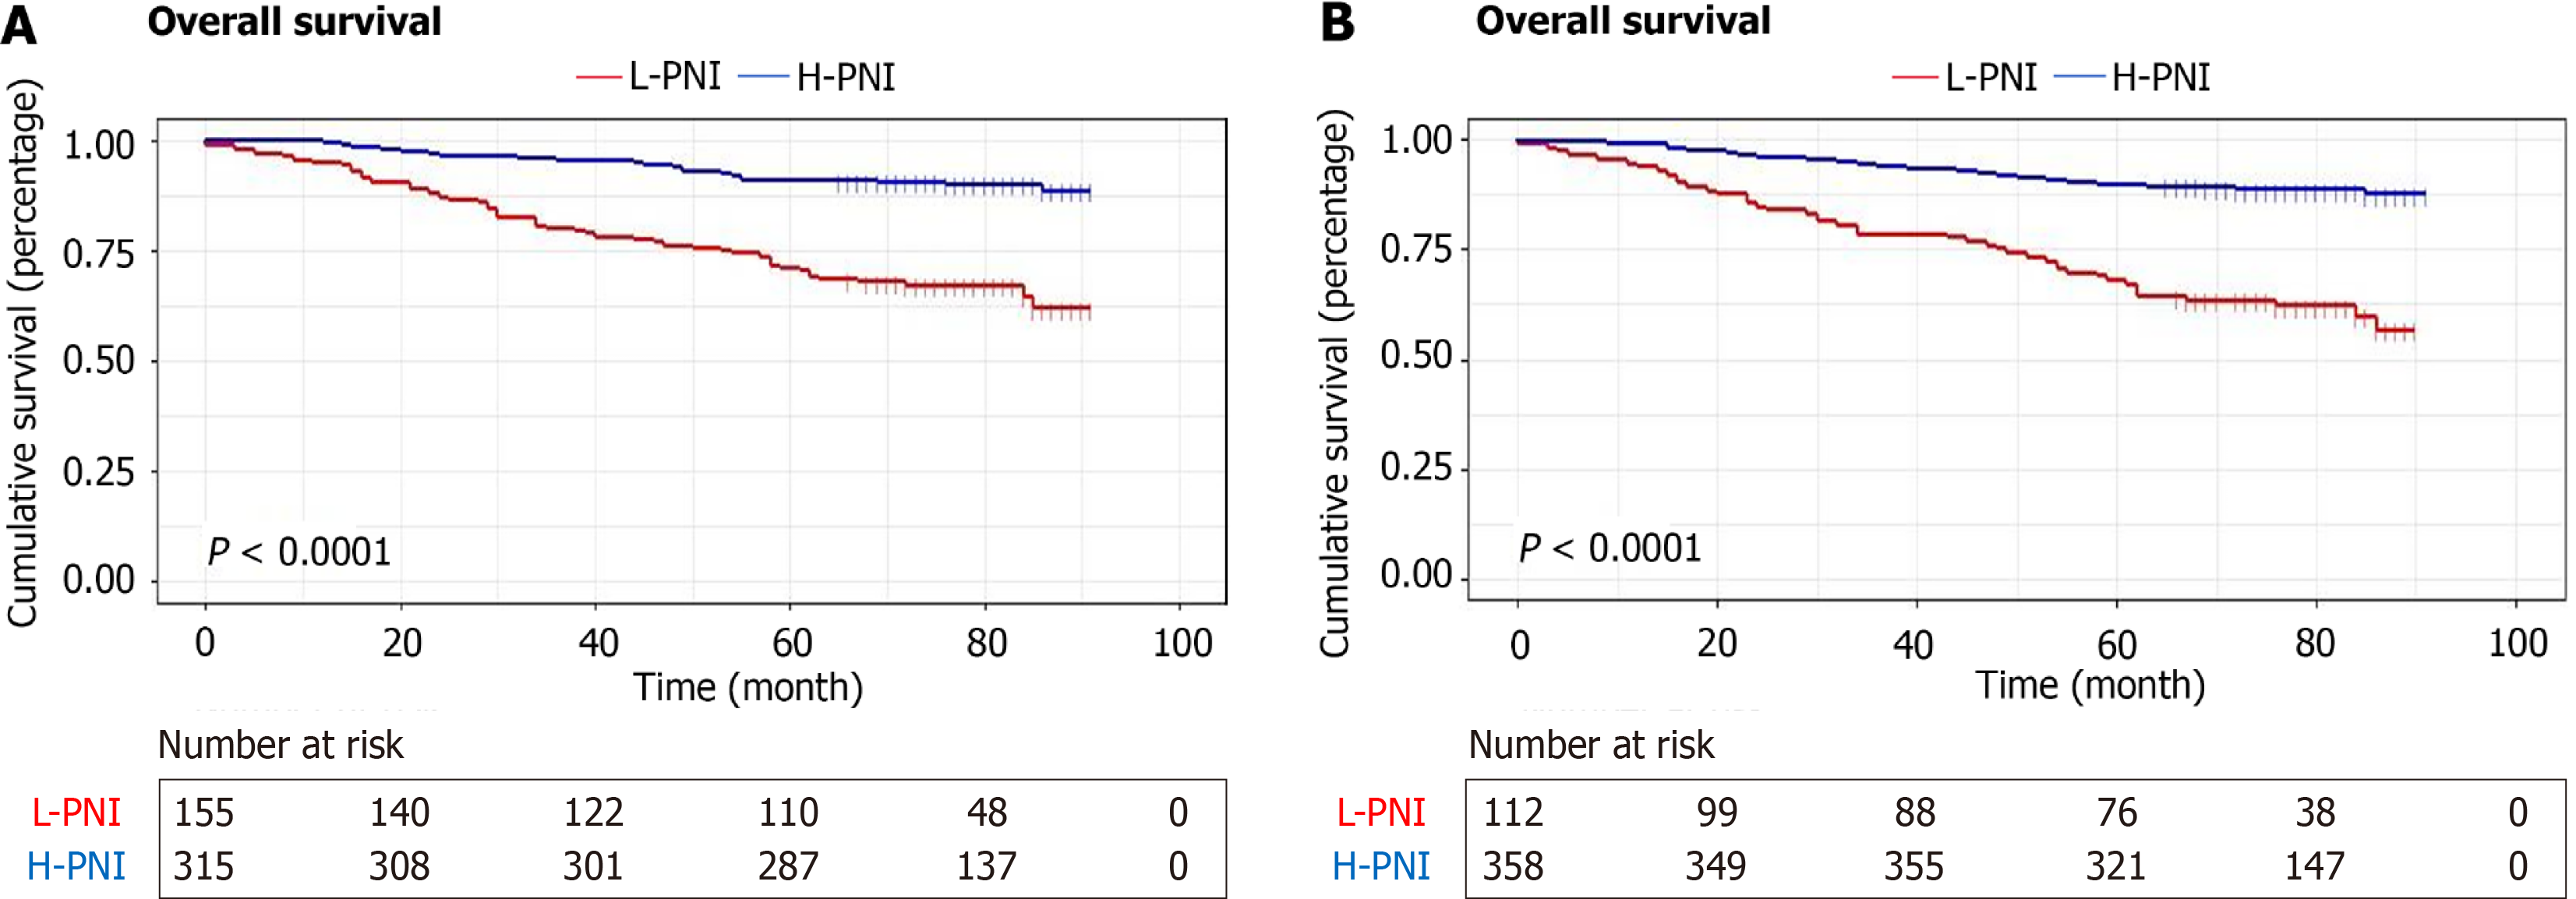
Figure 2 Cox regression analysis of prognostic nutritional index and systemic inflammation response index associated with overall survival.
A: Prognostic nutritional index; B: Systemic inflammation response index. L-PNI: Low-prognostic nutritional index; H-PNI: High-prognostic nutritional index; SIRI: Systemic inflammation response index.
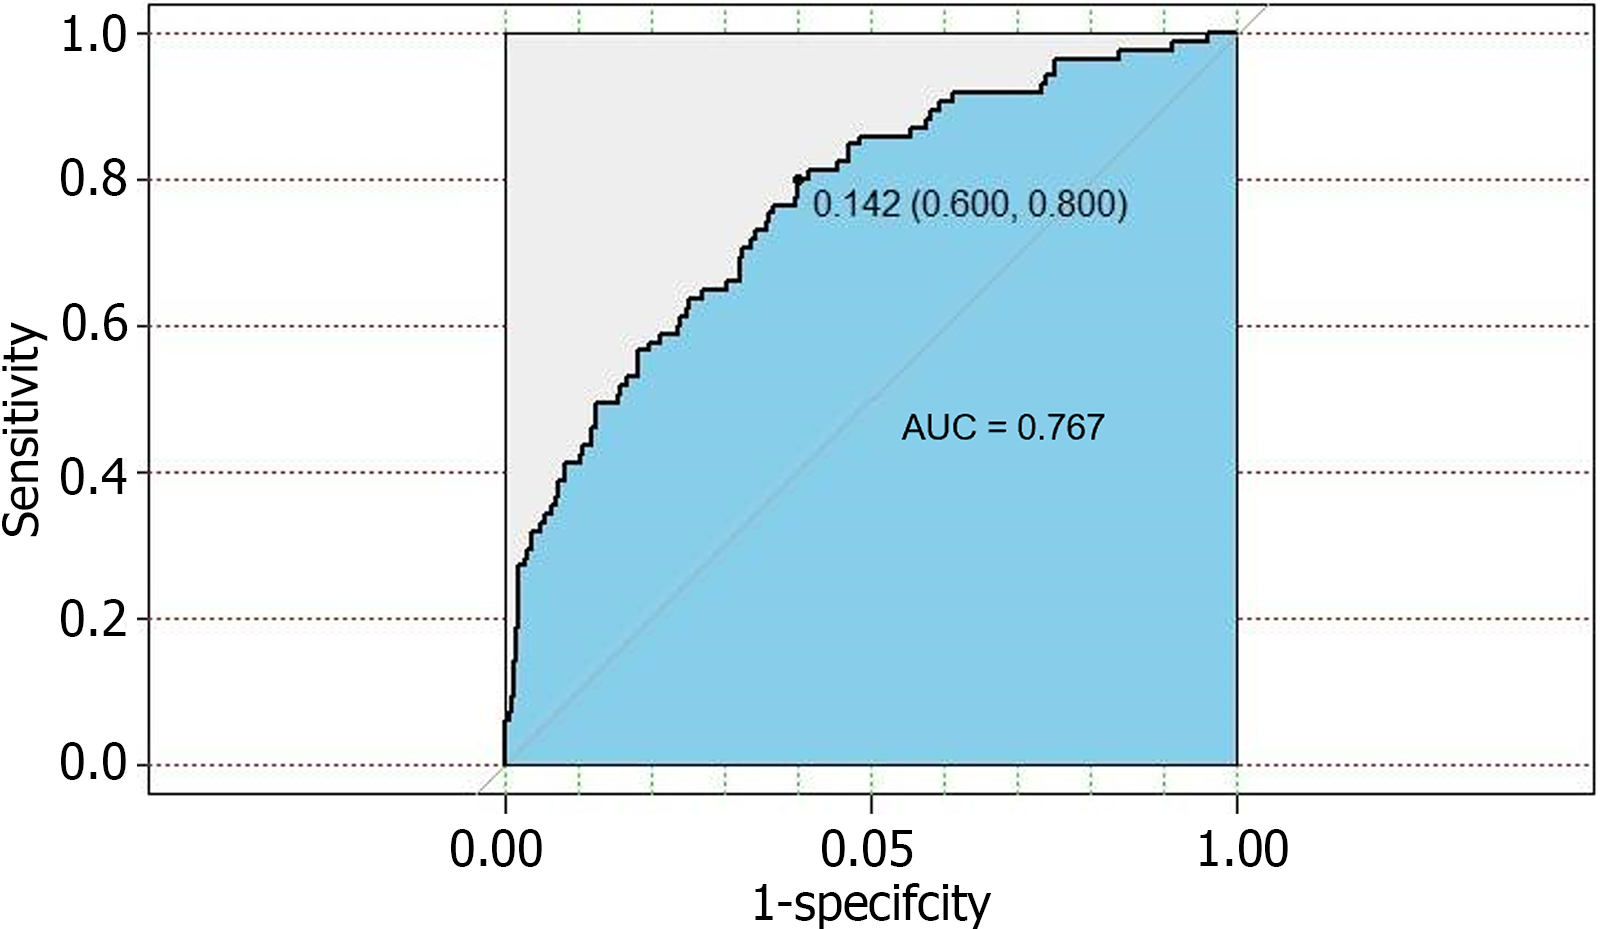
Figure 3 Area under the receiver operating characteristic curve of PSIRI and optimal cutoff values.
AUC: Area under receiver operating characteristic curve.
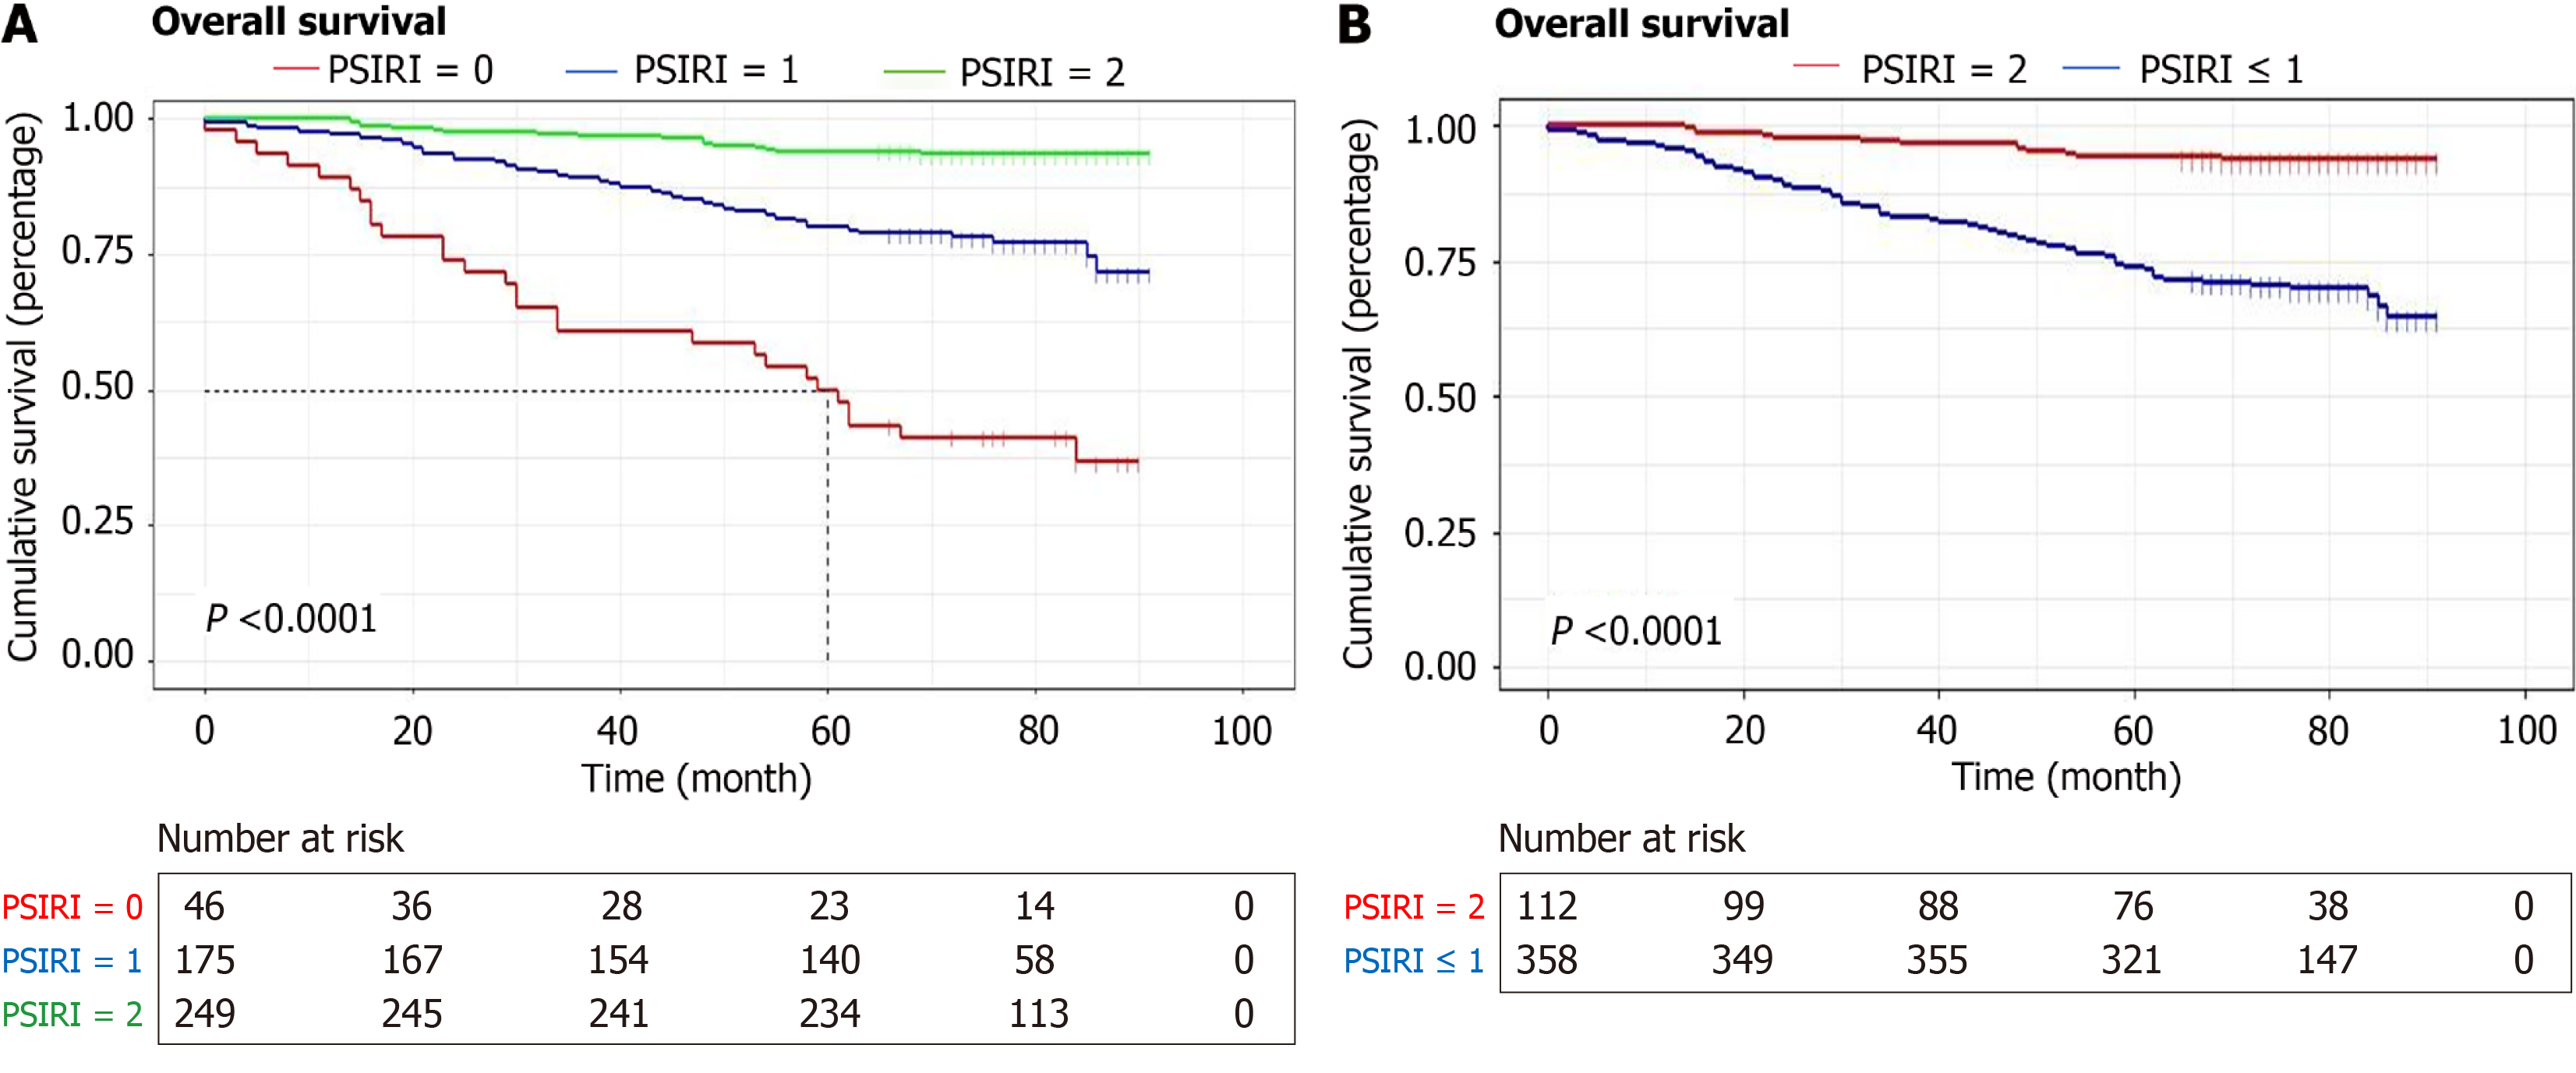
Figure 4 Kaplan–Meier curves for overall survival of PSIRI.
A: Categorized by PSIRI = 0, 1, 2; B: Categorized by PSIRI = 1, 2.
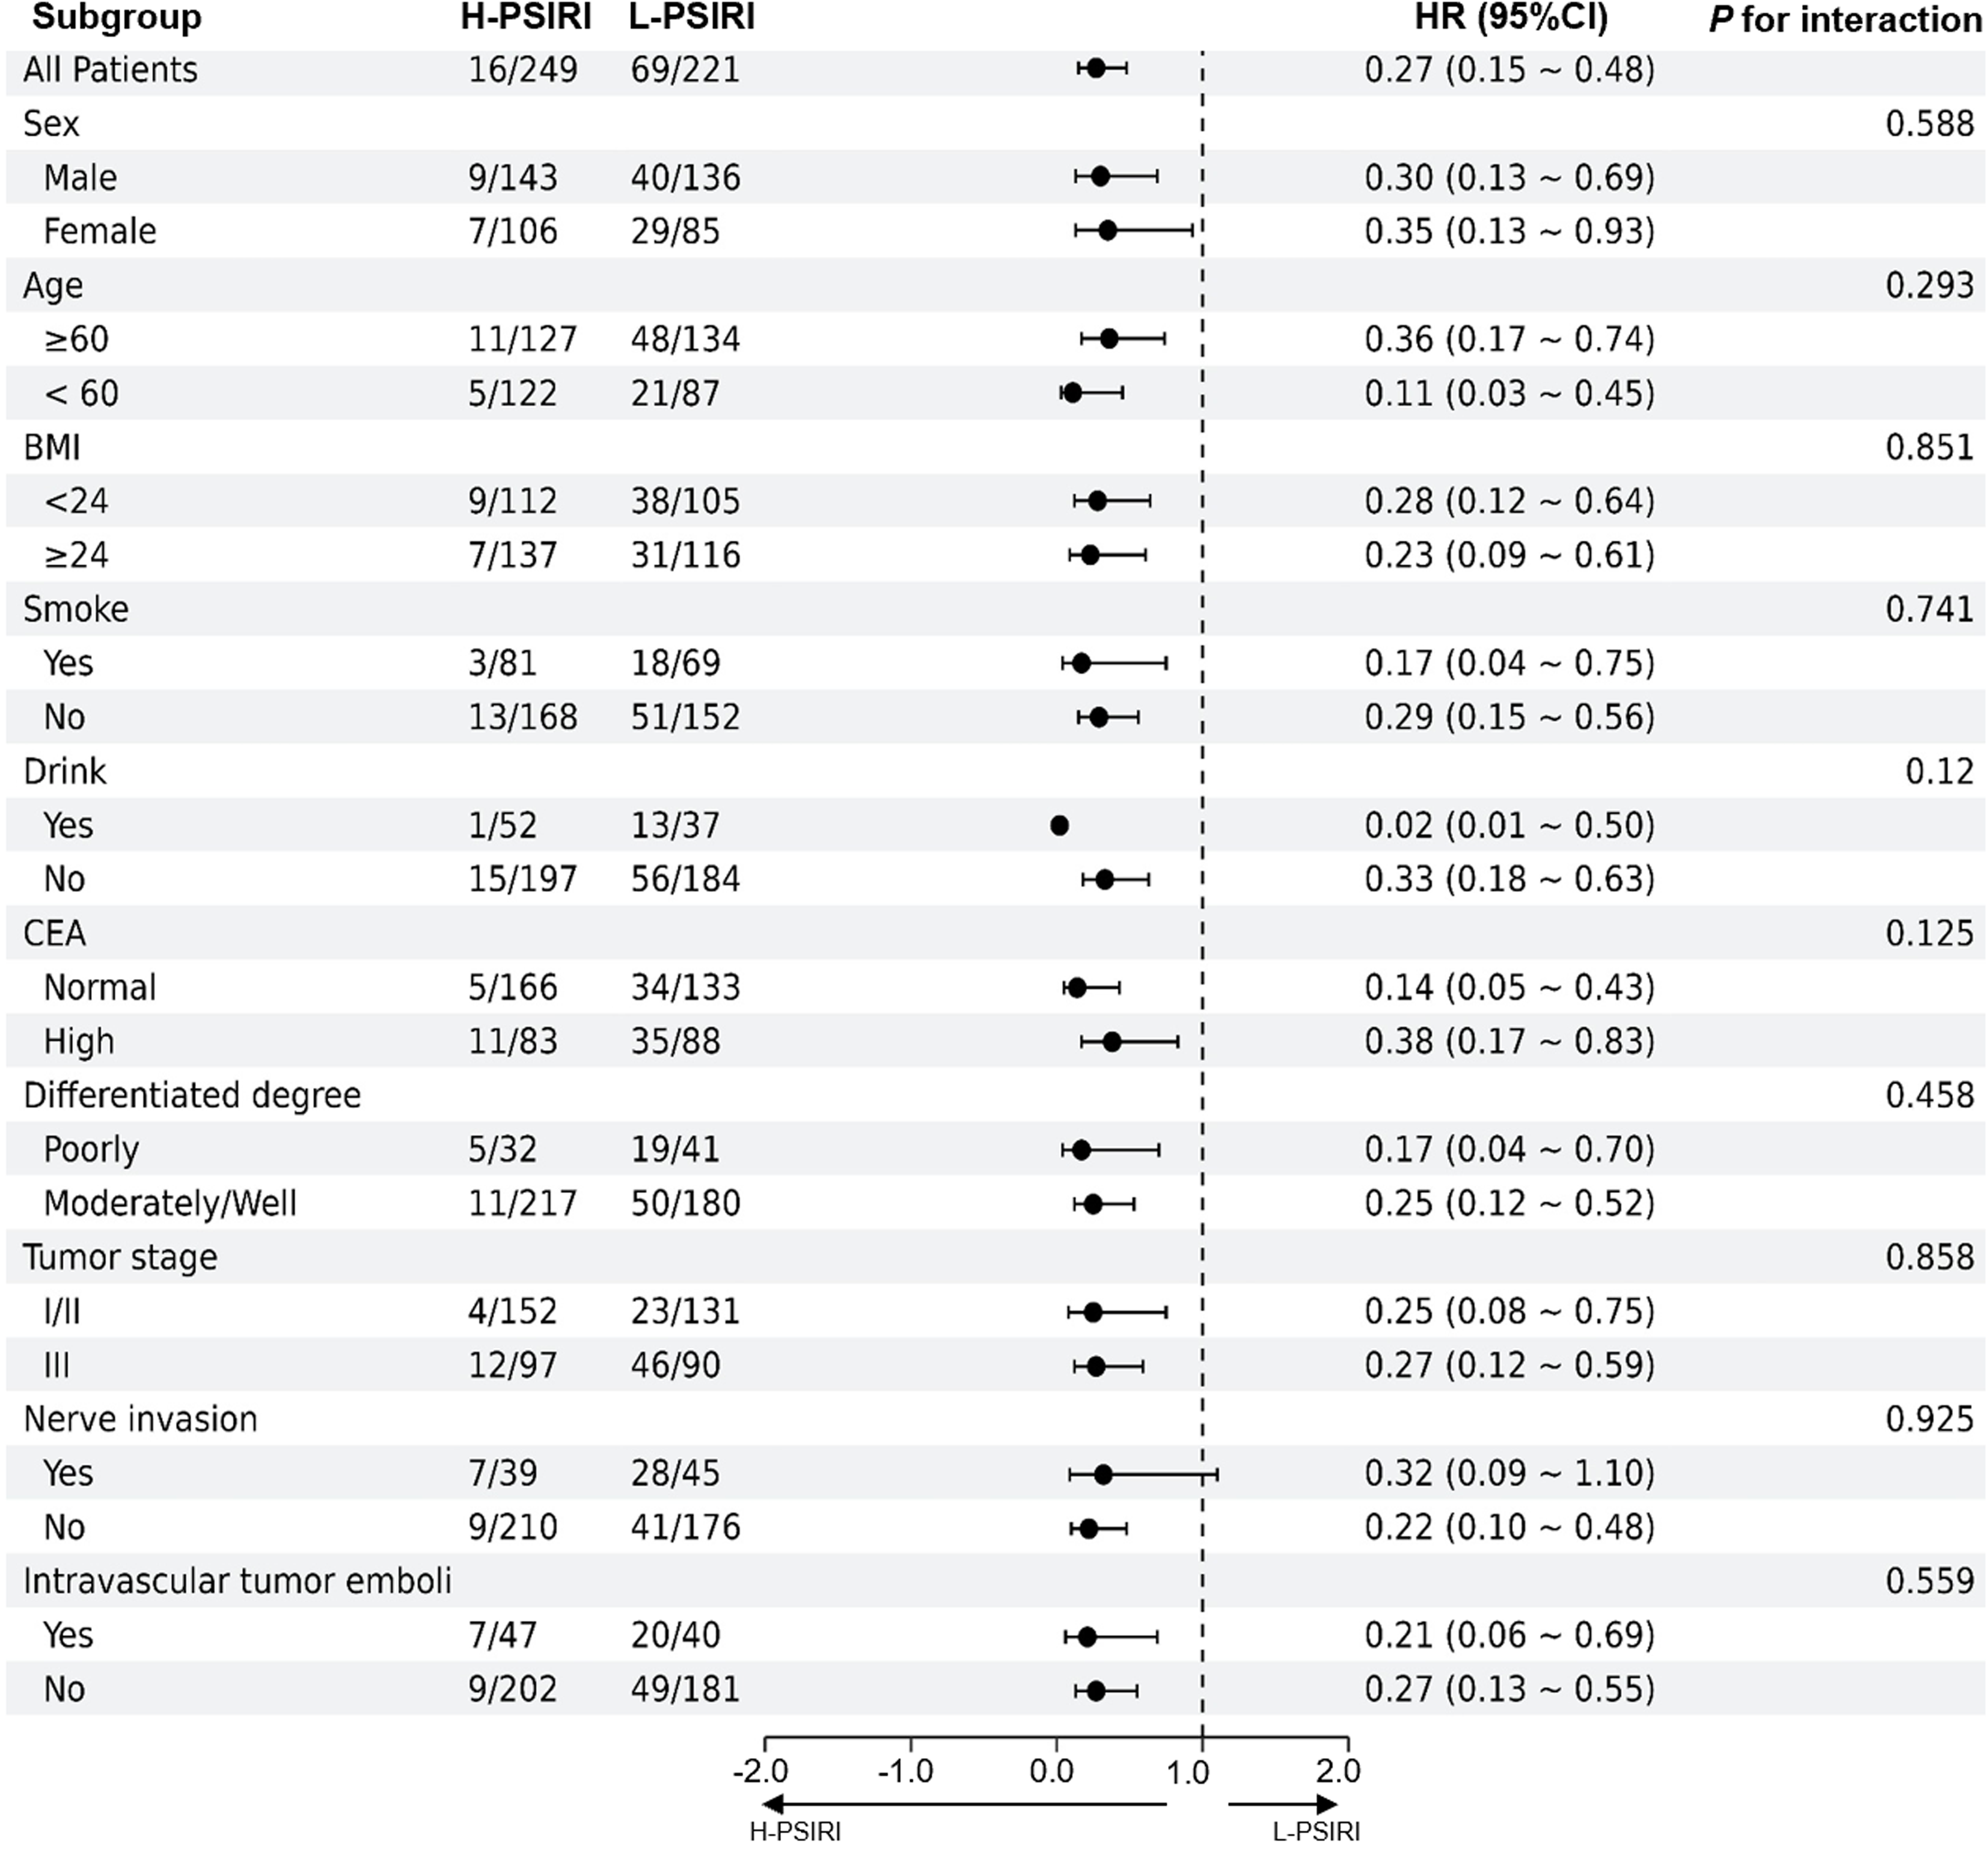
Figure 5 Stratification analysis of PSIRI in colorectal cancer.
Adjusted for age, gender, BMI, smoke, drink, T stage, N stage, tumor stage, differentiated degree, nerve invasion, intravascular tumor emboli, carcinoembryonic antigen, neutrophil to lymphocyte ratio, monocyte to lymphocyte ratio, and platelet-to-lymphocyte ratio. SIRI: Systemic inflammation response index; BMI: Body mass index; CEA: Carcinoembryonic antigen; 95%CI: 95% confidence interval; HR: Hazard ratio.
- Citation: Li KJ, Zhang ZY, Sulayman S, Shu Y, Wang K, Ababaike S, Zeng XY, Zhao ZL. Prognostic value of combined systemic inflammation response index and prognostic nutritional index in colorectal cancer patients. World J Gastrointest Surg 2024; 16(12): 3794-3805
- URL: https://www.wjgnet.com/1948-9366/full/v16/i12/3794.htm
- DOI: https://dx.doi.org/10.4240/wjgs.v16.i12.3794


