Copyright
©The Author(s) 2024.
World J Gastrointest Surg. Dec 27, 2024; 16(12): 3729-3736
Published online Dec 27, 2024. doi: 10.4240/wjgs.v16.i12.3729
Published online Dec 27, 2024. doi: 10.4240/wjgs.v16.i12.3729
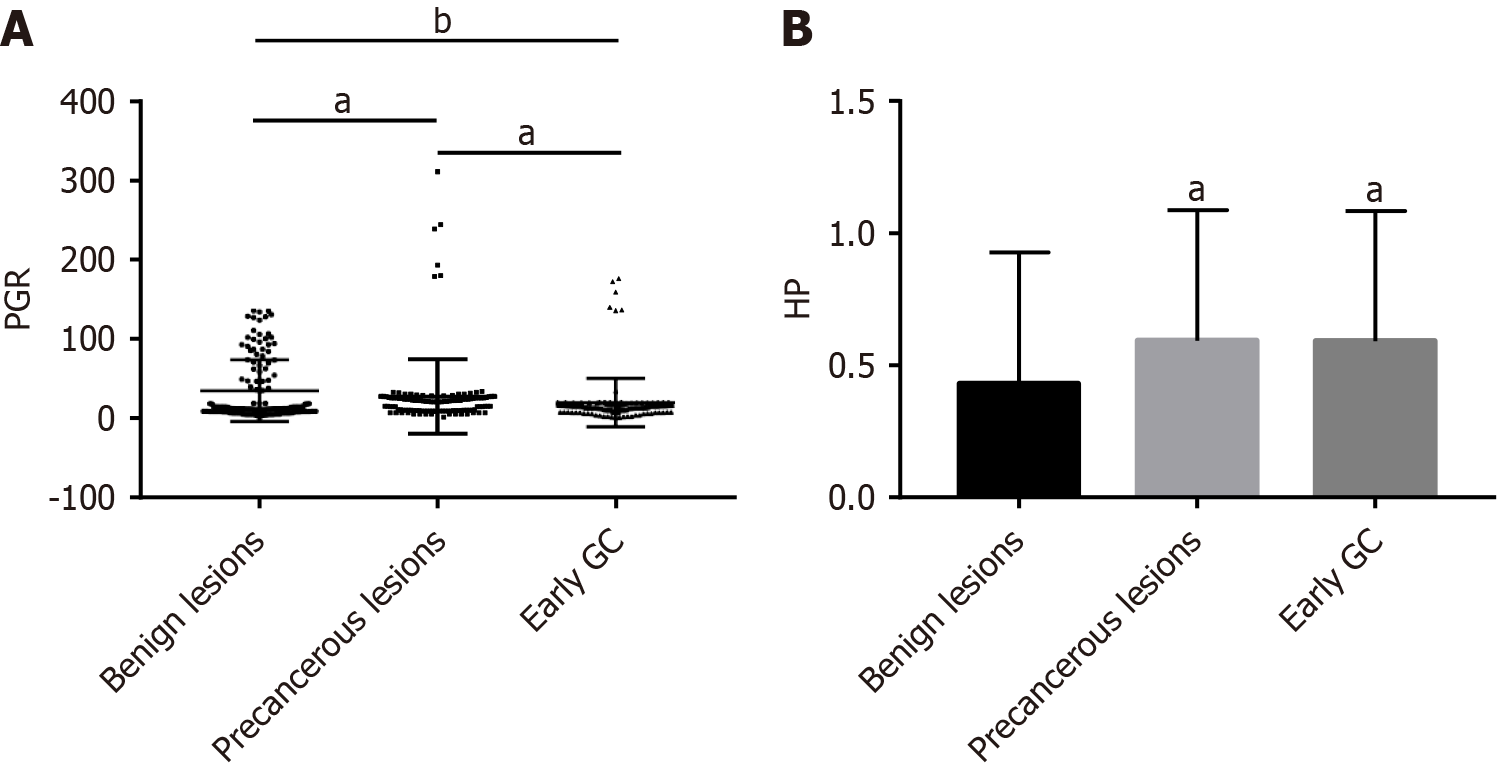
Figure 1 Pepsinogen ratio and Helicobacter pylori-positive rates of three groups of patients.
A: Pepsinogen ratio of three groups of patients; B: Helicobacter pylori-positive rates of three groups of patients. aP < 0.05 and bP < 0.01 in the inter-group comparison or in the comparison with benign lesions. PGR: Pepsinogen ratio; GC: Gastric cancer; HP: Helicobacter pylori.
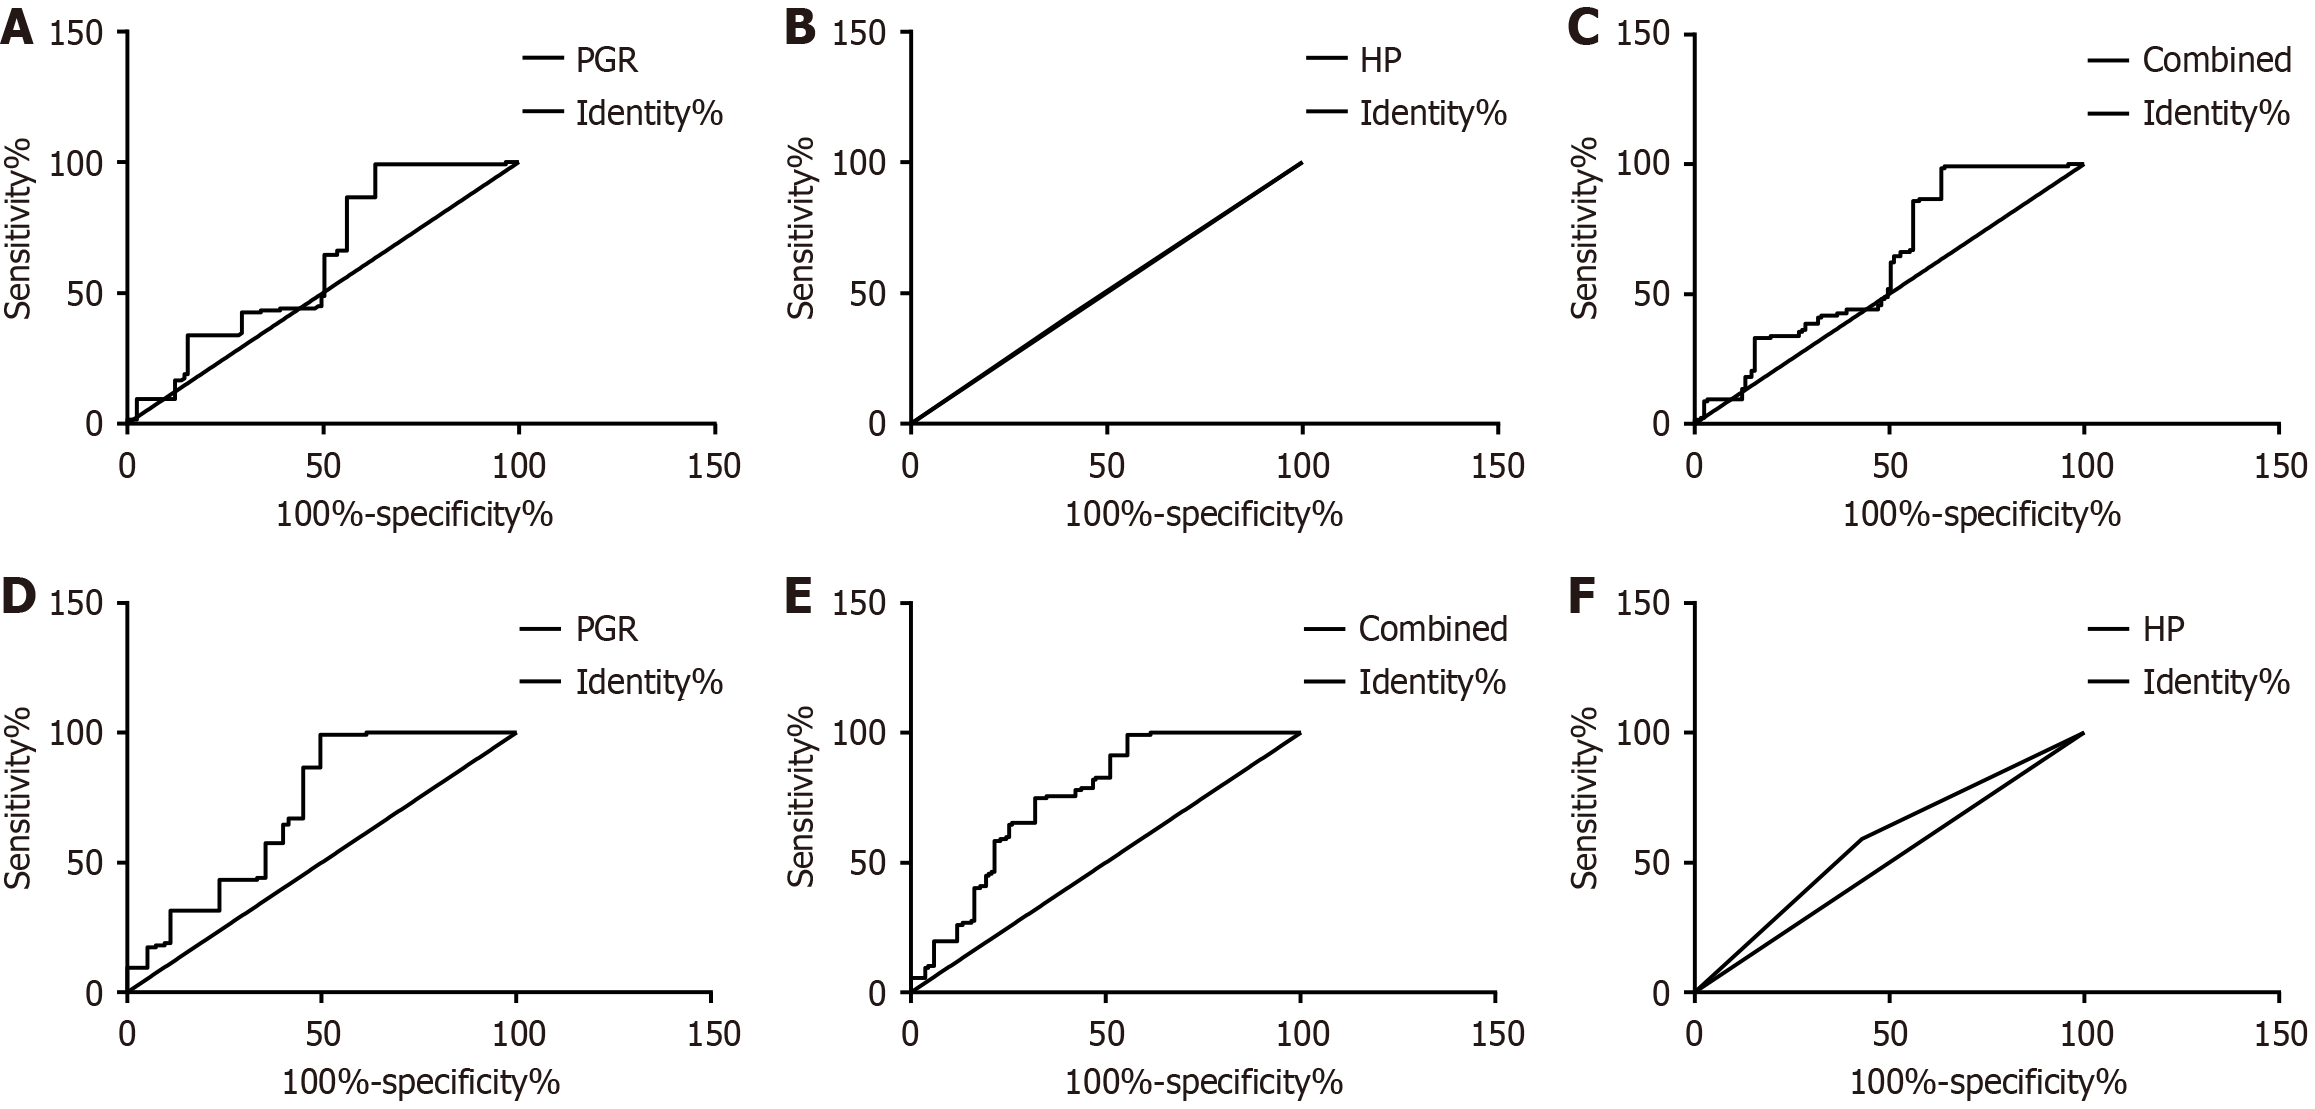
Figure 2 Receiver operating characteristic curves analysis of the effectiveness of pepsinogen ratio and Helicobacter pylori in distinguishing benign lesions from precancerous lesions.
A: Receiver operating characteristic (ROC) curves analysis of the effectiveness of pepsinogen ratio in differentiating benign lesions from precancerous lesions (PCLs); B: ROC curves analysis of the effectiveness of Helicobacter pylori in distinguishing benign lesions from PCLs; C: ROC curves analysis of the effectiveness of pepsinogen ratio + Helicobacter pylori in distinguishing benign lesions from PCLs. PGR: Pepsinogen ratio; HP: Helicobacter pylori.
Figure 3 Receiver operating characteristic curves.
A: The receiver operating characteristic (ROC) curve of pepsinogen ratio in differentiating precancerous lesions from early gastric cancer (EGC); B: The ROC curve of Helicobacter pylori in distinguishing precancerous lesions from EGC; C: The ROC curve of the combined detection in differentiating precancerous lesions from EGC; D: The ROC curve of pepsinogen ratio in distinguishing benign lesions from EGC; E: The ROC curve of Helicobacter pylori in differentiating benign lesions from EGC; F: The ROC curve of the combined detection in distinguishing benign lesions from EGC. PGR: Pepsinogen ratio; HP: Helicobacter pylori.
- Citation: Han X, Yu W. Value of serum pepsinogen ratio screening for early gastric cancer and precancerous lesions in Youcheng area. World J Gastrointest Surg 2024; 16(12): 3729-3736
- URL: https://www.wjgnet.com/1948-9366/full/v16/i12/3729.htm
- DOI: https://dx.doi.org/10.4240/wjgs.v16.i12.3729


