Copyright
©The Author(s) 2024.
World J Gastrointest Surg. Jan 27, 2024; 16(1): 228-238
Published online Jan 27, 2024. doi: 10.4240/wjgs.v16.i1.228
Published online Jan 27, 2024. doi: 10.4240/wjgs.v16.i1.228
Figure 1 A flowchart of study screening and selection process.
OSM: Oncostatin M; IBD: Inflammatory bowel disease.
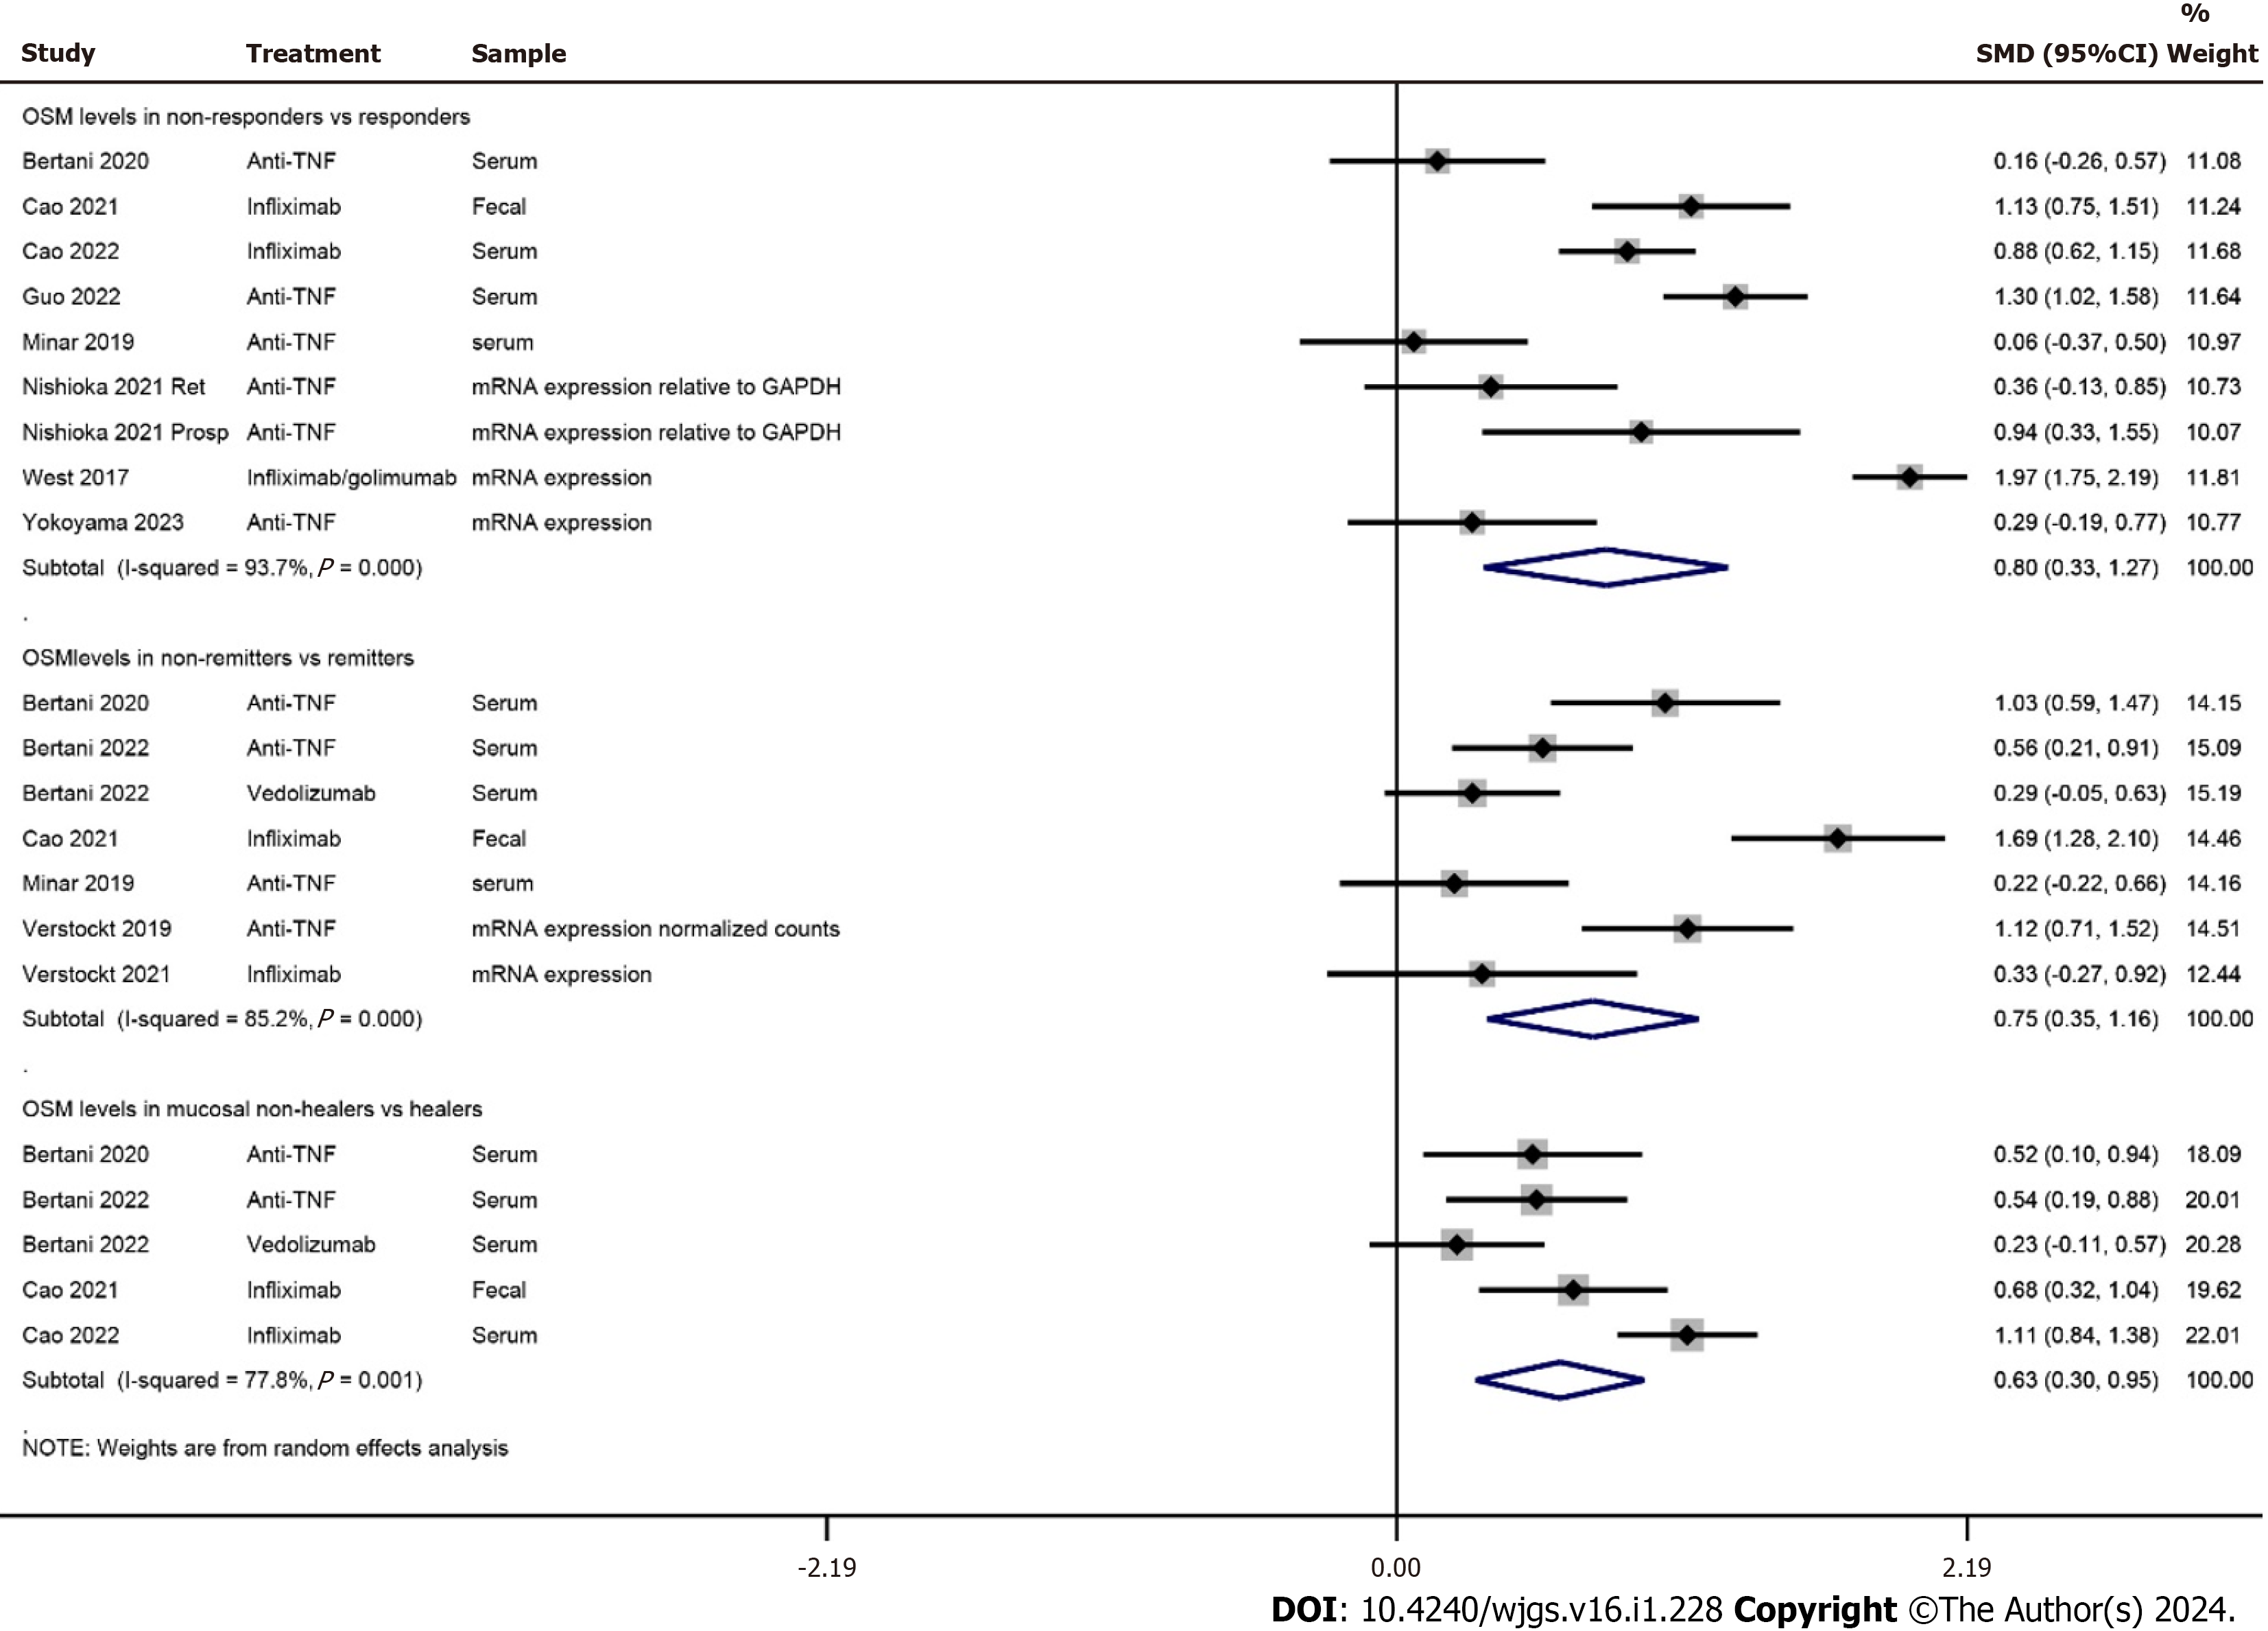
Figure 2 A forest graph showing the outcomes of a meta-analysis of standardized mean differences between responders and non-responders, remitters and non-remitters, and mucosal healers and non-healers of anti-tumor necrosis factor-based therapies in patients with inflammatory bowel disease.
OSM: Oncostatin M; TNF: Tumor necrosis factor; SMD: Standardized mean difference.
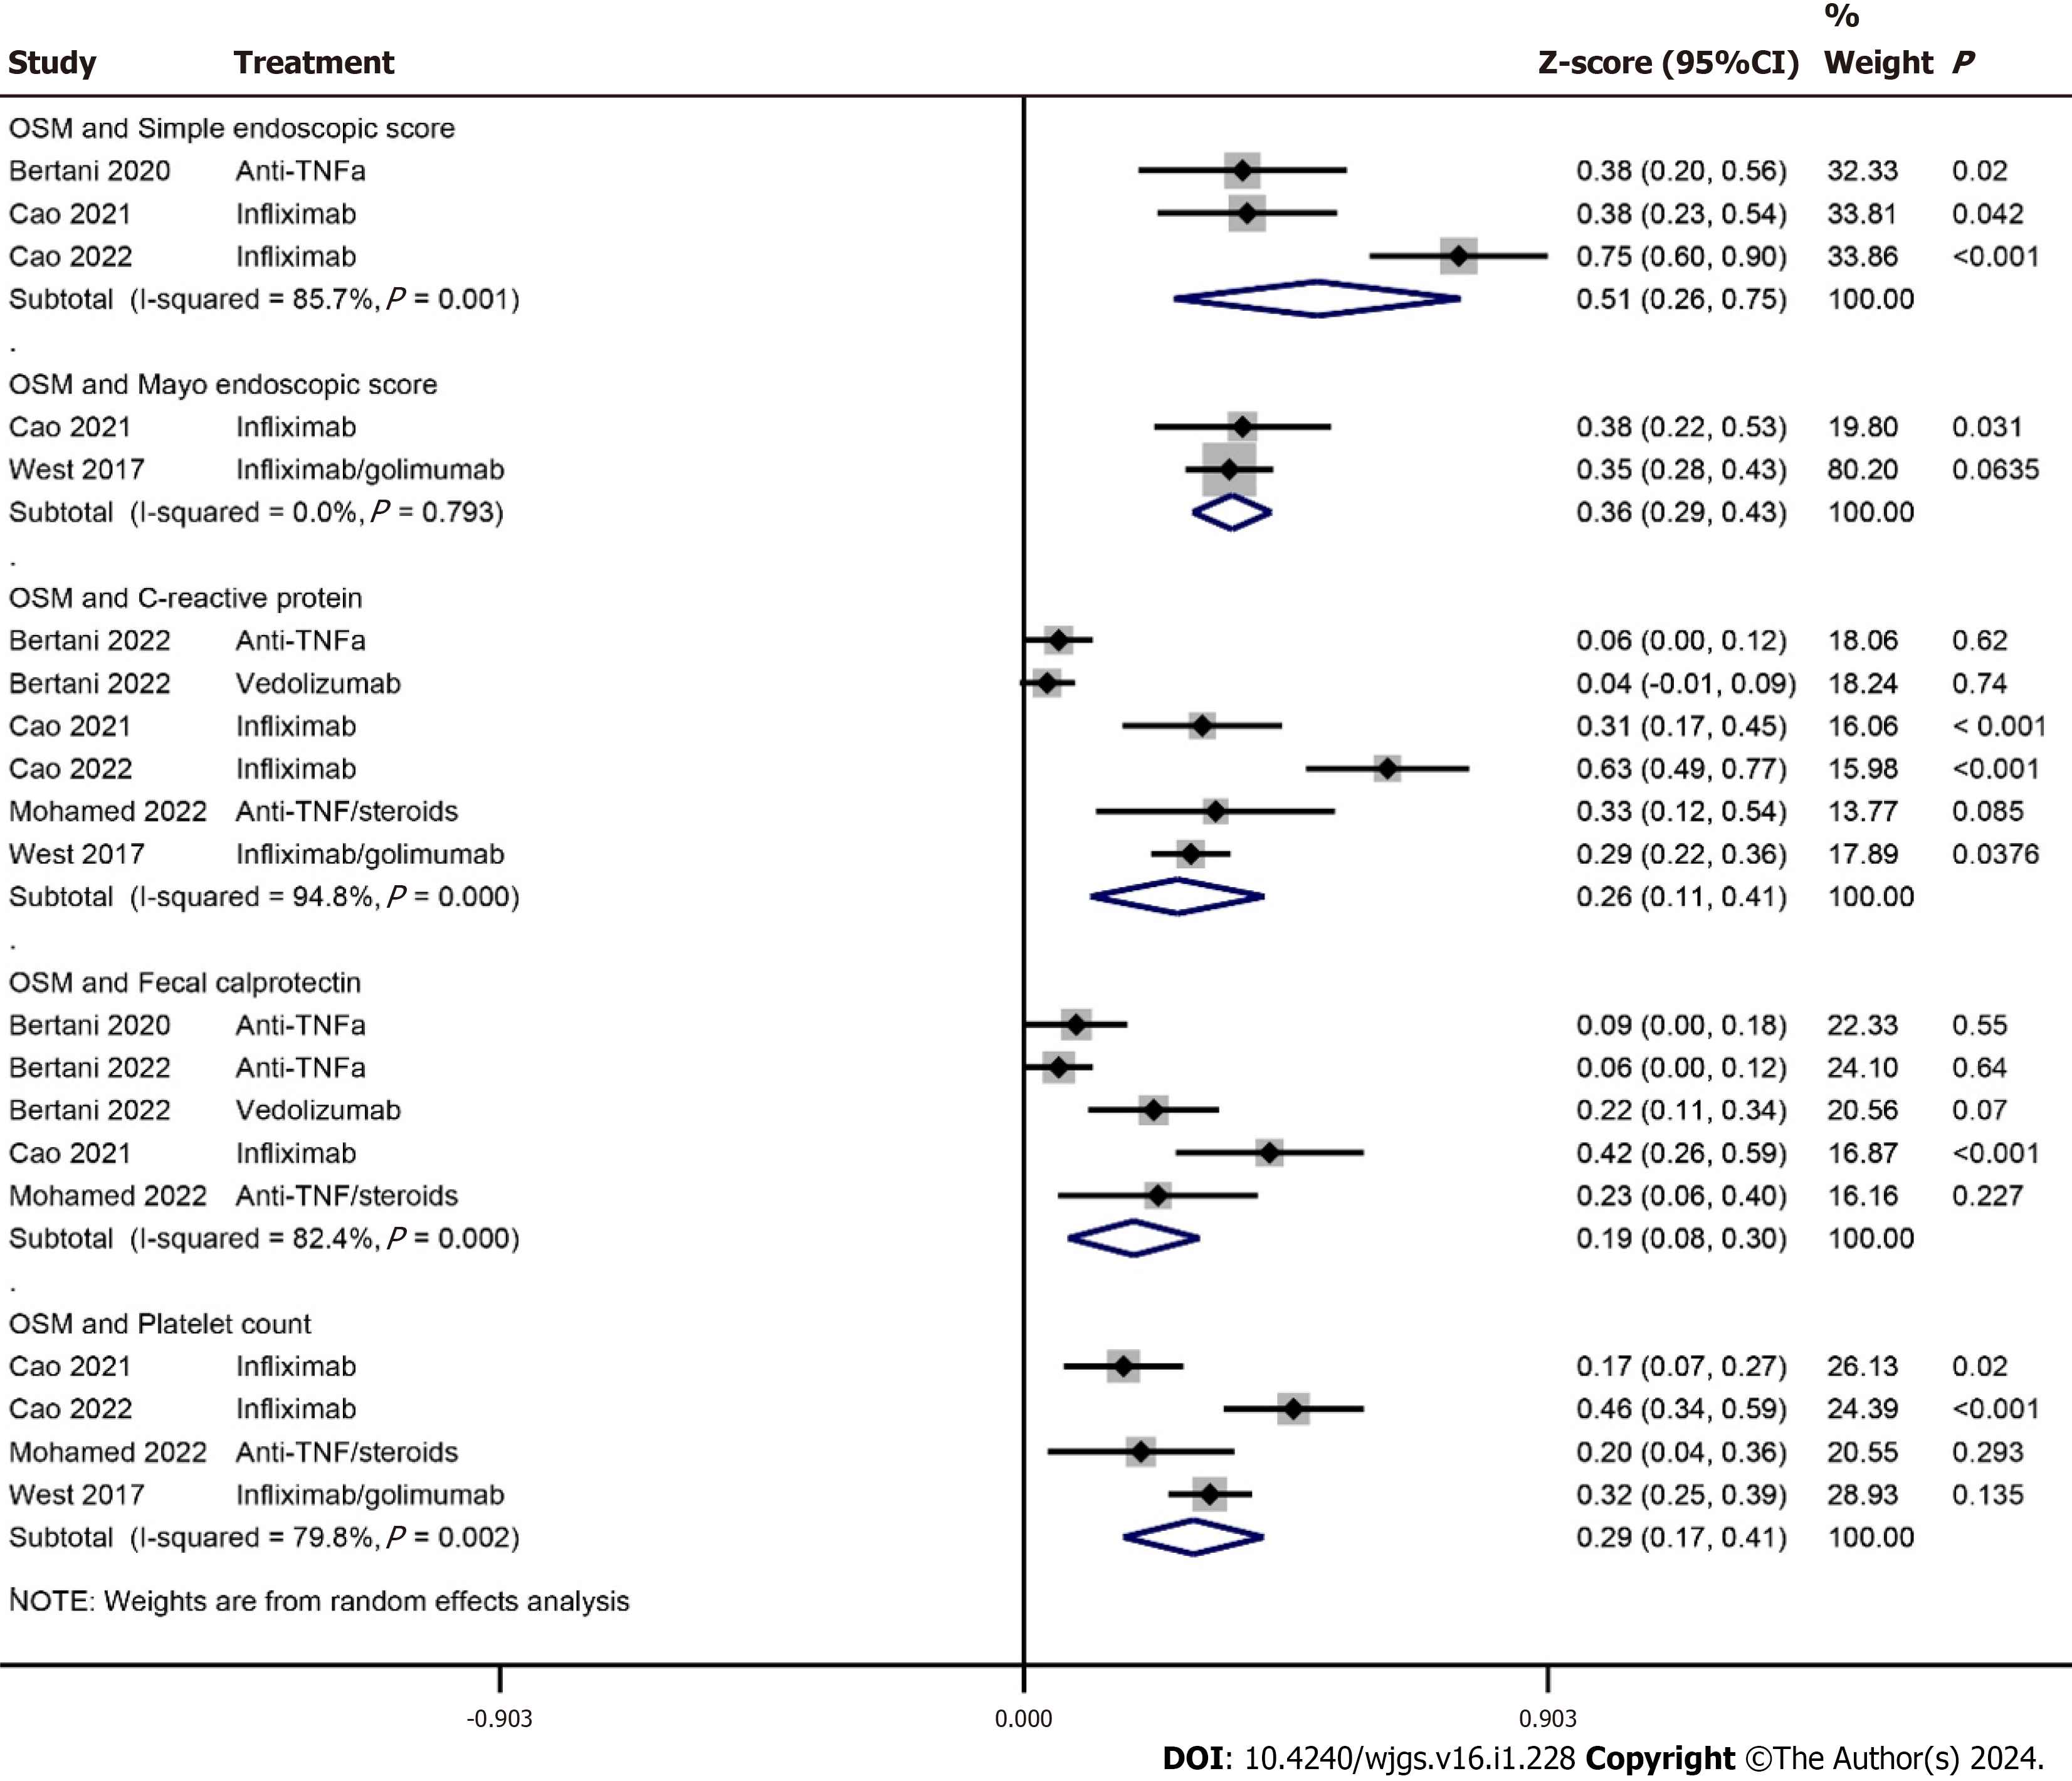
Figure 3 A forest graph showing the outcomes of a meta-analysis of correlation coefficients between baseline Oncostatin M and other baseline inflammatory biomarkers/disease indicators.
OSM: Oncostatin M; TNF: Tumor necrosis factor.
- Citation: Yang Y, Fu KZ, Pan G. Role of Oncostatin M in the prognosis of inflammatory bowel disease: A meta-analysis. World J Gastrointest Surg 2024; 16(1): 228-238
- URL: https://www.wjgnet.com/1948-9366/full/v16/i1/228.htm
- DOI: https://dx.doi.org/10.4240/wjgs.v16.i1.228


