Copyright
©The Author(s) 2023.
World J Gastrointest Surg. Jul 27, 2023; 15(7): 1304-1316
Published online Jul 27, 2023. doi: 10.4240/wjgs.v15.i7.1304
Published online Jul 27, 2023. doi: 10.4240/wjgs.v15.i7.1304
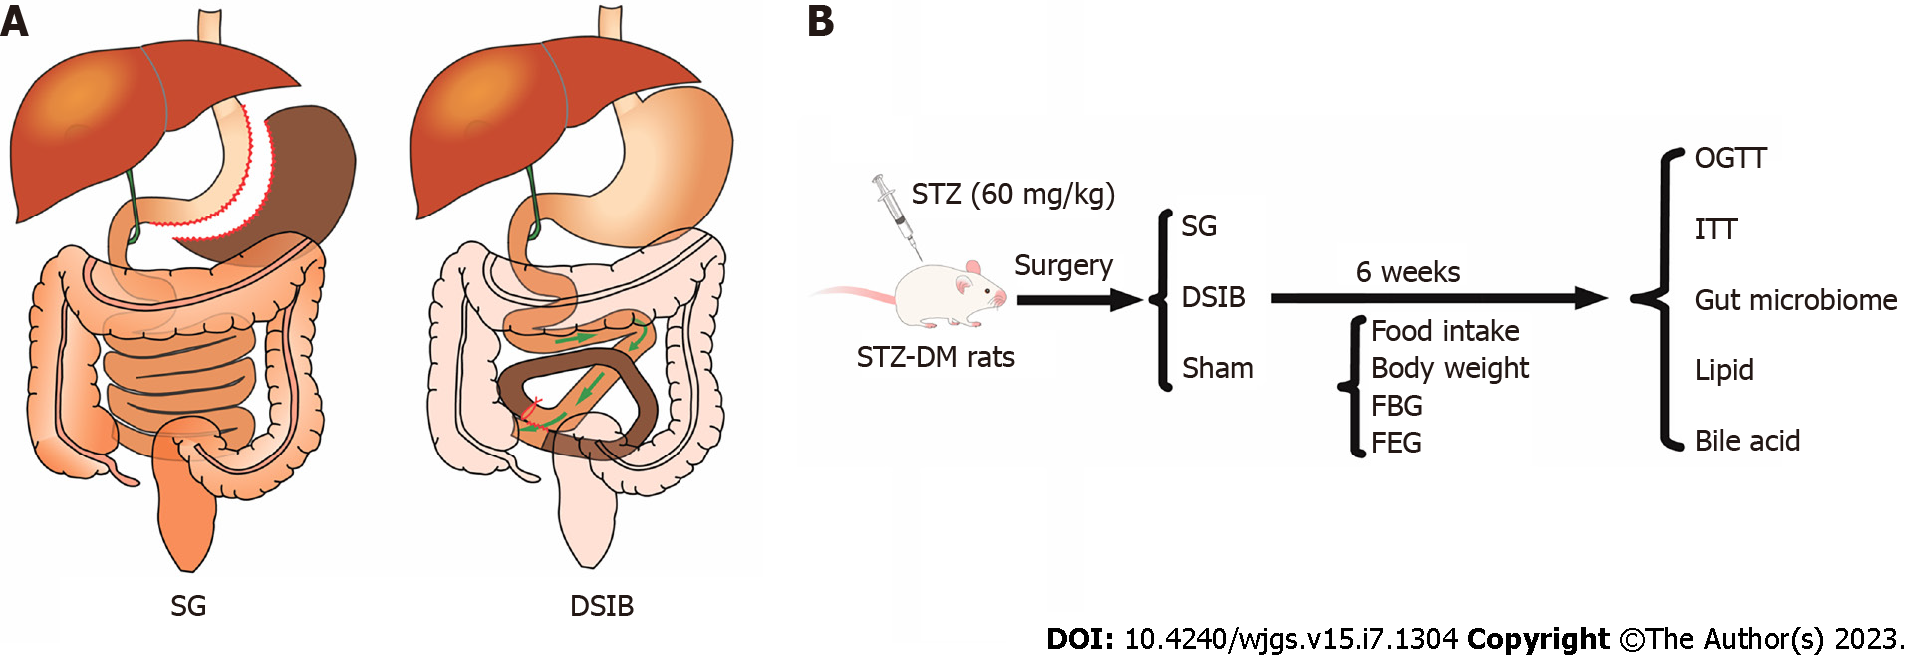
Figure 1 Schematic diagram of the operation and experimental flow chart.
A: Sleeve gastrectomy (SG) with distal small bowel bypass (DSIB); B: Experimental design schedule (SG n = 5, DSIB n = 6, sham n = 5). Sleeve gastrectomy: the lesser curved side of the stomach is preserved and 70% to 80% of the greater curved side of the stomach is resected; distal small bowel bypass: the reference point is near the ileocecal region. From this point to 40 cm distal to the flexural ligament, approximately 60% of the entire length of the small bowel is left open and intestinal continuity is restored by lateral anastomosis of the proximal jejunum and ileum. Lumenal occlusion is performed in the first part of the bypass section by means of a 0-gauge wire. Postprandial blood glucose, feeding glucose, glucose tolerance test, insulin sensitivity test, sham-operated control group. DSIB: Distal small bowel bypass; STZ-DM: Rats with streptozotocin-induced nonobese diabetes; FBG: Fasting blood glucose; ITT: Insulin tolerance test; SG: Sleeve gastrectomy; STZ: Streptozotocin; OGTT: Oral glucose tolerance test.
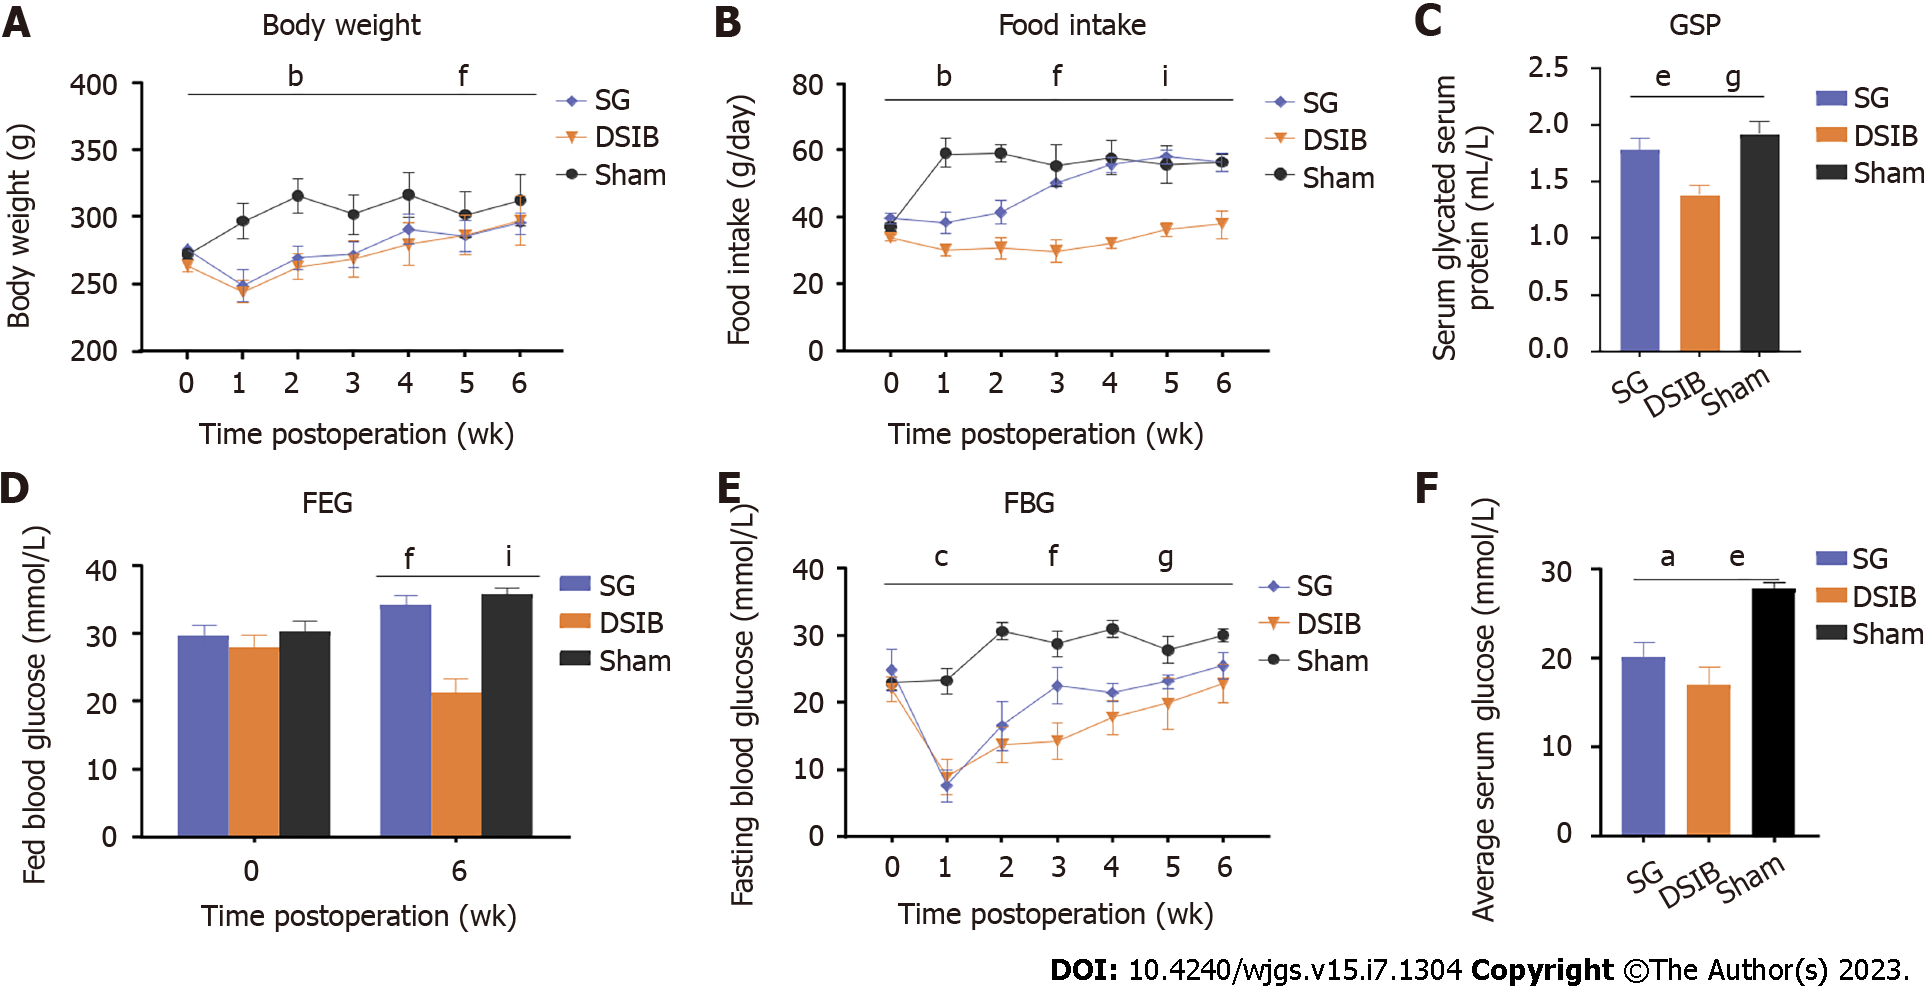
Figure 2 Changes in body weight eating and blood glucose in rats after surgery.
A: Body weight; B: Food intake; C: Serum glycated hemoglobin; D: Postprandial glucose; E: Random blood glucose; F: Average blood glucose level of rats within six weeks. Data are presented as means ± SEM. Statistical significance was determined by two-tailed Student’s t-test or two-way analysis of variance, sleeve gastrectomy (SG) vs sham P value magnitude, aP < 0.05, bP < 0.01, cP < 0.001; distal small bowel bypass (DSIB) vs sham group P value magnitude, dP < 0.05, eP < 0.01, fP < 0.001; DSIB vs SG P value magnitude, gP < 0.05, hP < 0.01, iP < 0.001. FBG: Fasting blood glucose; FEG: Feeding glucose; GSP: Glycated serum protein.
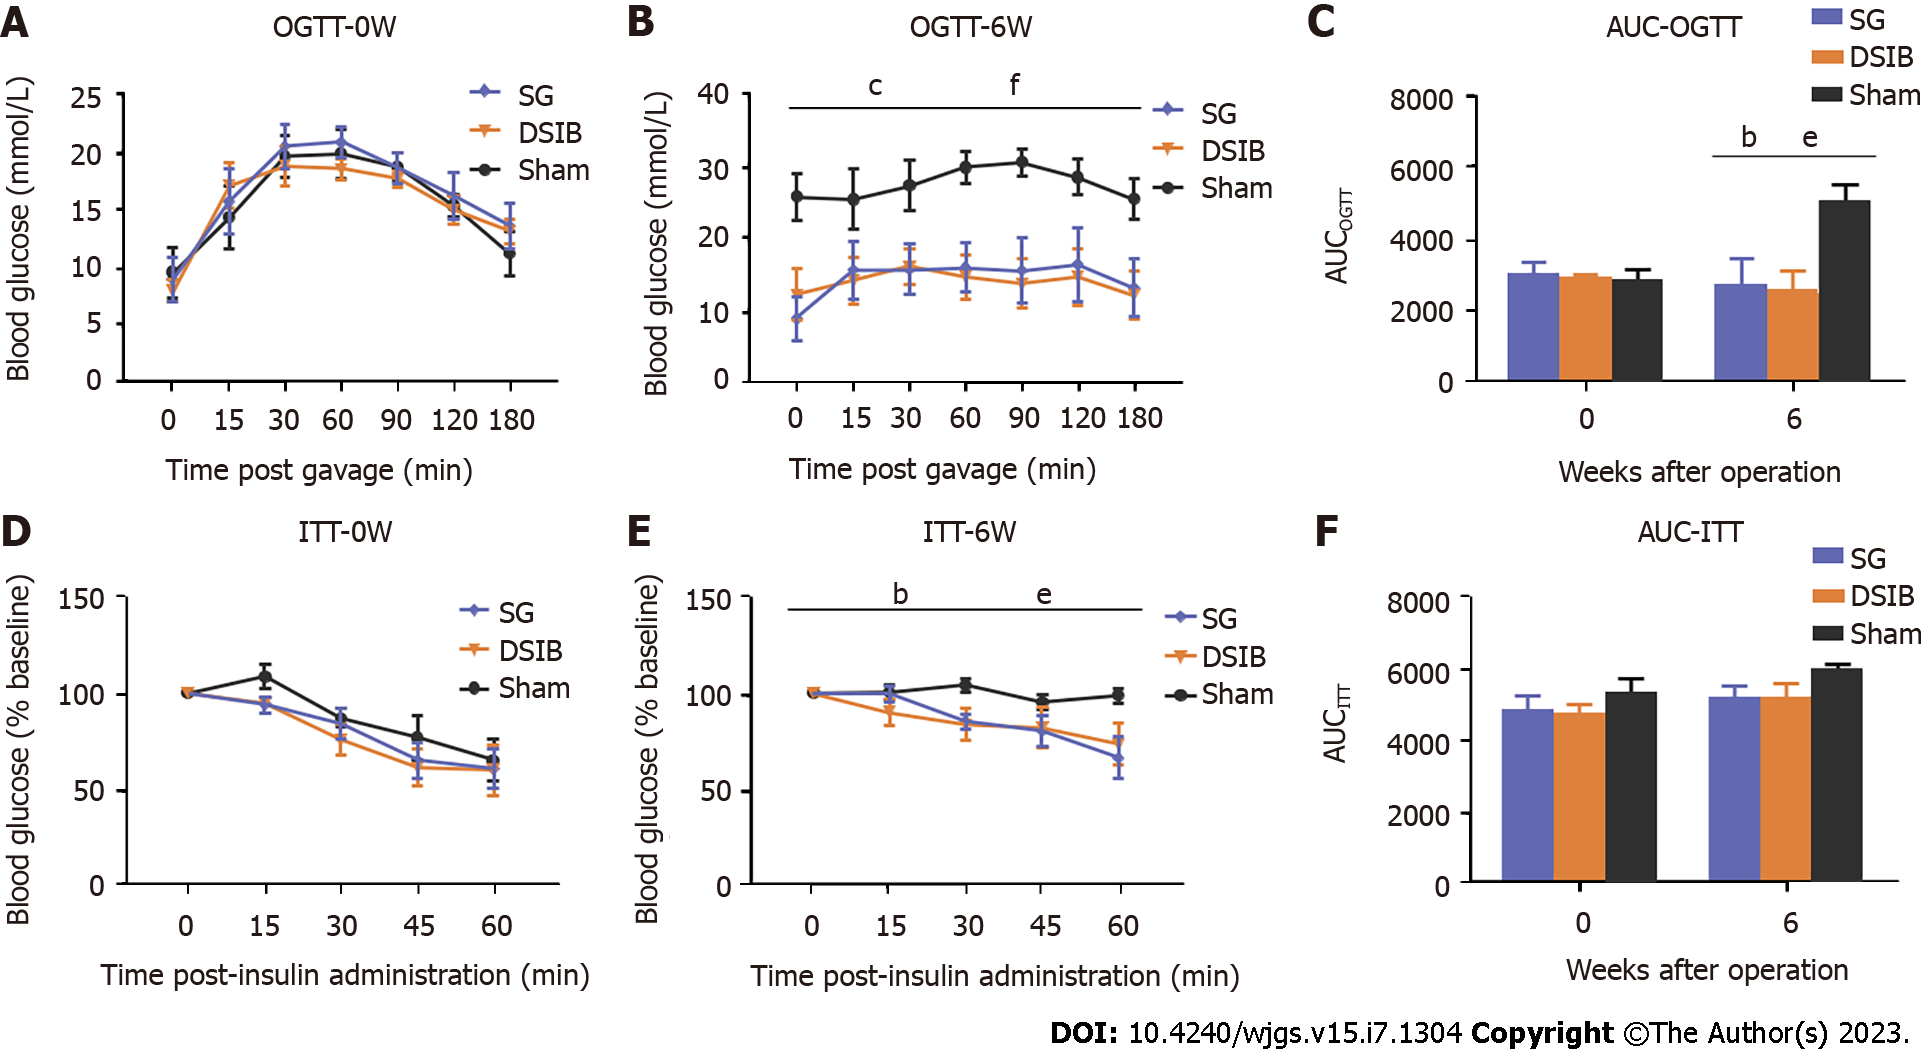
Figure 3 Postoperative improvement in glucose metabolism in rats.
A: Oral glucose tolerance test (OGTT) in rats at 0 wk; B: OGTT in rats at 6 wk postoperatively; C: Area under the curve of OGTT; D: Insulin sensitivity test (ITT) in rats at 0 wk; E: ITT in rats at 6 wk postoperatively; F: Area under the ITT curve. Data are presented as mean ± SEM. Statistical significance was determined by two-tailed Student’s t-test or two-way analysis of variance, sleeve gastrectomy (SG) vs sham P value magnitude, aP < 0.05, bP < 0.01, cP < 0.001; distal small bowel bypass (DSIB) vs sham group P value magnitude, & DSIB vs SG P value magnitude, dP < 0.05, eP < 0.01, fP < 0.001. AUC: Area under the curve; ITT: Insulin tolerance test; OGTT: Oral glucose tolerance test.
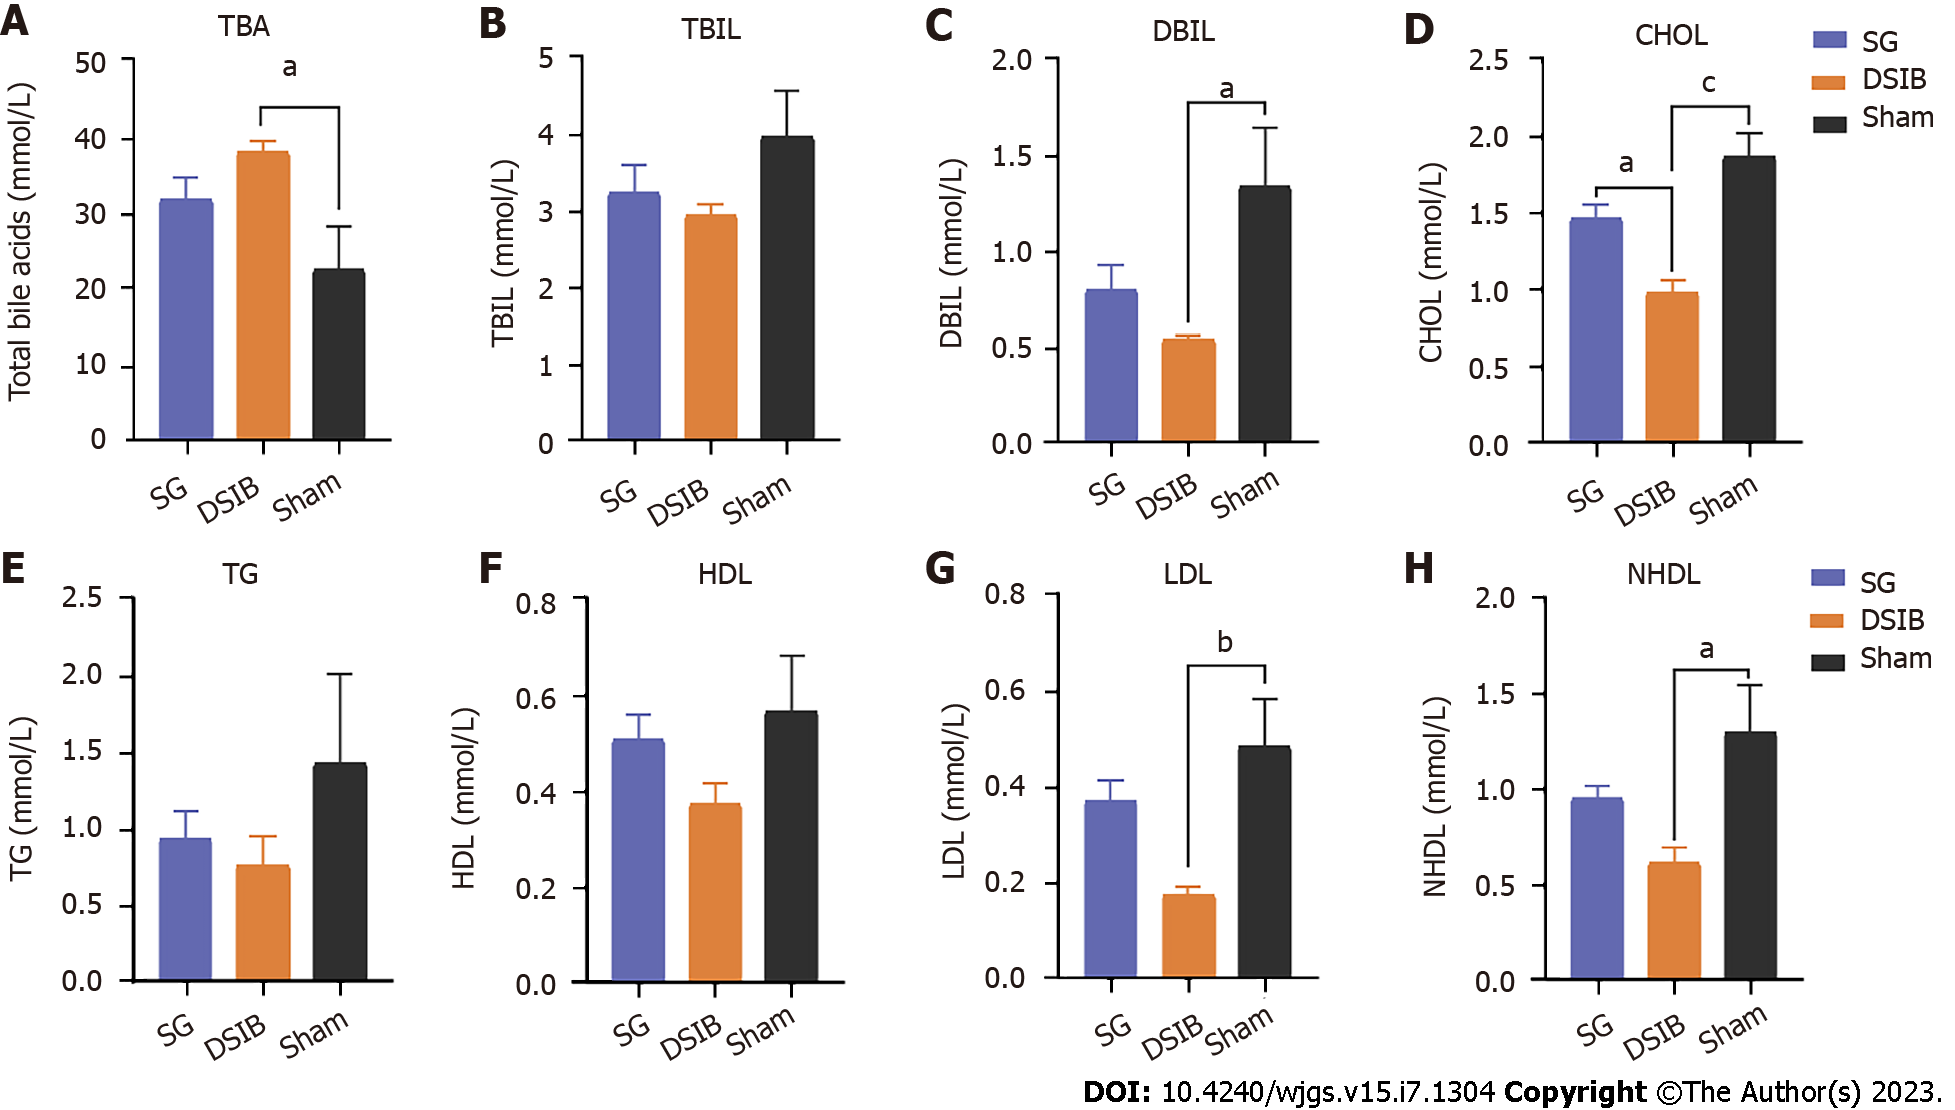
Figure 4 Serum bile acids and lipid metabolism in postoperative rats.
A: Serum total bile acids at 6 wk postoperatively; B: Serum total bilirubin in rats at 6 wk postoperatively; C: Serum direct bilirubin in rats at 6 wk postoperatively; D: Serum total cholesterol in rats at 6 wk postoperatively; E: Serum total triglyceride in rats at 6 wk postoperatively; F: Serum high-density lipoprotein in rats at 6 wk postoperatively; G: Serum low-density lipoprotein in rats at 6 wk postoperatively; H: Serum non-high-density lipoprotein in rats at 6 wk postoperatively. Data are presented as means ± SEM. Statistical significance was determined by two-tailed Student’s t-test or two-way analysis of variance. aP < 0.05, bP < 0.01, cP < 0.001. TBA: Total bile acids; TBIL: Total bilirubin; DBIL: Direct bilirubin; CHOL: Total cholesterol; TG: Total triglyceride; HDL: High-density lipoprotein; LDL: Low-density lipoprotein; NHDL: Nonhigh-density lipoprotein; DSIB: Distal small bowel bypass; SG: Sleeve gastrectomy.
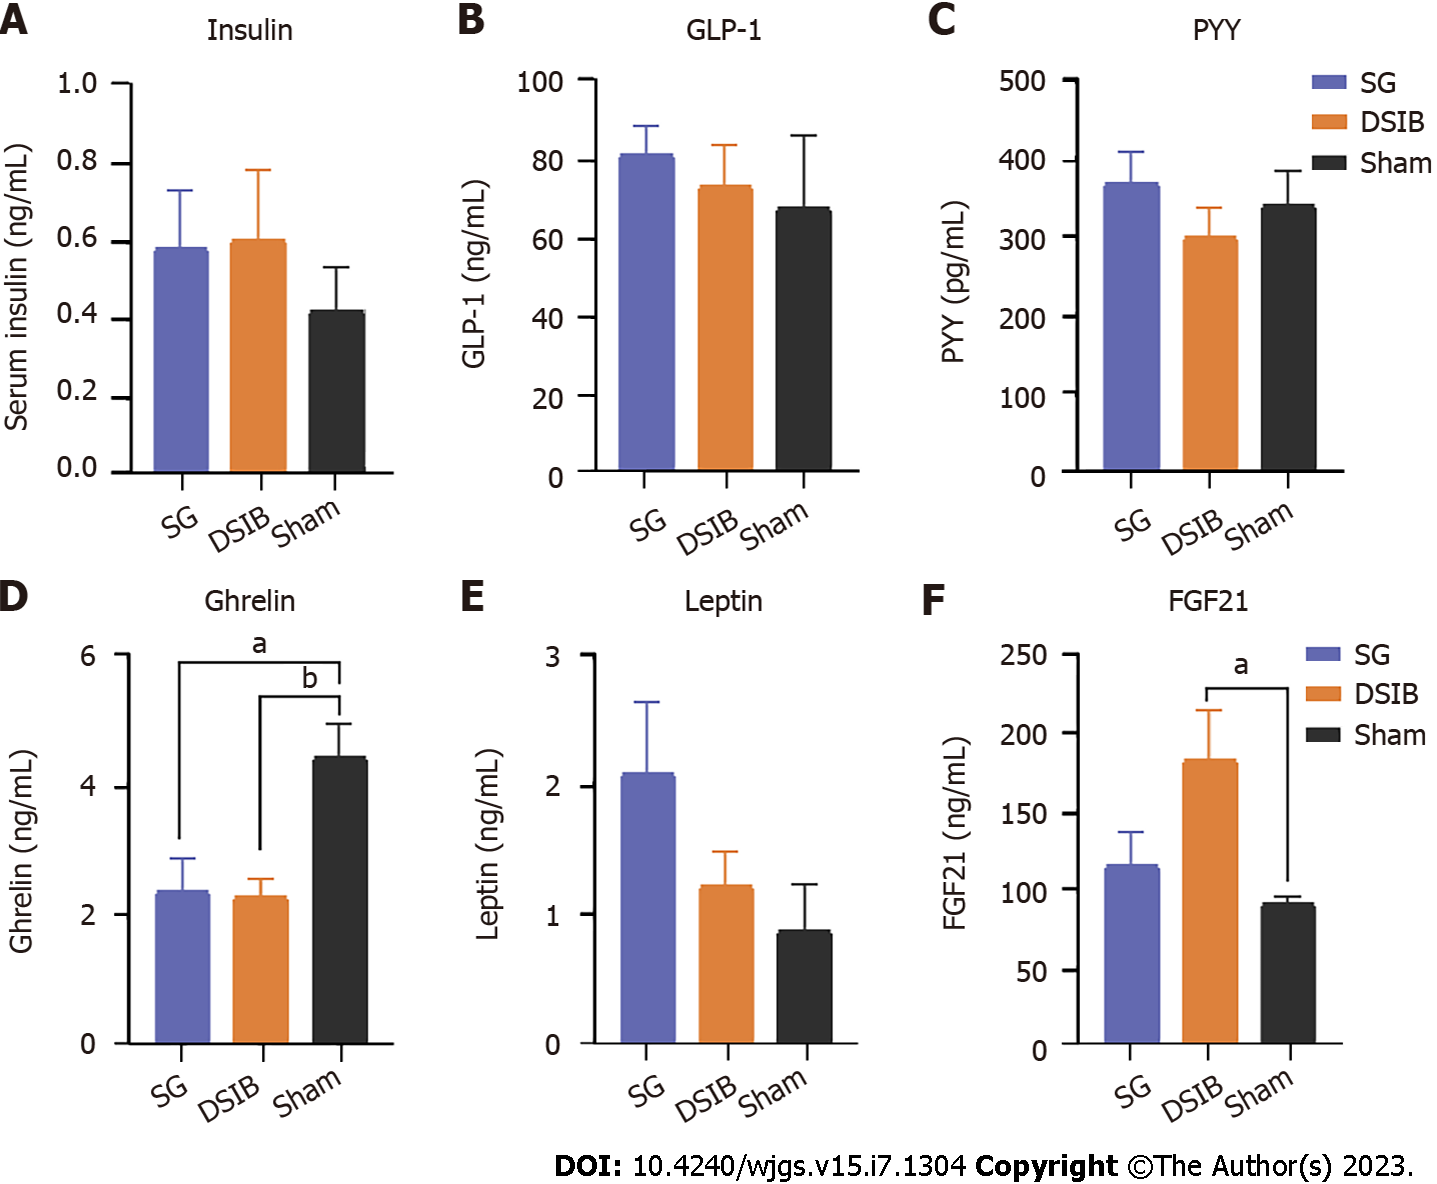
Figure 5 Gastrointestinal hormone levels in rats at 6 wk postoperatively.
A: Serum insulin at 6 wk postoperatively; B: Serum GLP-1 in rats at 6 wk postoperatively; C: Serum PYY in rats at 6 wk postoperatively; D: Serum ghrelin in rats at 6 wk postoperatively; E: Serum leptin in rats at 6 wk postoperatively; F: Serum FGF21 in rats at 6 wk postoperatively. Data are presented as means ± SEM. Statistical significance was determined by two-tailed Student’s t-test or two-way analysis of variance, aP < 0.05, bP < 0.01, cP < 0.001. DSIB: Distal small bowel bypass; SG: Sleeve gastrectomy.
Figure 6 Analysis of gut microbiota in rats at 6 wk postoperatively.
A: PcoA analysis of gut microbiota based on the OUT data of sleeve gastrectomy (SG), distal small intestine bypass (DSIB) and SHAM groups; B: Shannon index of biodiversity in the SG, DSIB and sham groups; C: Ratio of the relative abundance of SG, DSIB, and sham Firmicutes to Bacteroidetes; D: Relative abundance of gut microbiota composition at the genus level in the SG, DSIB and sham groups. DSIB: Distal small bowel bypass; SG: Sleeve gastrectomy.
Figure 7 Linear discriminant analysis and correlation analysis of rats faecalis flora.
A and B: Linear discriminant analysis effect sizes were generated for phylogenetic trees and linear discriminant analysis scores of rats faecalis flora for the distal small intestine bypass group (A), sleeve gastrectomy group (B) and sham-operated group comparisons. Significantly enriched bacterial taxa (P < 0.05, LDA scores > 2) are marked with the indicated colours. DSIB: Distal small bowel bypass; SG: Sleeve gastrectomy.
Figure 8 Correlation analysis of rats faecalis flora.
Correlation analysis, correlations P < 0.05 are marked with circles, the colour and size of the circles indicate the magnitude of the correlation coefficient r. Blue represents positive correlations and red represents negative correlations. CHOL: Total cholesterol; DSIB: Distal small bowel bypass; ITT: Insulin tolerance test; IBIL: Indirect bilirubin; LDL: Low-density lipoprotein; NHDL: Nonhigh-density lipoprotein; OGTT: Oral glucose tolerance test; SG: Sleeve gastrectomy; TBA: Total bile acids.
- Citation: Luo X, Tan C, Tao F, Xu CY, Zheng ZH, Pang Q, He XA, Cao JQ, Duan JY. Differences in metabolic improvement after metabolic surgery are linked to the gut microbiota in non-obese diabetic rats. World J Gastrointest Surg 2023; 15(7): 1304-1316
- URL: https://www.wjgnet.com/1948-9366/full/v15/i7/1304.htm
- DOI: https://dx.doi.org/10.4240/wjgs.v15.i7.1304


