Copyright
©The Author(s) 2023.
World J Gastrointest Surg. May 27, 2023; 15(5): 892-905
Published online May 27, 2023. doi: 10.4240/wjgs.v15.i5.892
Published online May 27, 2023. doi: 10.4240/wjgs.v15.i5.892
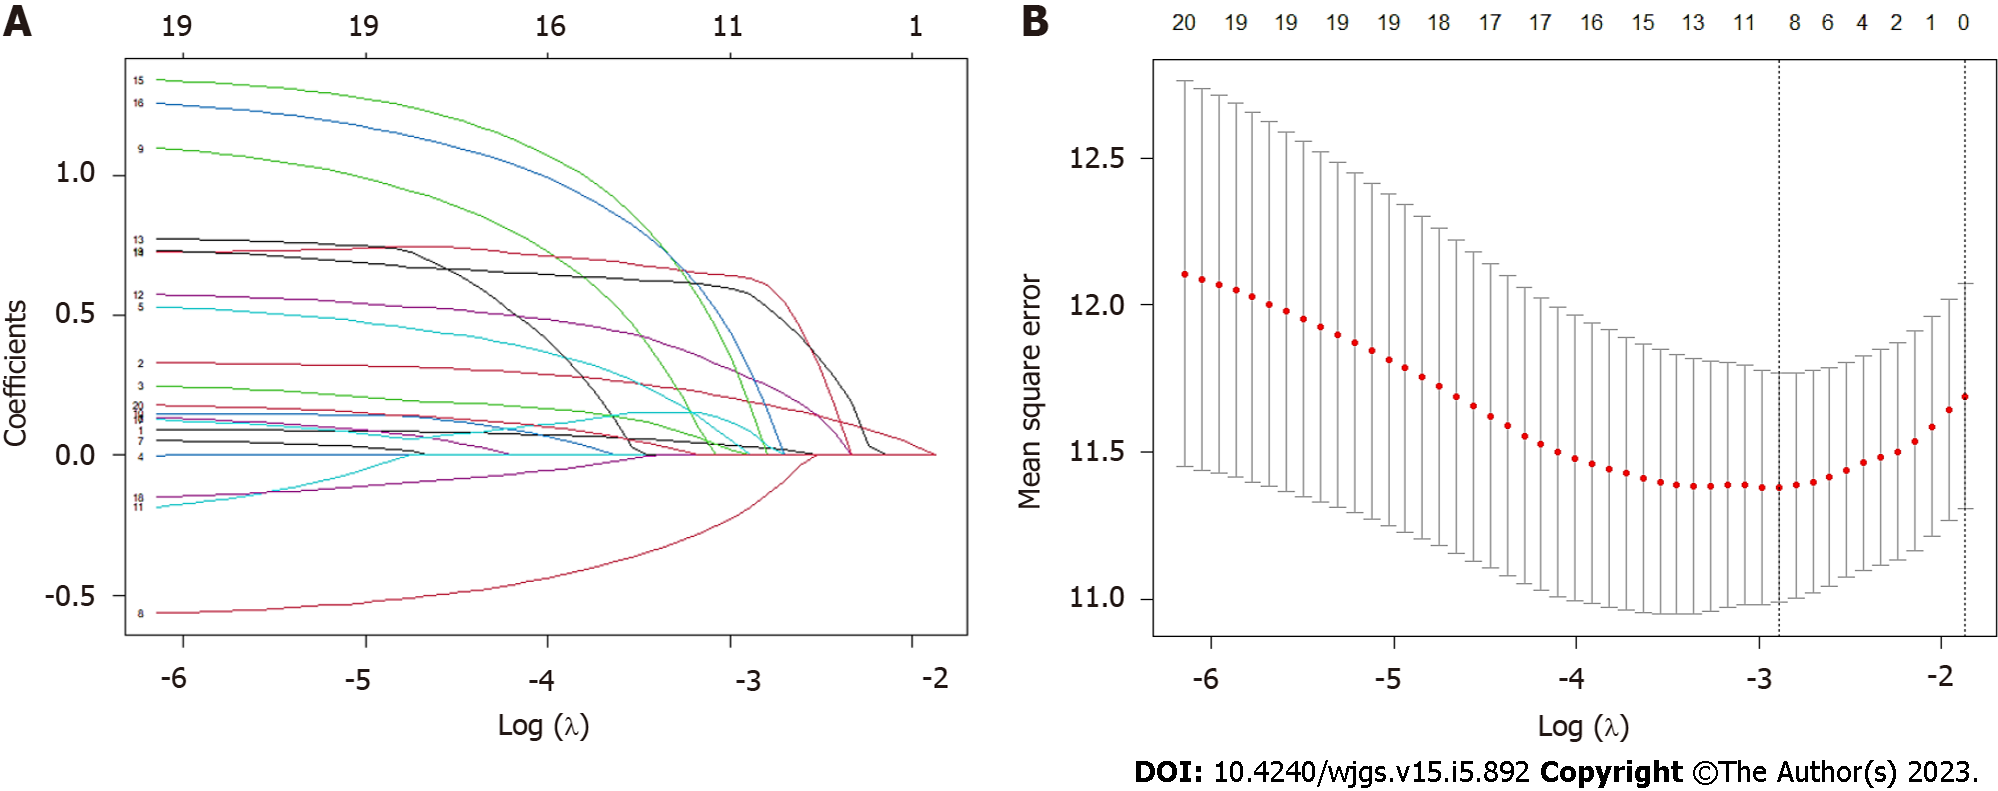
Figure 1 Least absolute shrinkage and selection operator Cox regression for feature selection.
A: The correlation between the clinical characteristics’ coefficient and logarithm of λ in least absolute shrinkage and selection operator (LASSO) regression. Each coefficient was shown against the log (λ) sequence; B: The relationship between the log (λ) and mean square error in LASSO regression using the 10-fold cross-validation. The vertical dotted lines were placed at the optimal log (λ) values where clinical features were selected.
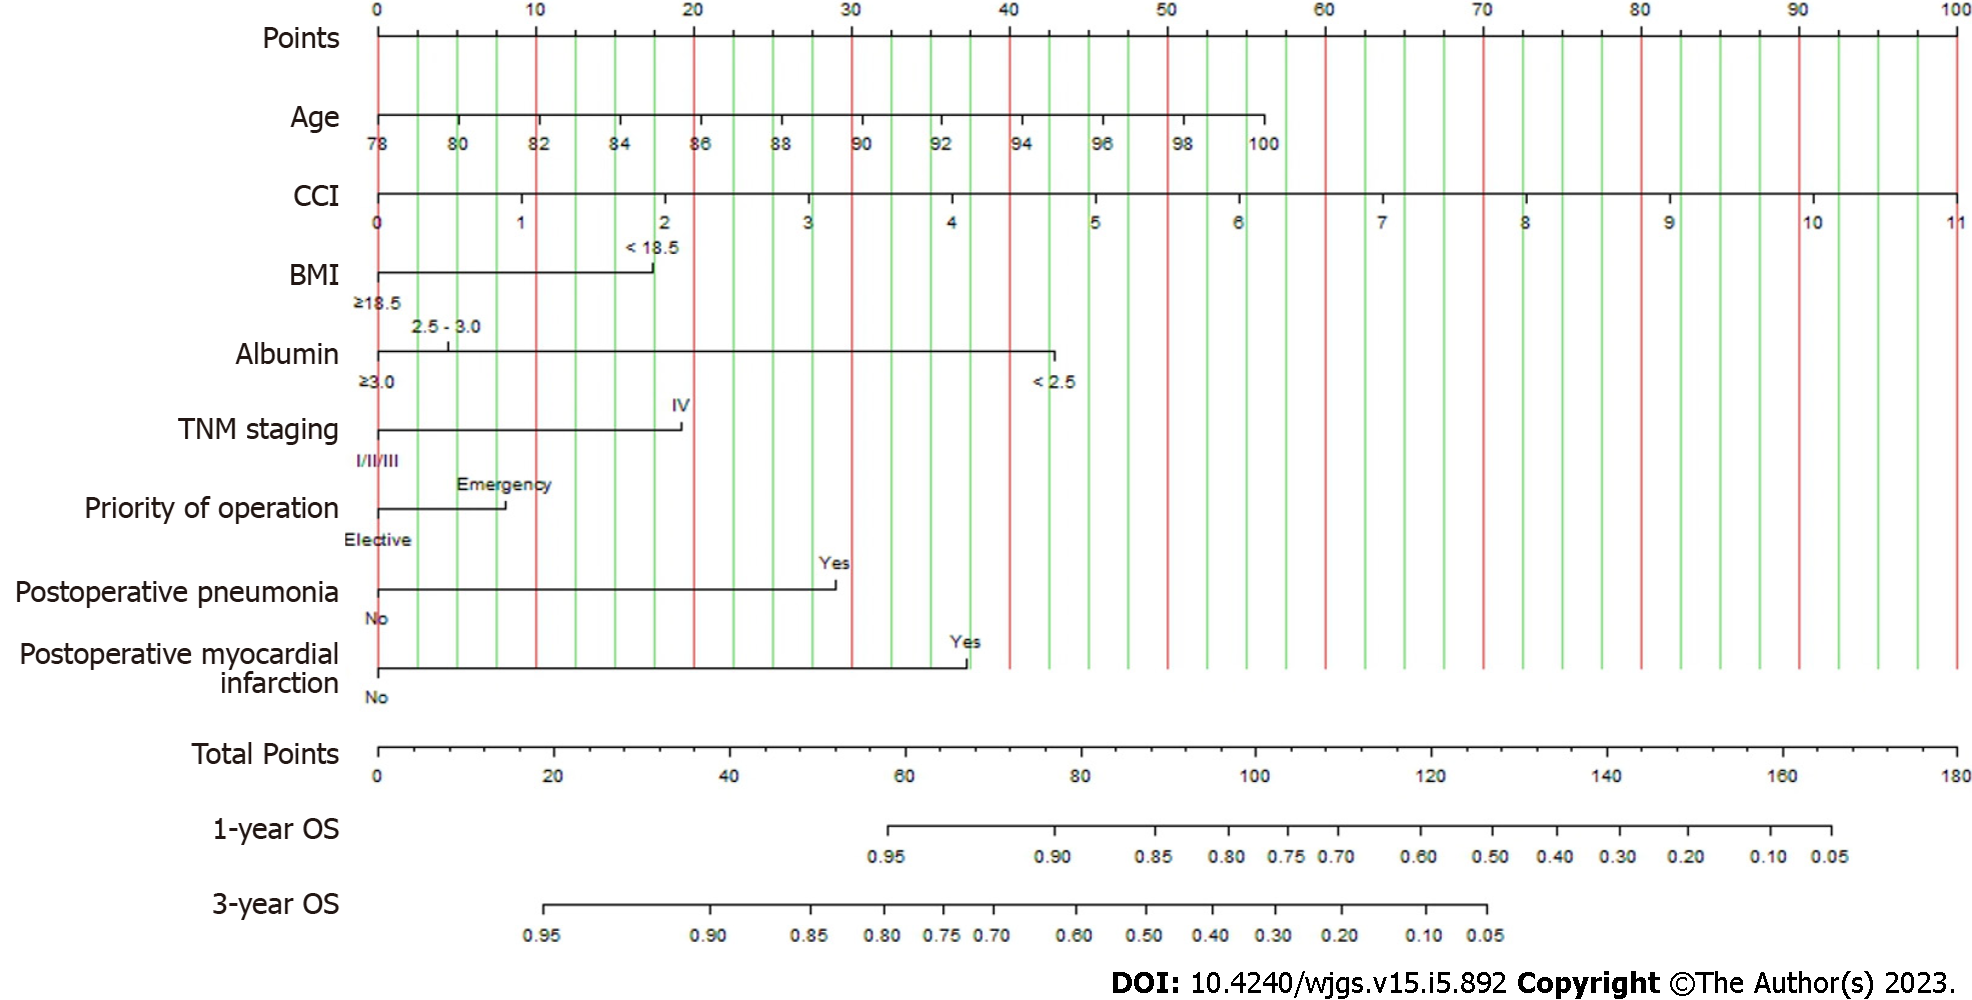
Figure 2 Nomogram for predicting 1- and 3-yr overall survival following colorectal surgery in elderly cancer patients over 80 yr.
Draw a vertical line from each variable value to the top “Points” axis, then sum all variables' points. The total points on the bottom scale corresponding to the 1- and 3-yr survival would be displayed. BMI: Body mass index; TNM: Tumor-node-metastasis; CCI: Charlson comorbidity index; OS: Overall survival.
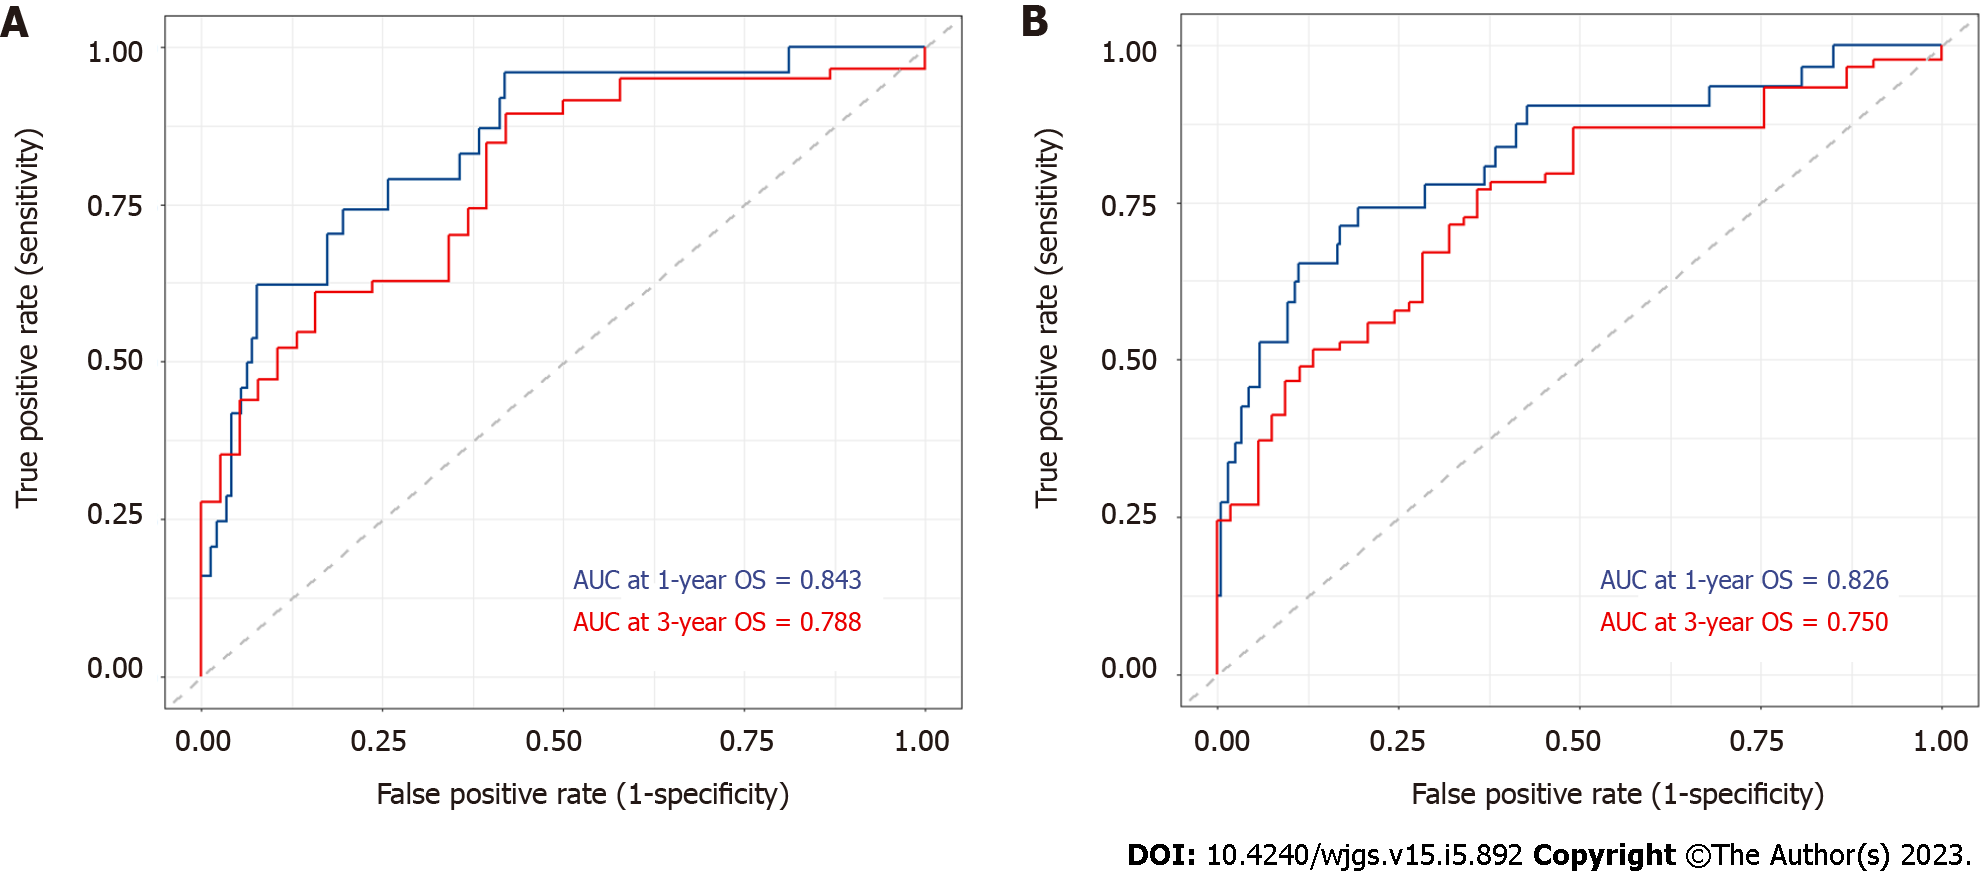
Figure 3 Area under the receiver operating characteristic curve of the constructed nomogram to predict 1- and 3-yr overall survival of elderly colorectal cancer patients.
A: Training cohort; B: Validation cohort. AUC: Area under the receiver operating characteristic curve; OS: Overall survival.
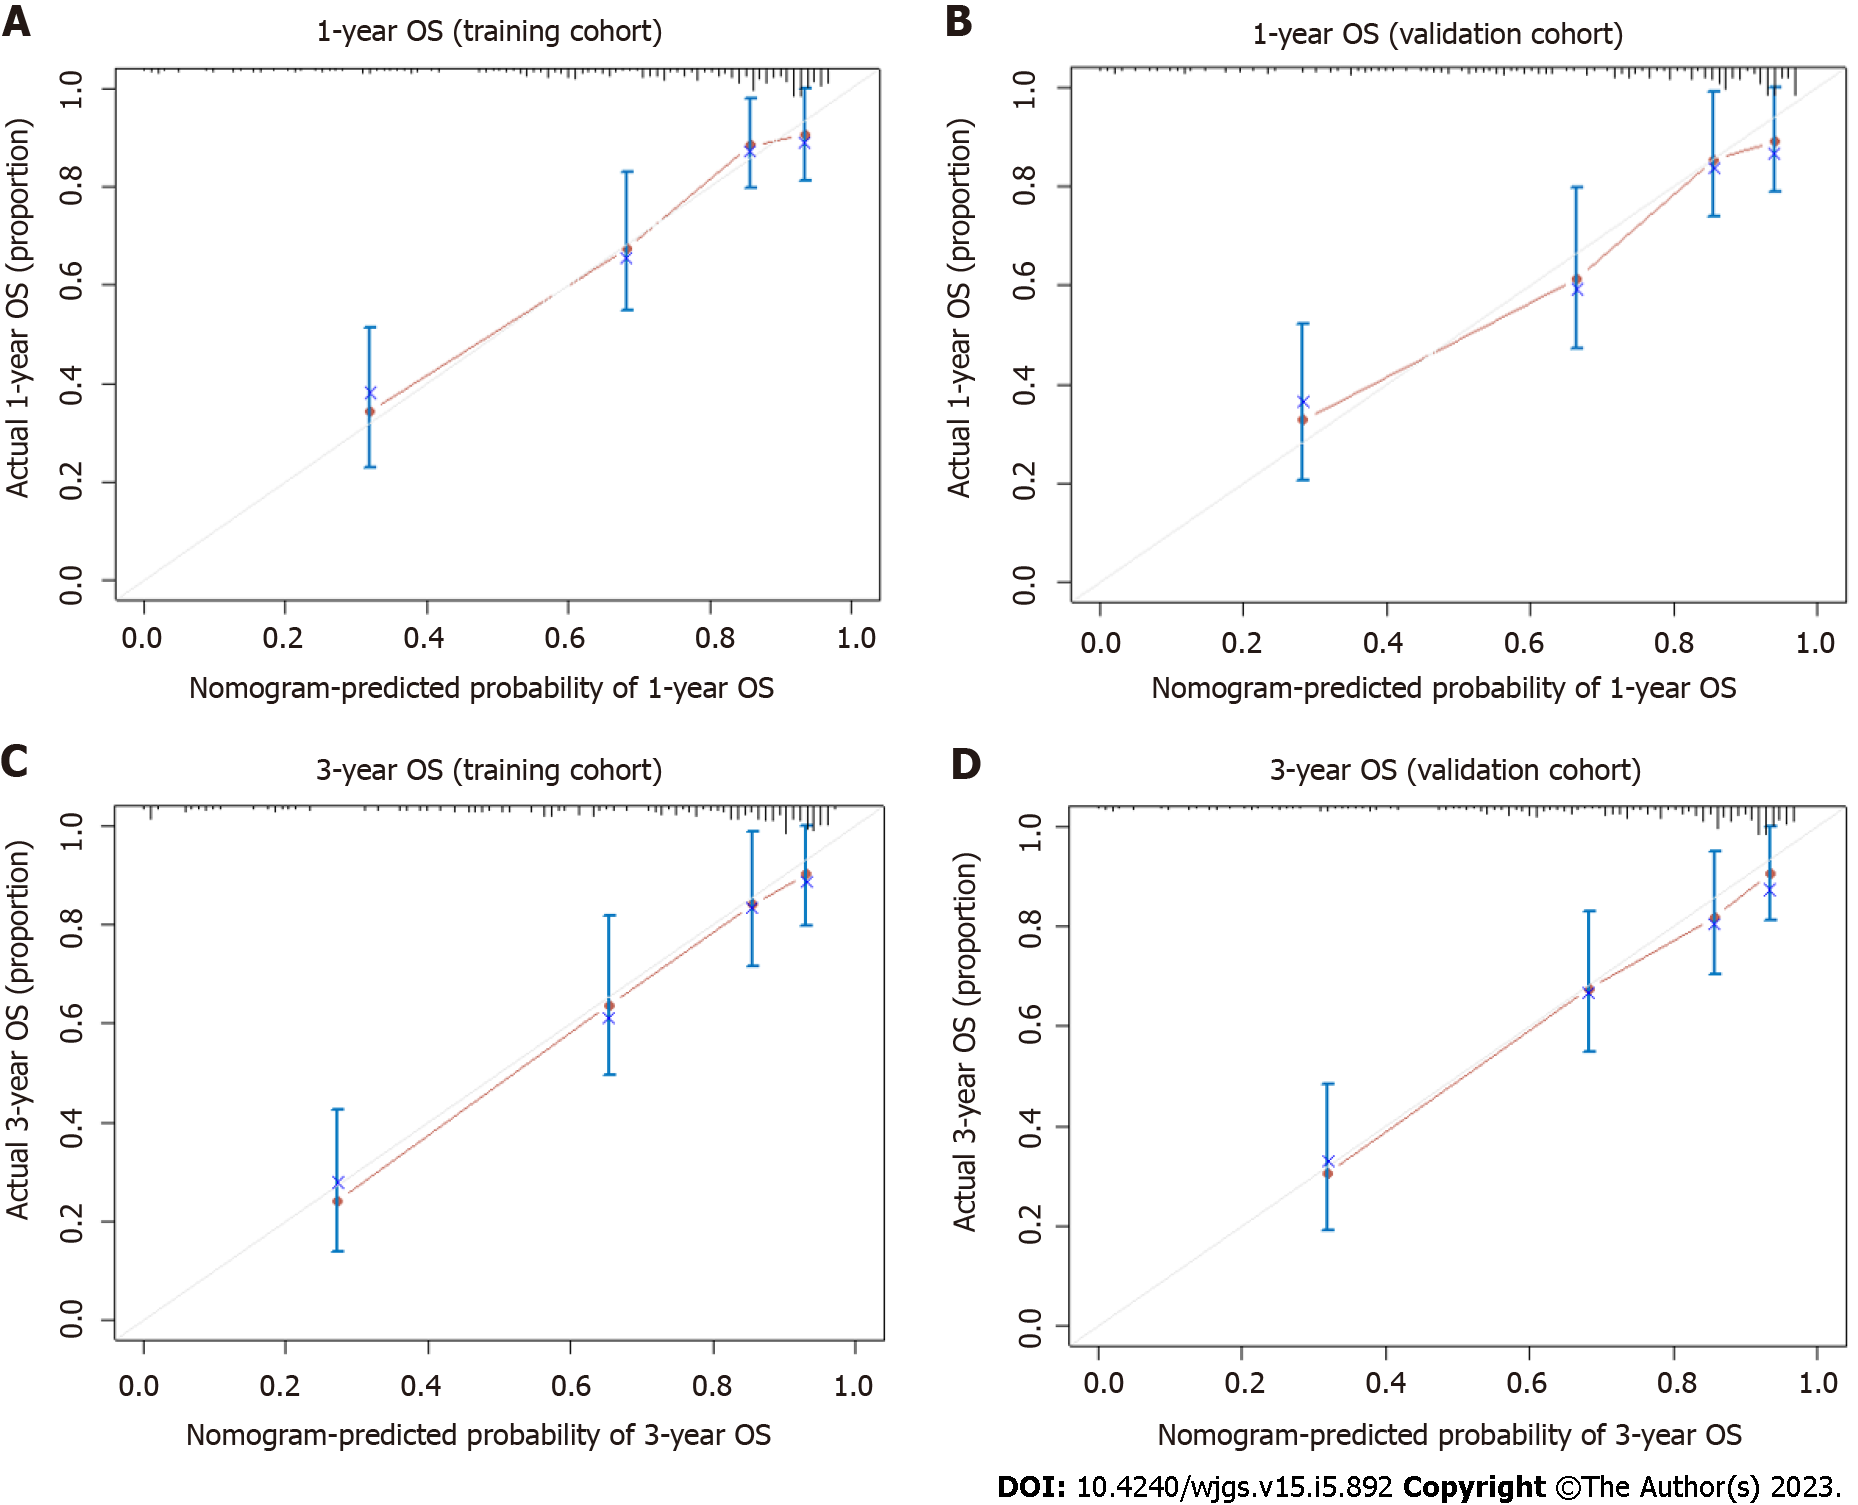
Figure 4 Calibration curves of 1- and 3-yr overall survival for elderly colorectal cancer patients.
A: 1-yr overall survival (OS) of the training cohort; B: 1-yr OS of the validation cohort; C: 3-yr OS of the training cohort; D: 3-yr OS of the validation cohort. The grey line represented the optimal reference line where the predicted survival probability corresponded to the observed OS rates. The red dots obtained by bootstrapping (re-sample size: 1000) represented the performance of the constructed nomogram. The greater the proximity of the solid red line to the grey line, the more precisely the nomogram model predicted the OS probability. OS: Overall survival.
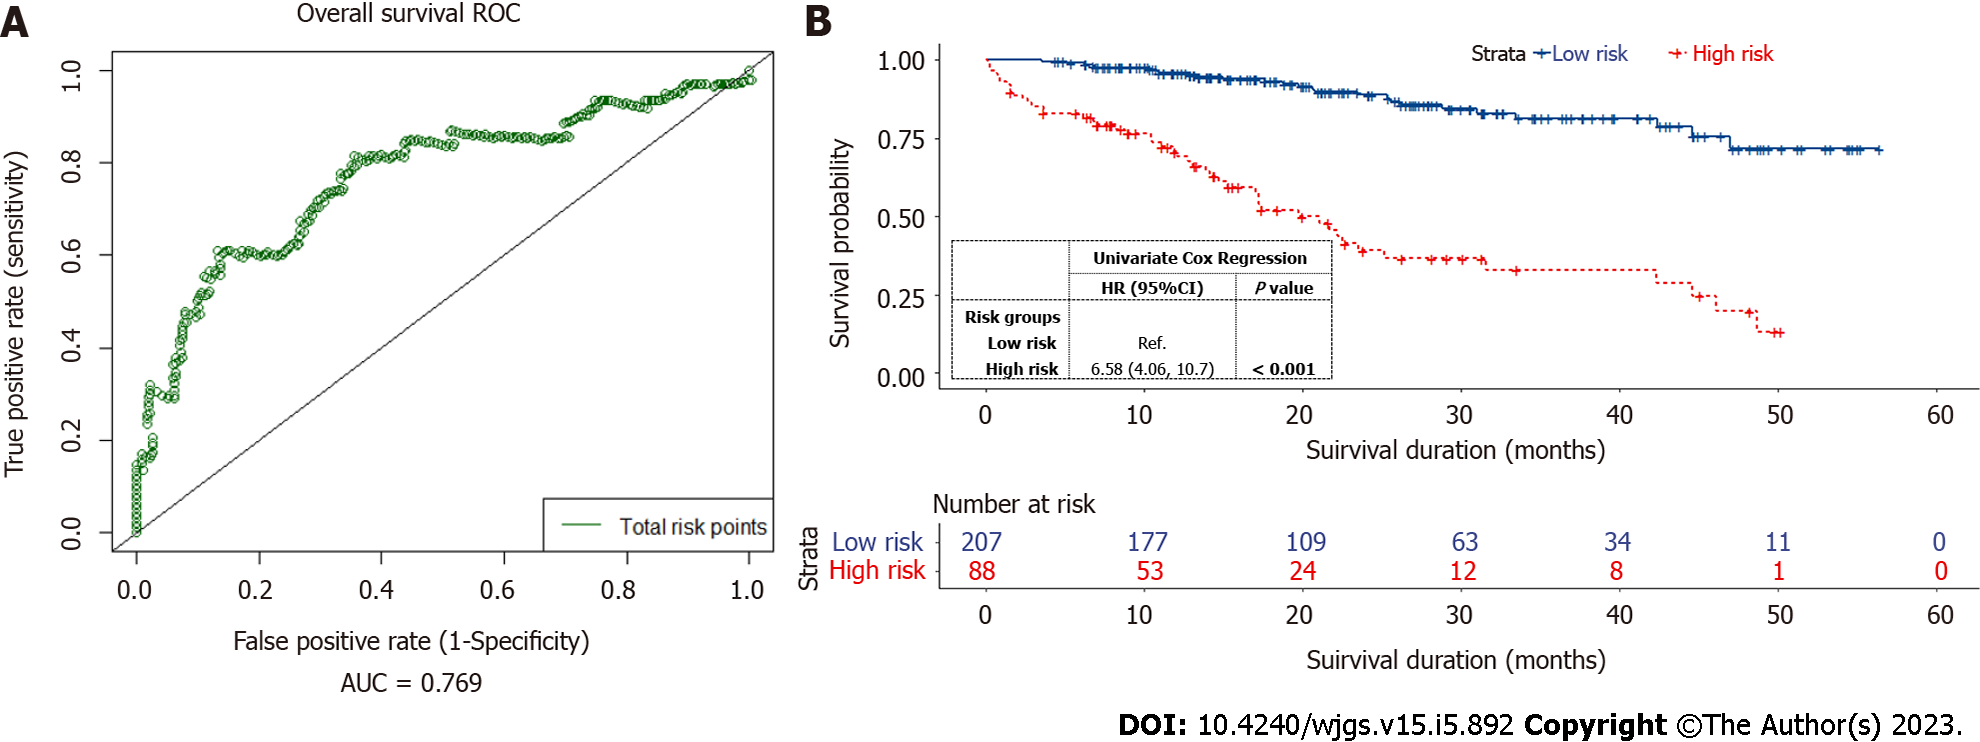
Figure 5 Overall survival of elderly colorectal cancer patients stratified by the optimal risk threshold into low-risk and high-risk groups.
A: A time-dependent survival receiver operating characteristic curve using the total risk points generated by the nomogram for all patients. The green line indicated an area under the receiver operating characteristic curve of 0.769; B: Kaplan-Meier curves for the overall survival of patients in low- and high-risk groups, based on the optimal cut-off risk point of 81. ROC: Receiver operating characteristic; AUC: Area under the receiver operating characteristic curve.
- Citation: Chok AY, Zhao Y, Chen HLR, Tan IEH, Chew DHW, Zhao Y, Au MKH, Tan EJKW. Elderly patients over 80 years undergoing colorectal cancer resection: Development and validation of a predictive nomogram for survival. World J Gastrointest Surg 2023; 15(5): 892-905
- URL: https://www.wjgnet.com/1948-9366/full/v15/i5/892.htm
- DOI: https://dx.doi.org/10.4240/wjgs.v15.i5.892


