Copyright
©The Author(s) 2023.
World J Gastrointest Surg. Apr 27, 2023; 15(4): 664-673
Published online Apr 27, 2023. doi: 10.4240/wjgs.v15.i4.664
Published online Apr 27, 2023. doi: 10.4240/wjgs.v15.i4.664
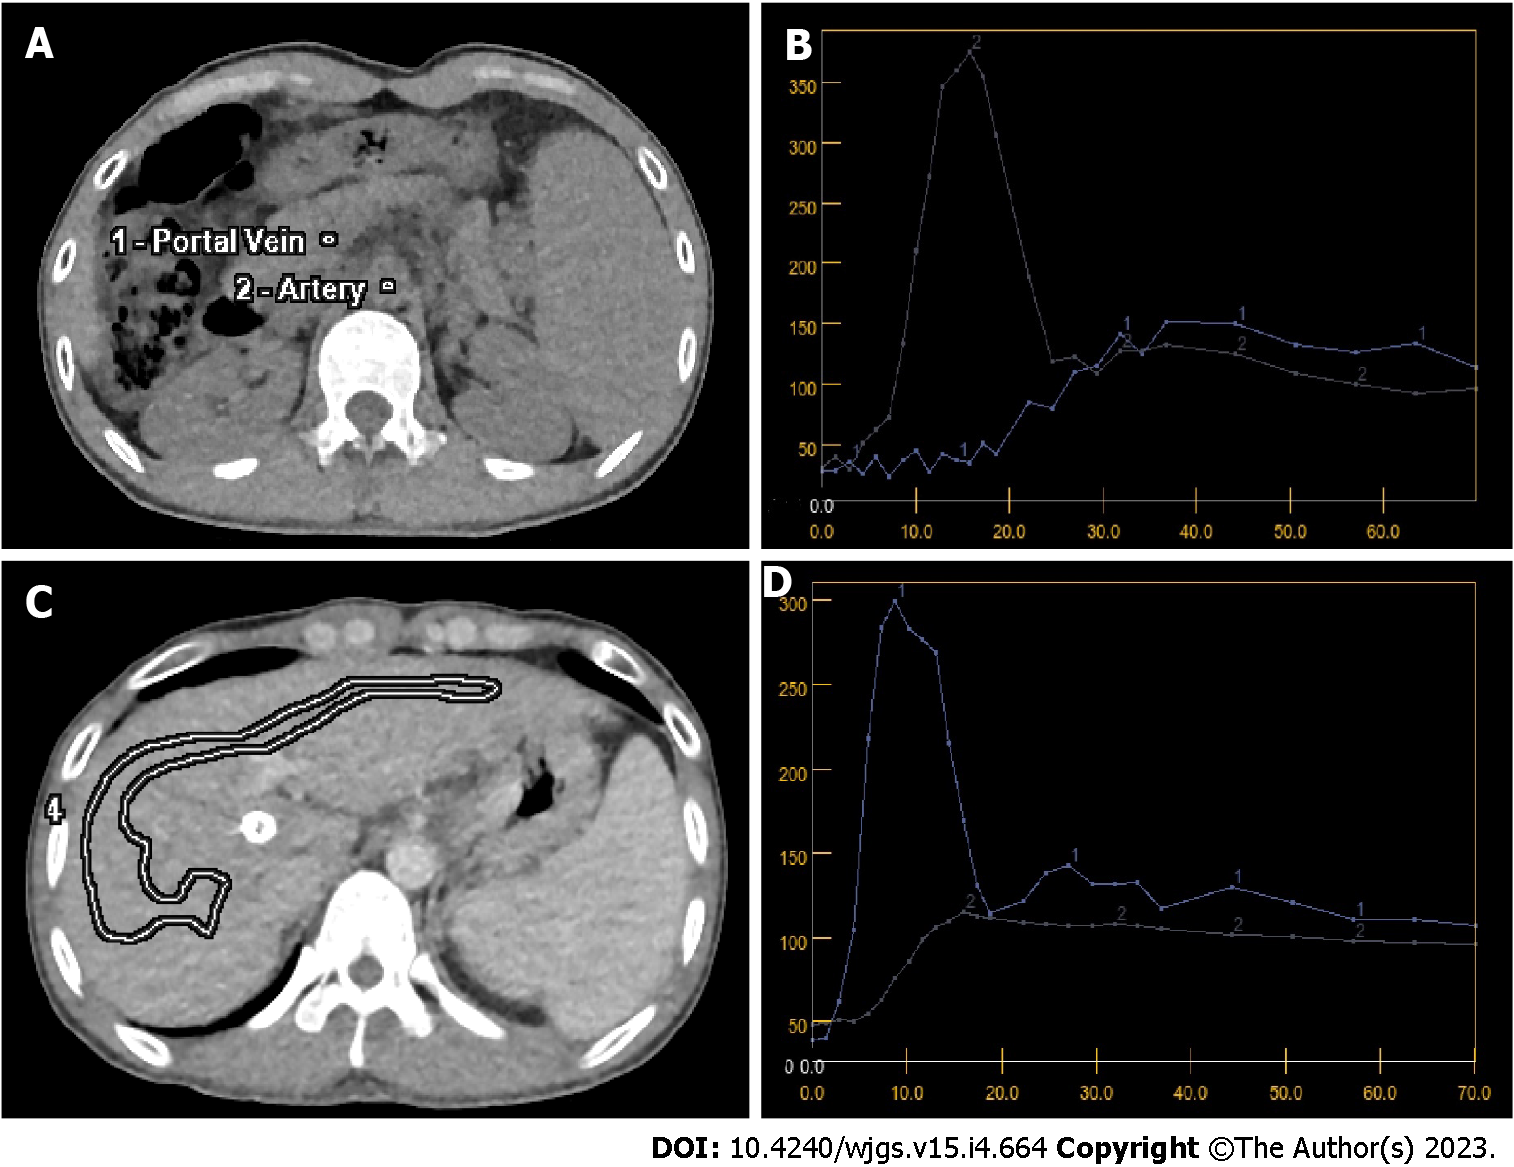
Figure 1 Baseline of computed tomography maps and time density curves before and after transjugular intrahepatic portosystemic shunt.
A: Baseline of computed tomography (CT) map with regions of interests for input arterial abdominal artery and portal vein before transjugular intrahepatic portosystemic shunt (TIPS); B: Time-density curve of CT perfusion before TIPS, and axis X is time axis with unit of second, while axis Y is density axis with unit of Hounsfield; C: Region of interest in liver parenchyma for perfusion parameters after TIPS; D: Time-density curve of CT perfusion after TIPS, and axis X is time axis with unit of second, while axis Y is density axis with unit of Hounsfield.
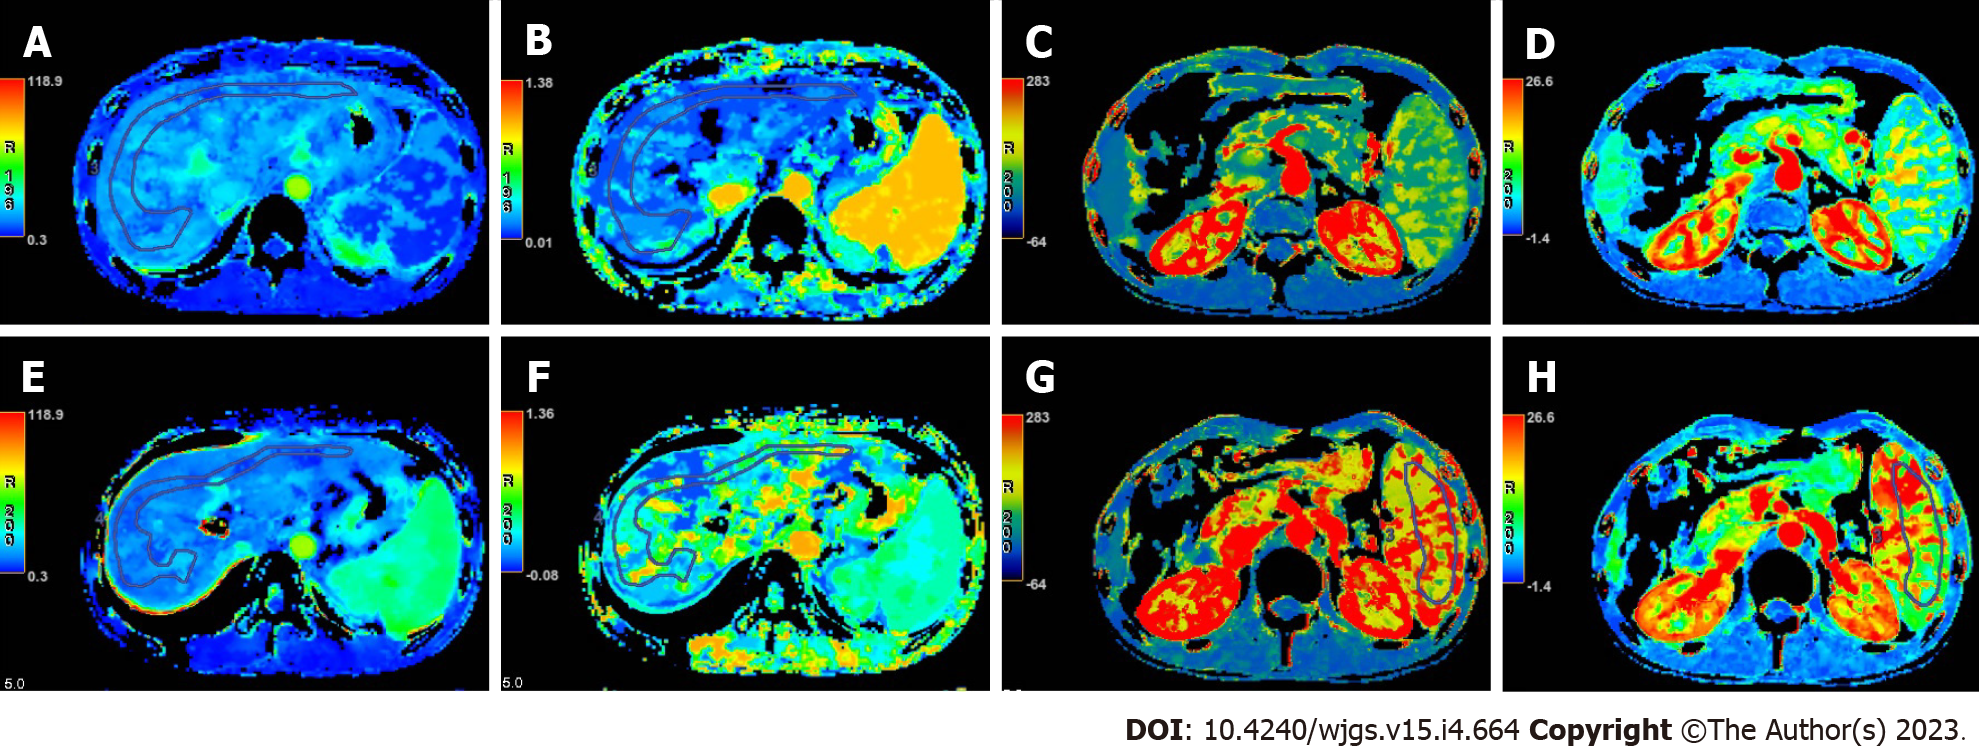
Figure 2 A 37-year-old patient with 2 times gastroesophageal bleeding for more than 10-year history of hepatitis B.
A-D: Colored map of computed tomography (CT) perfusion parameters were shown as liver blood volume (LBV), hepatic arterial fraction (HAF), spleen blood flow (SBF), and spleen blood volume (SBV) before transjugular intrahepatic portosystemic shunt (TIPS); E-H: Colored map of CT perfusion parameters were shown as LBV, HAF, SBF, and SBV after TIPS. All CT perfusion parameters were calculated with average of multiple irregular regions of interest in the color maps, which showed decreased LBV and increased HAF, SBF and SBV.
- Citation: Dong J, Zhang Y, Wu YF, Yue ZD, Fan ZH, Zhang CY, Liu FQ, Wang L. Computed tomography perfusion in differentiating portal hypertension: A correlation study with hepatic venous pressure gradient. World J Gastrointest Surg 2023; 15(4): 664-673
- URL: https://www.wjgnet.com/1948-9366/full/v15/i4/664.htm
- DOI: https://dx.doi.org/10.4240/wjgs.v15.i4.664


