Copyright
©The Author(s) 2023.
World J Gastrointest Surg. Feb 27, 2023; 15(2): 273-286
Published online Feb 27, 2023. doi: 10.4240/wjgs.v15.i2.273
Published online Feb 27, 2023. doi: 10.4240/wjgs.v15.i2.273
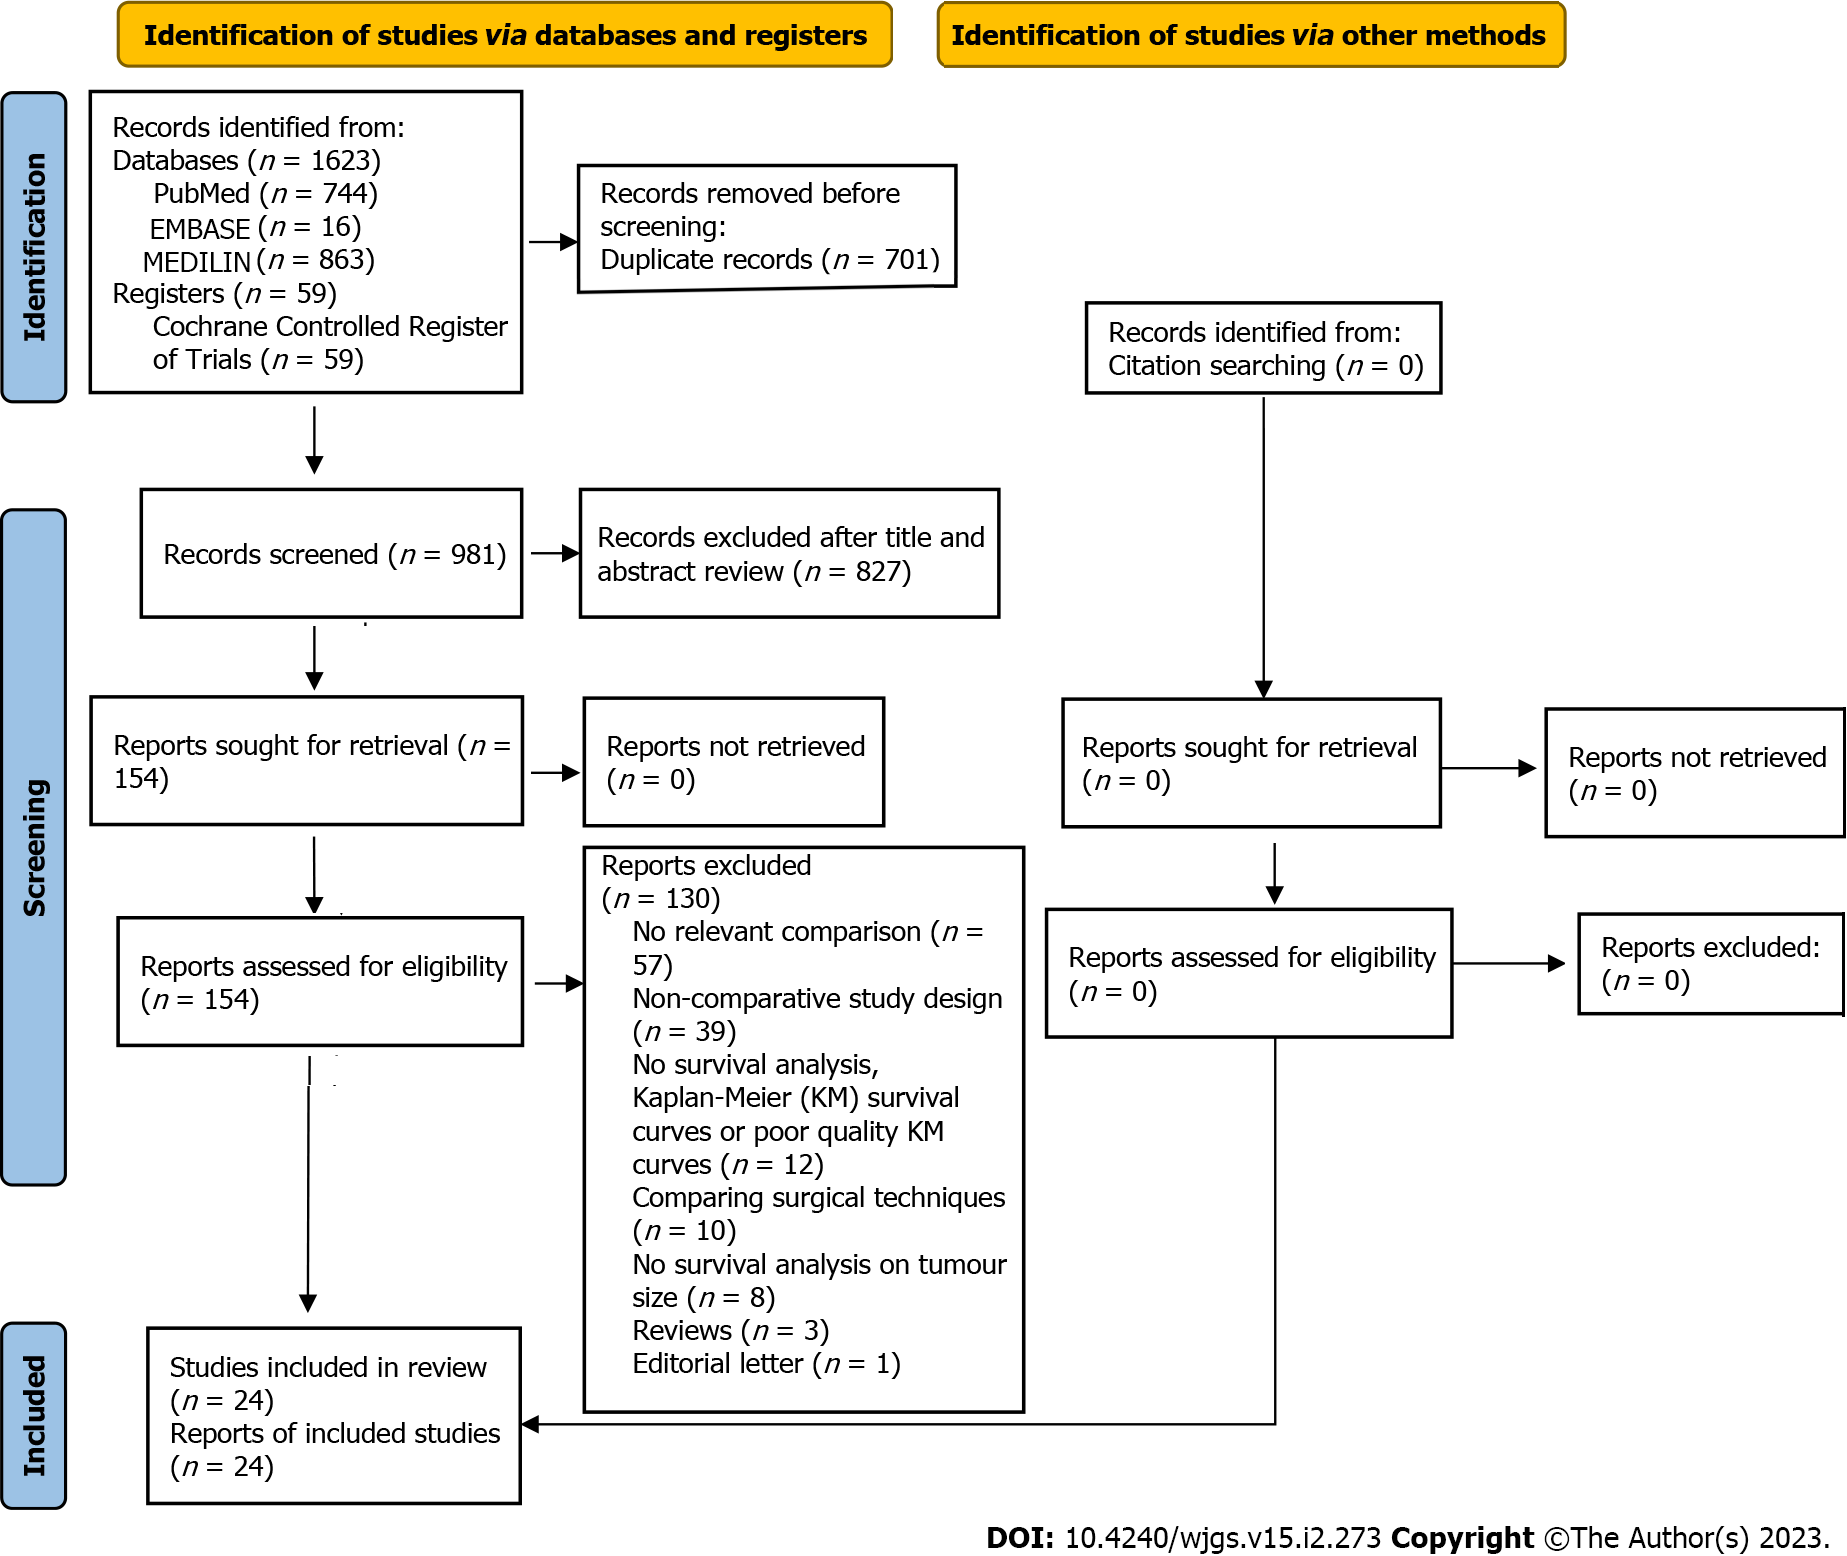
Figure 1 Preferred Reporting Items for Systematic Reviews and Meta-Analysis flow diagram.
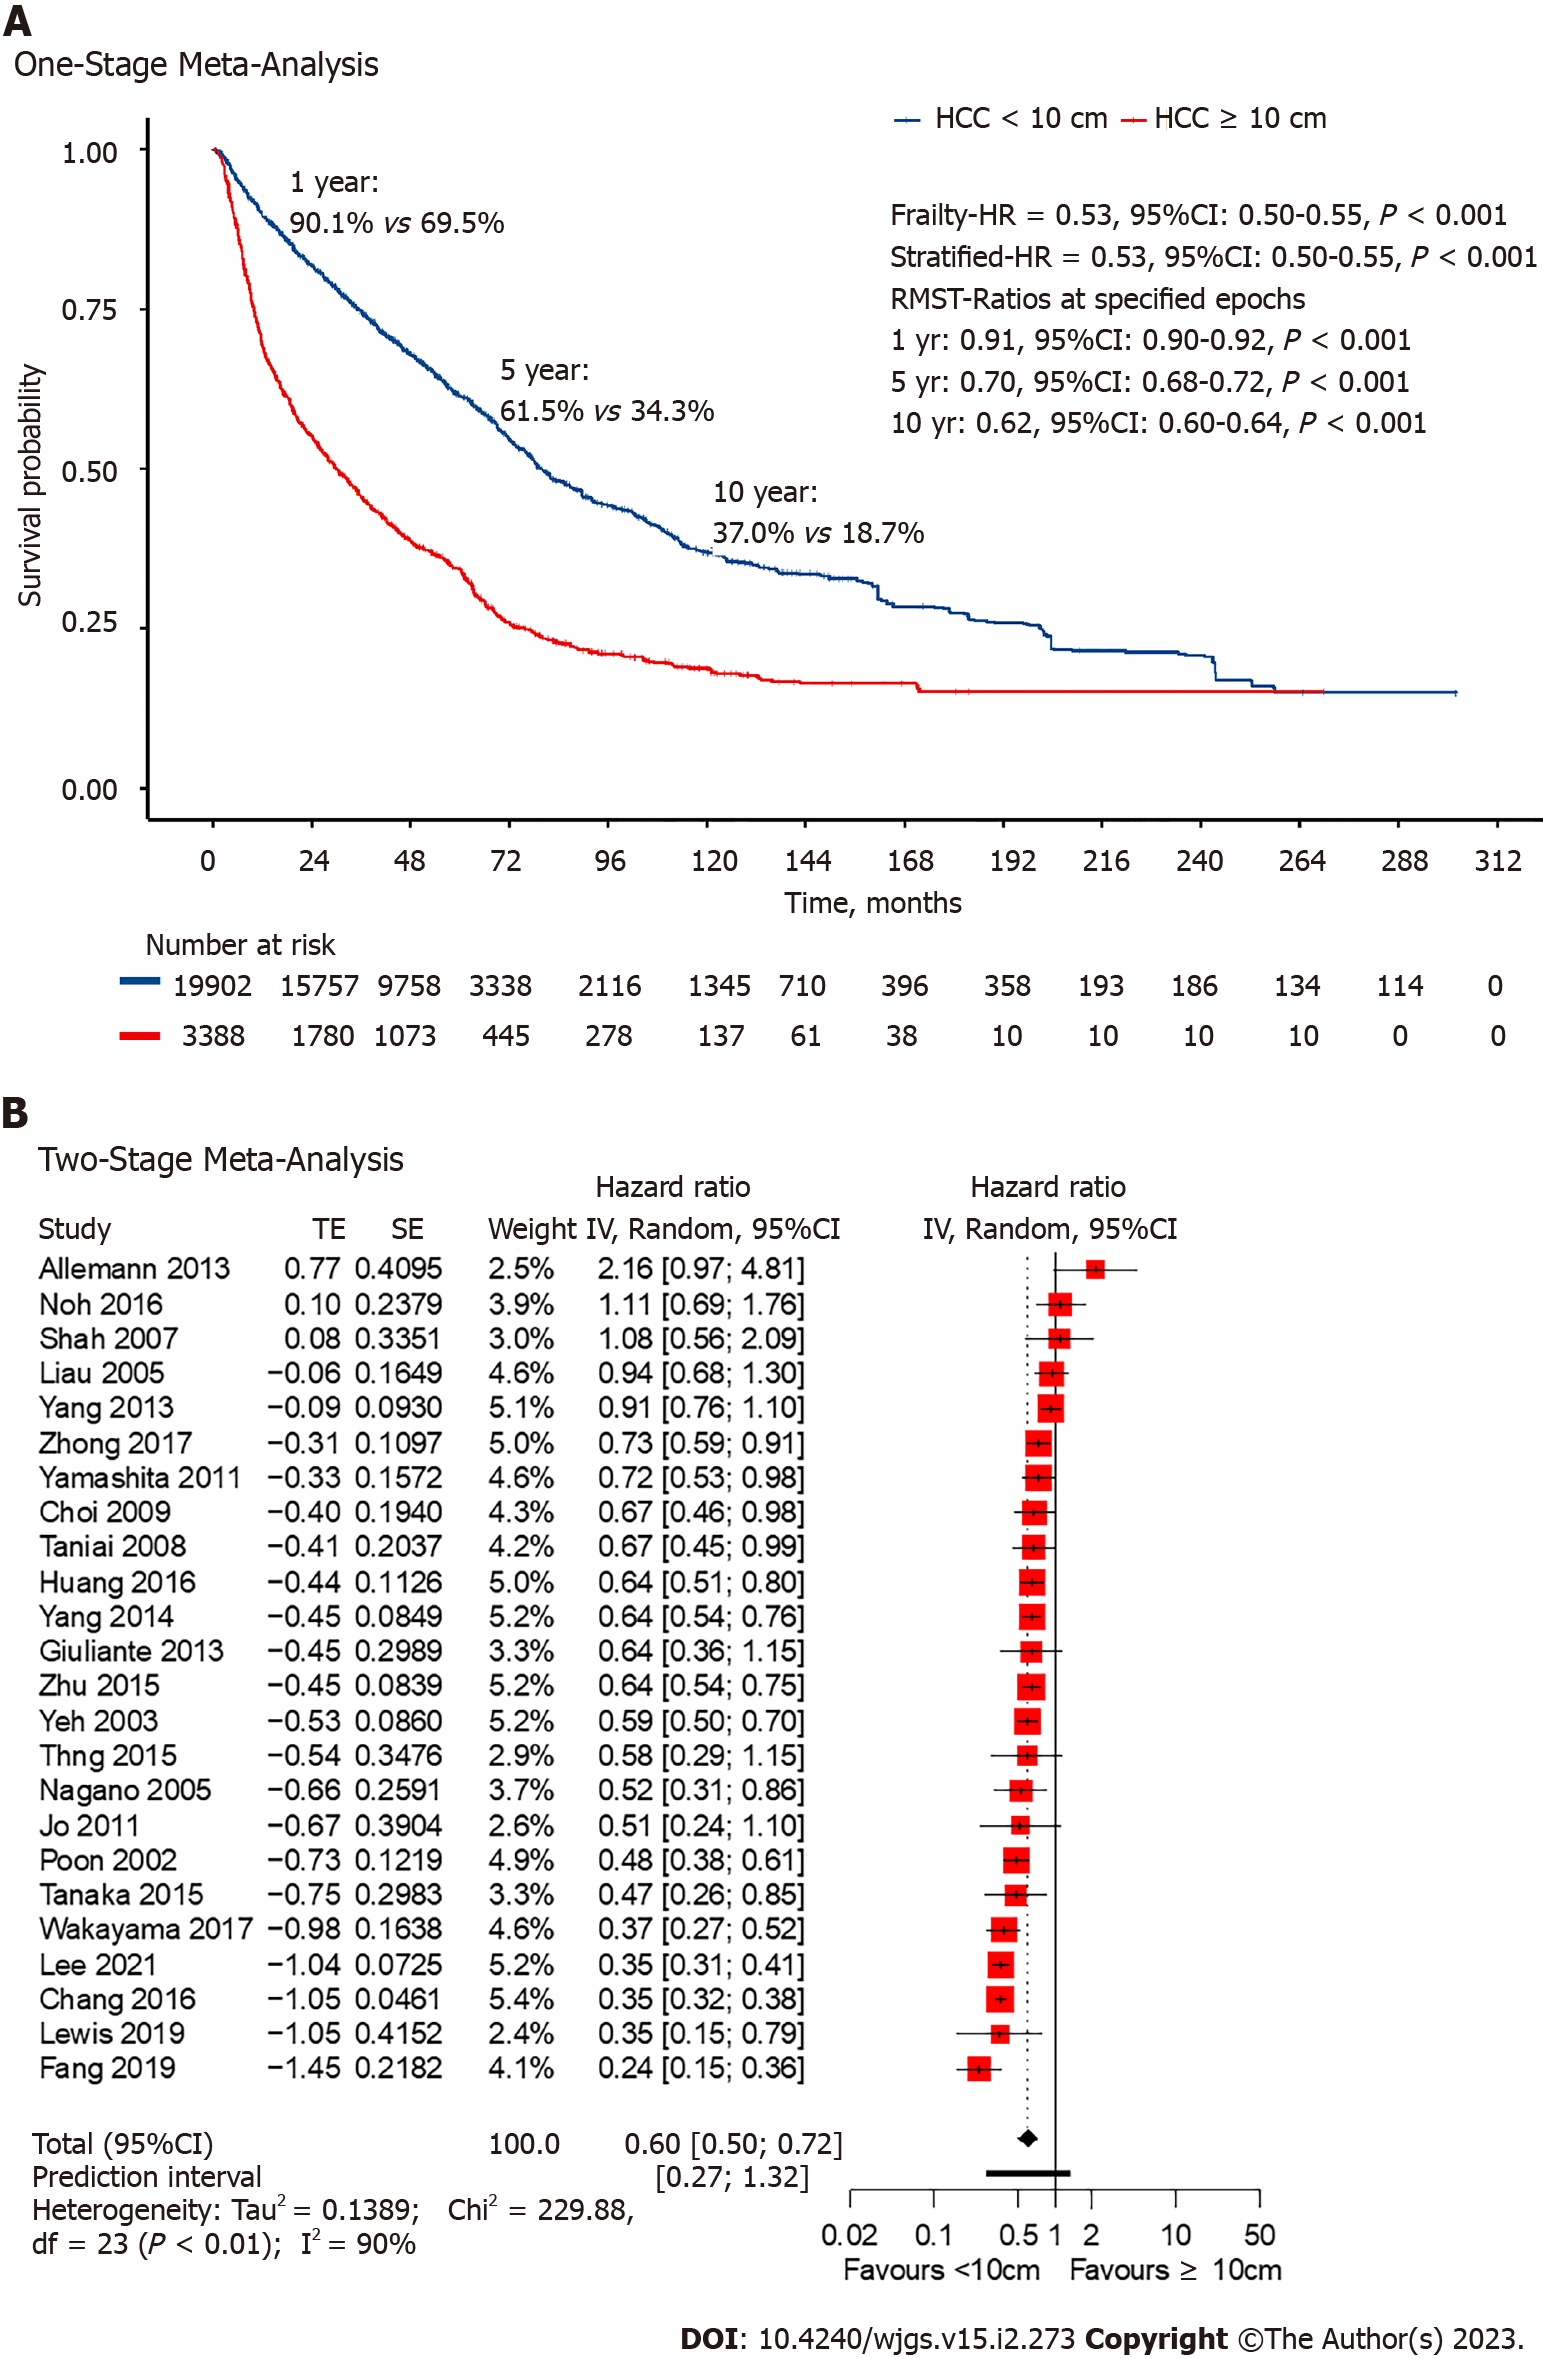
Figure 2 Overall survival curves, numbers-at-risk table and Forest plot.
A: Overall survival (OS) curves and numbers-at-risk table for giant vs non-giant hepatocellular carcinoma from reconstructed individual patient data; B: OS forest plot. HCC: Hepatocellular carcinoma; HR: Hazard ratio; RMST: Restricted mean survival time.
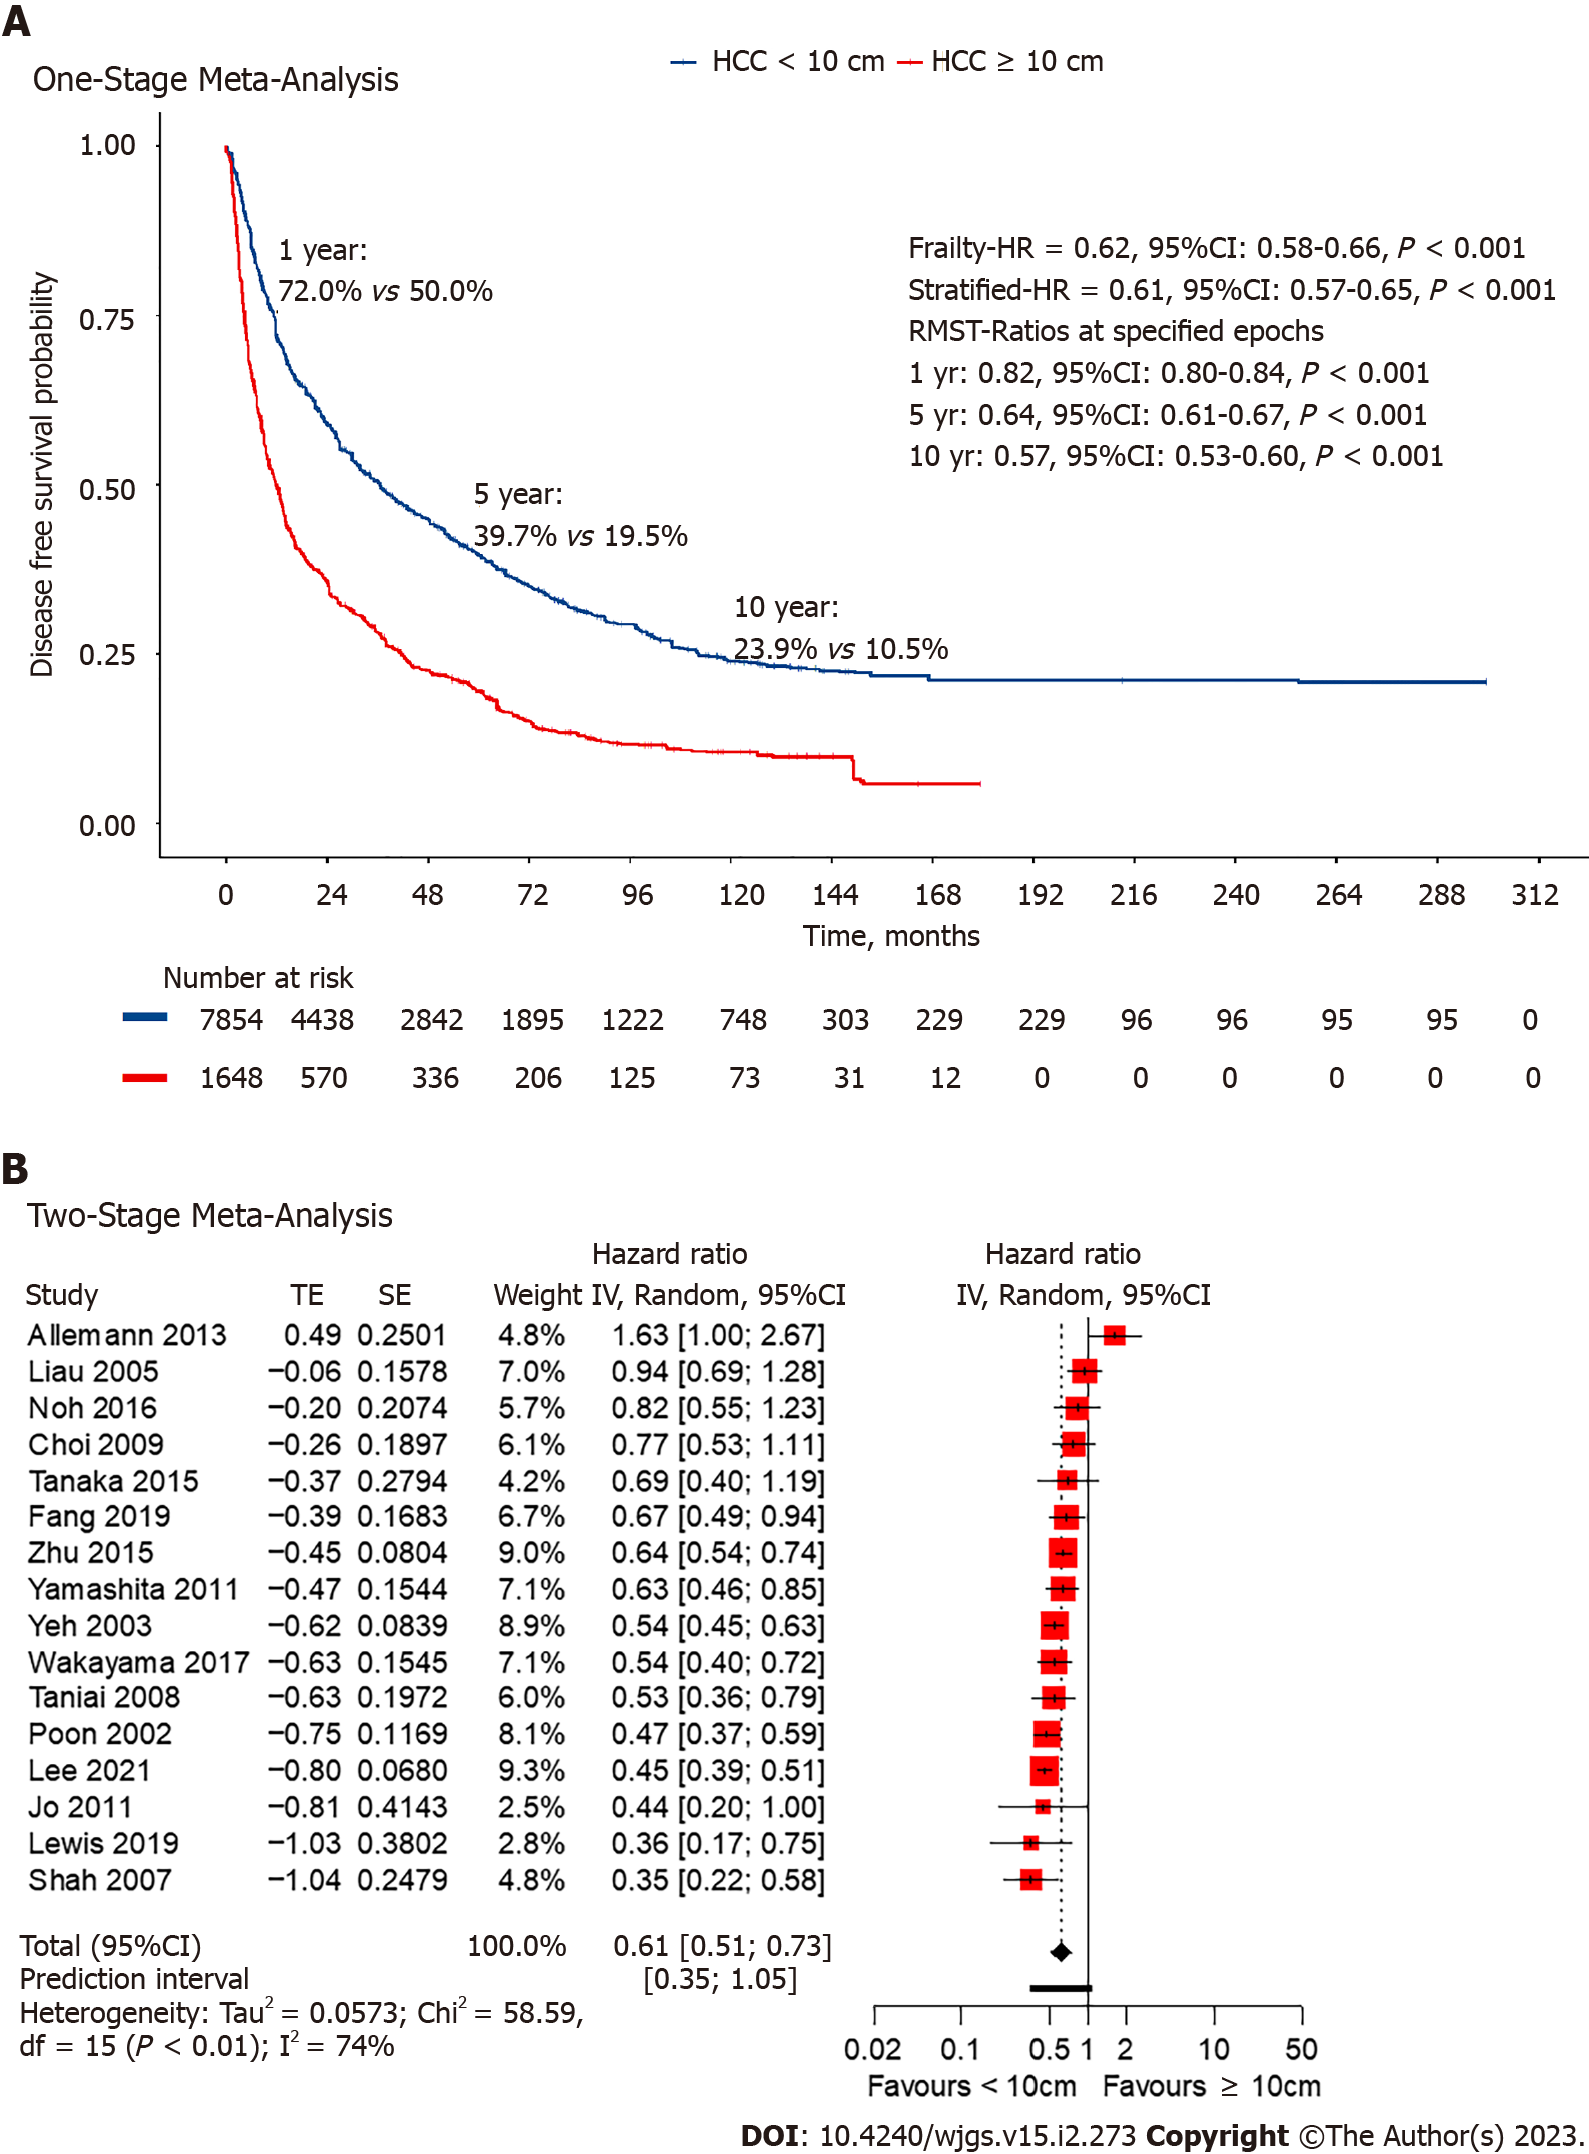
Figure 3 Disease-free survival curve, numbers-at-risk table and Forest plot.
A: Disease-free survival (DFS) curves and numbers-at-risk table for giant vs non-giant hepatocellular carcinoma from reconstructed individual patient data; B: DFS forest plot. HCC: Hepatocellular carcinoma; HR: Hazard ratio; RMST: Restricted mean survival time.
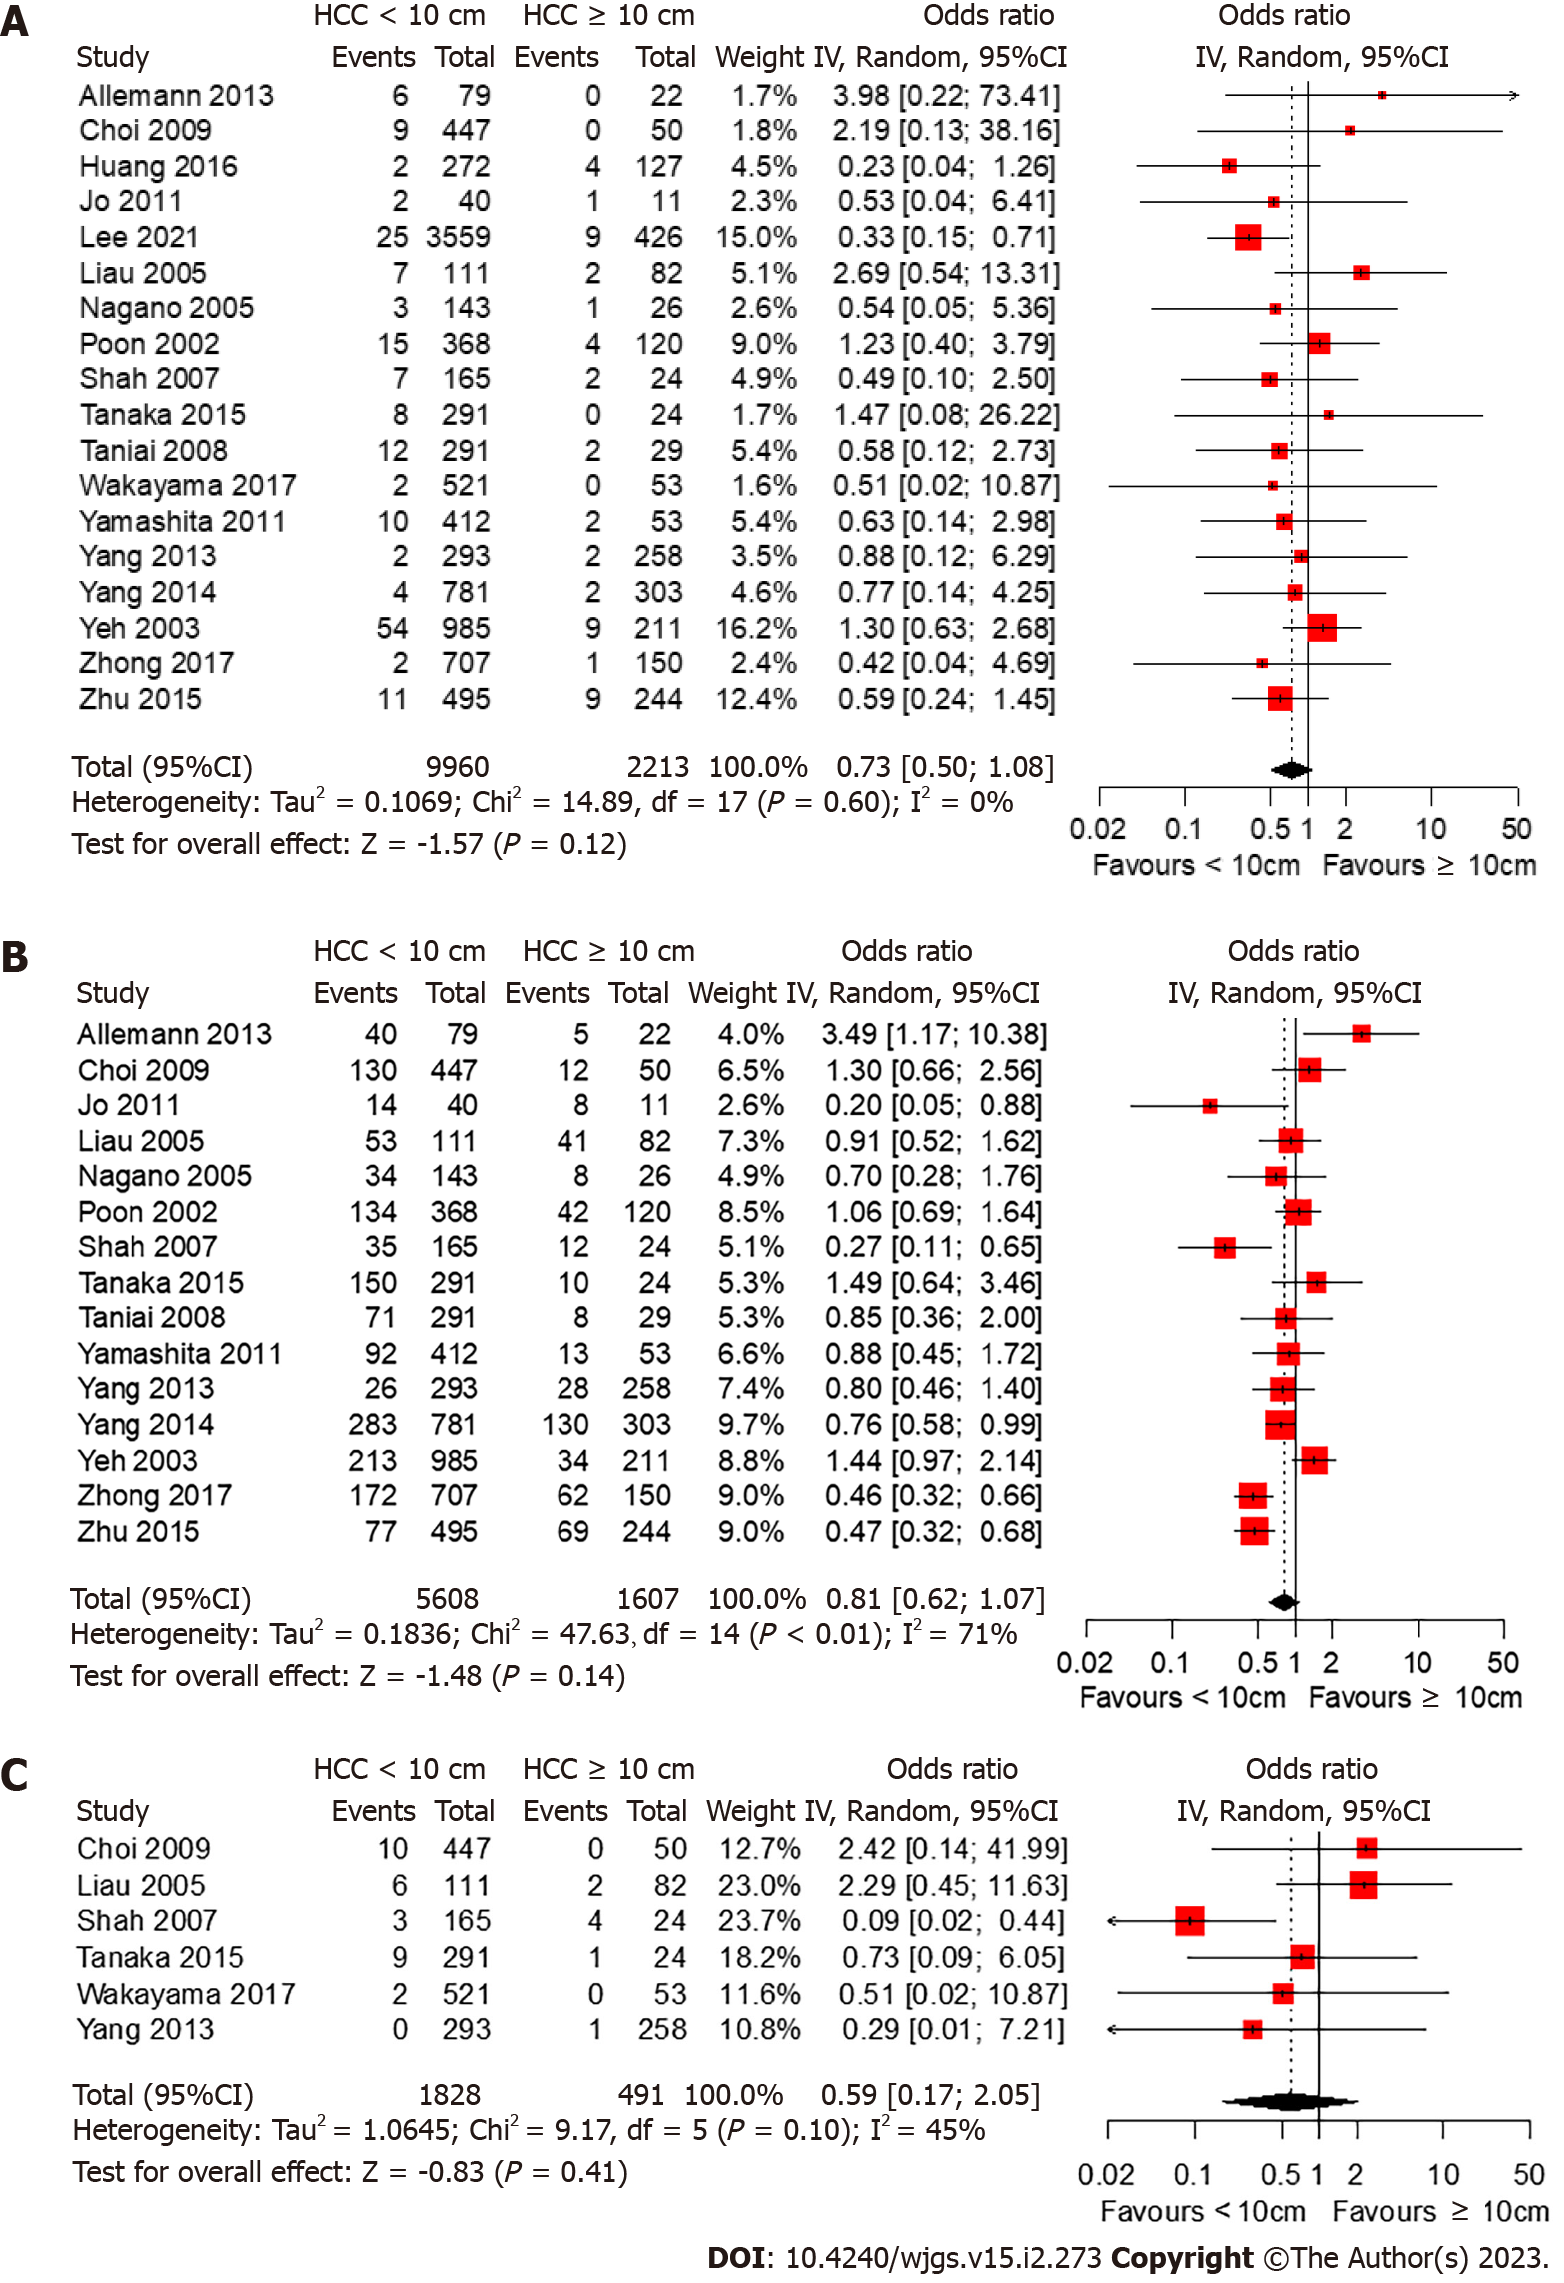
Figure 4 Forest plots for morbidity and 30-d mortality.
A: Forest plot of the 30-d mortality rate; B: Forest plot of the postoperative complication rate; C: Forest plot of post-hepatic liver failure rate. HCC: Hepatocellular carcinoma.
- Citation: Lee AJ, Wu AG, Yew KC, Shelat VG. Does size matter for resection of giant versus non-giant hepatocellular carcinoma? A meta-analysis. World J Gastrointest Surg 2023; 15(2): 273-286
- URL: https://www.wjgnet.com/1948-9366/full/v15/i2/273.htm
- DOI: https://dx.doi.org/10.4240/wjgs.v15.i2.273


