Copyright
©The Author(s) 2023.
World J Gastrointest Surg. Oct 27, 2023; 15(10): 2331-2342
Published online Oct 27, 2023. doi: 10.4240/wjgs.v15.i10.2331
Published online Oct 27, 2023. doi: 10.4240/wjgs.v15.i10.2331
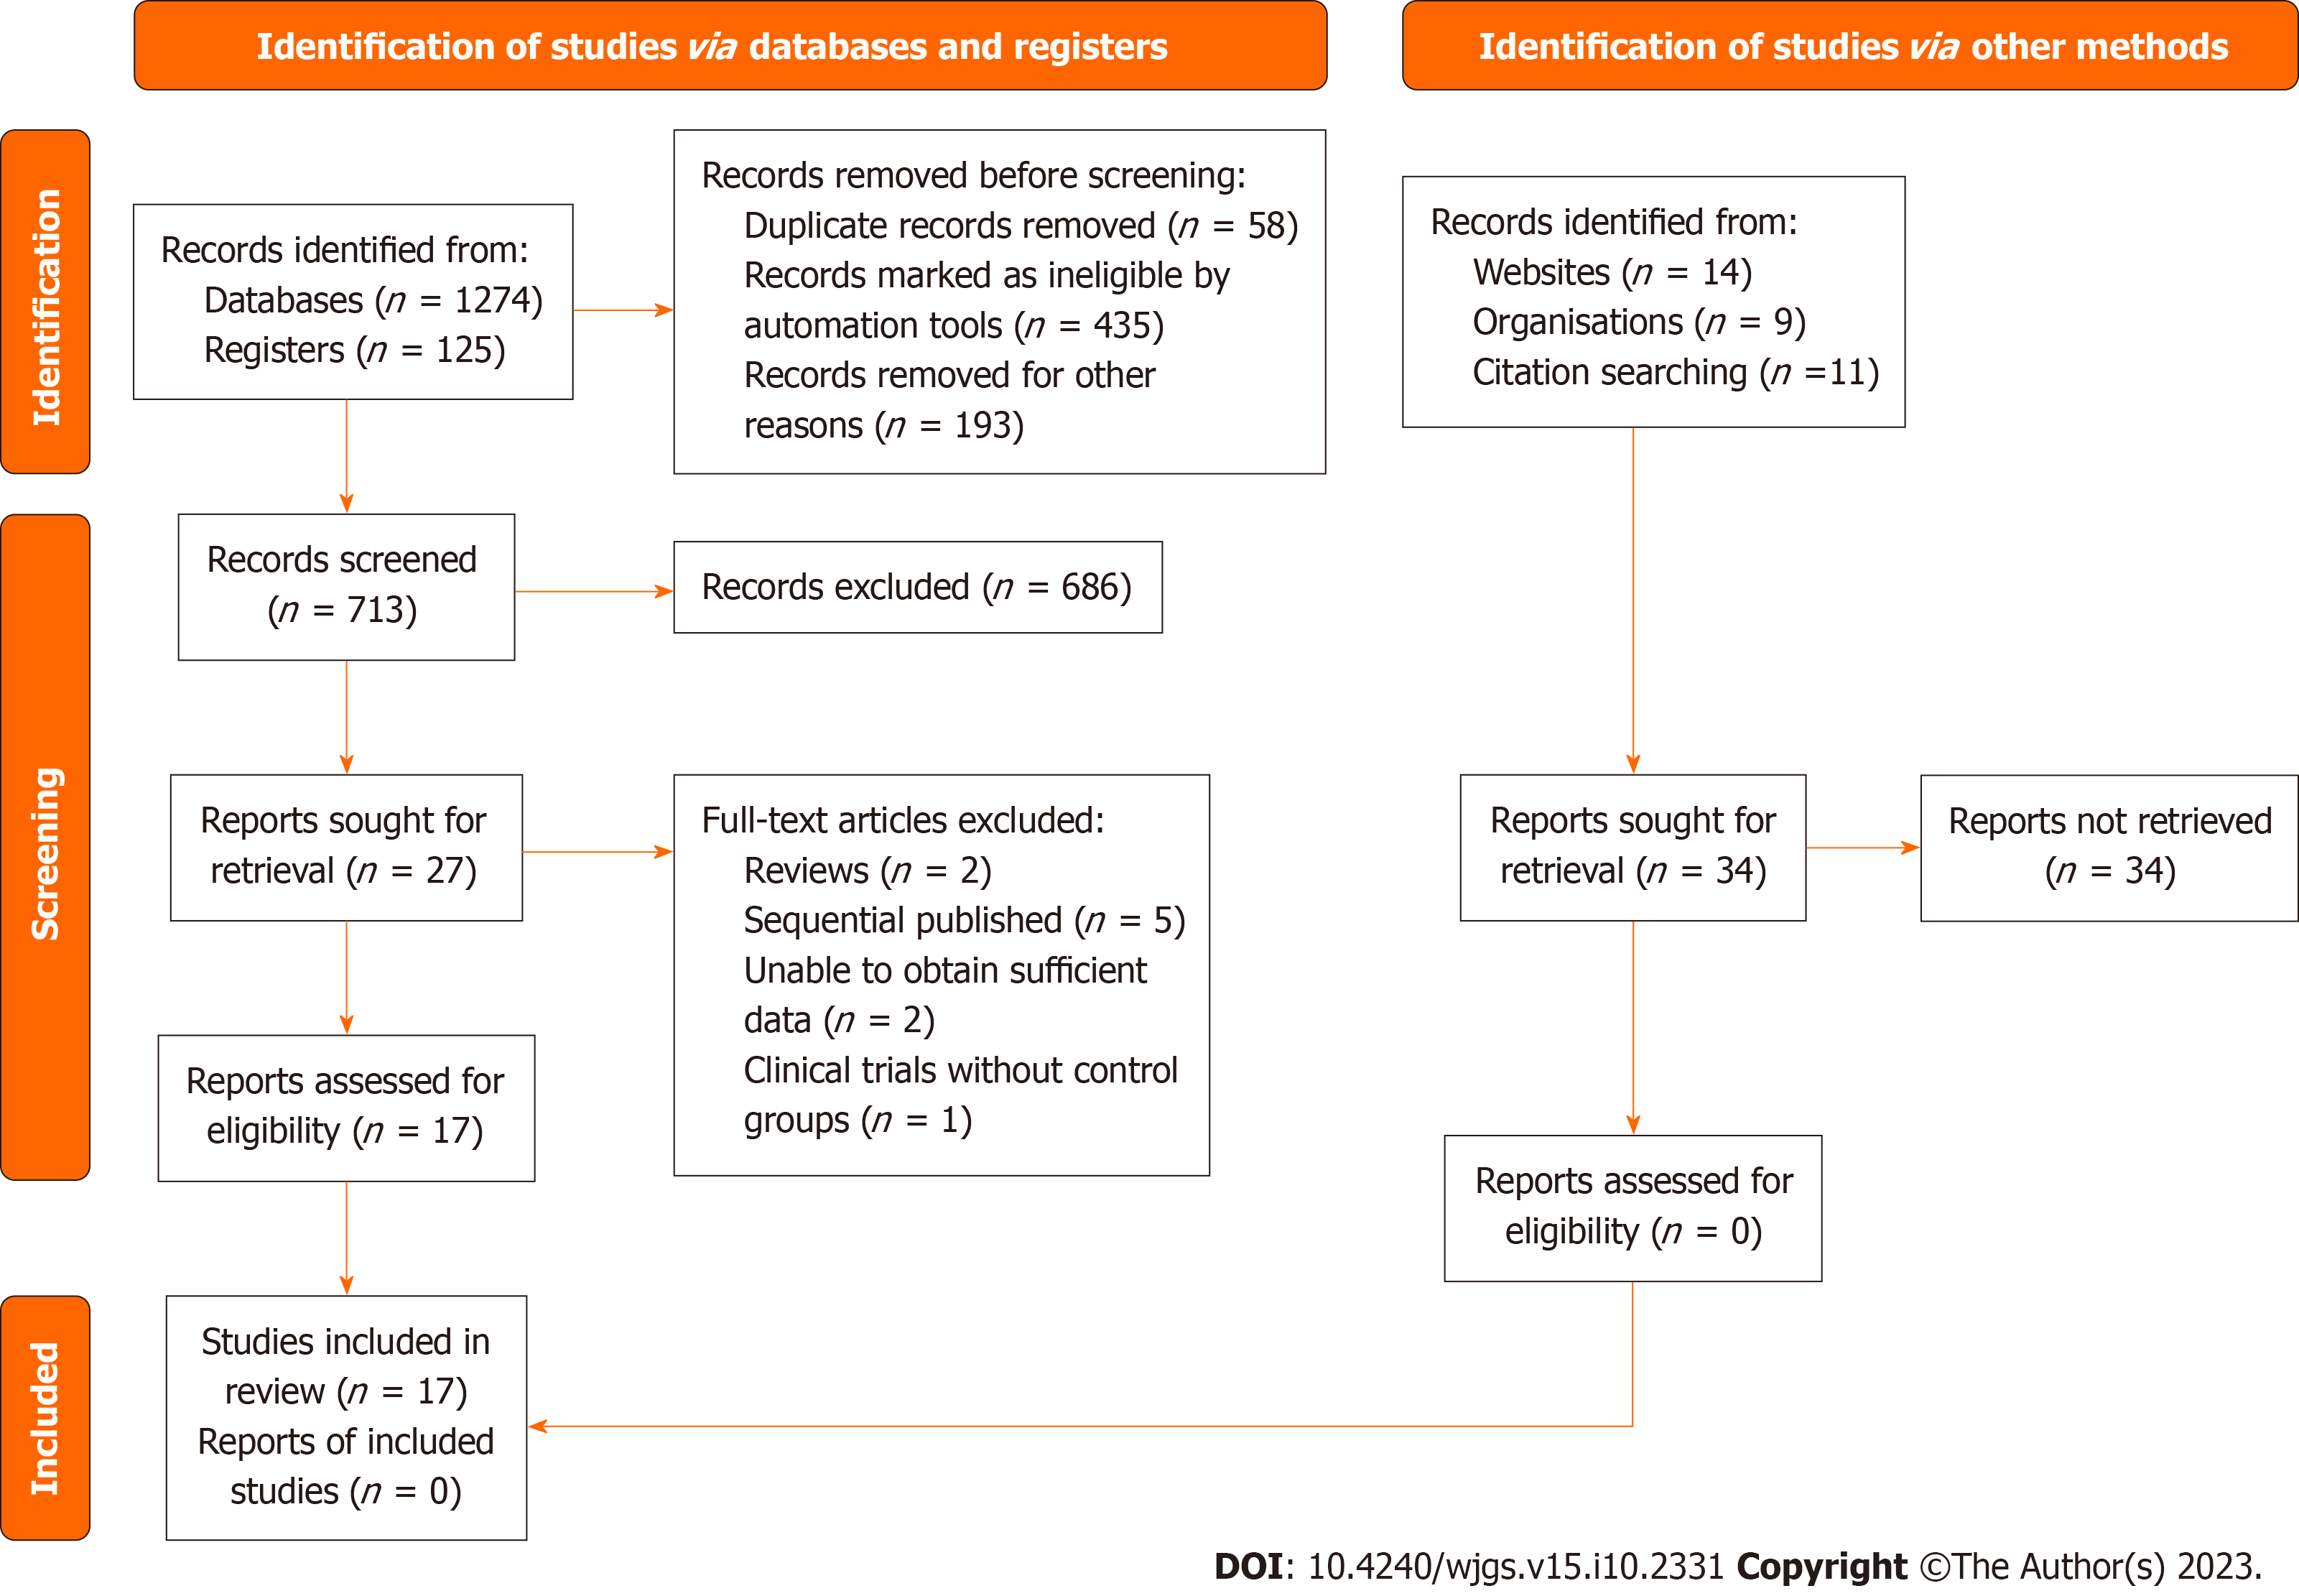
Figure 1 The PRISMA flowchart illustrates the comprehensive review process.
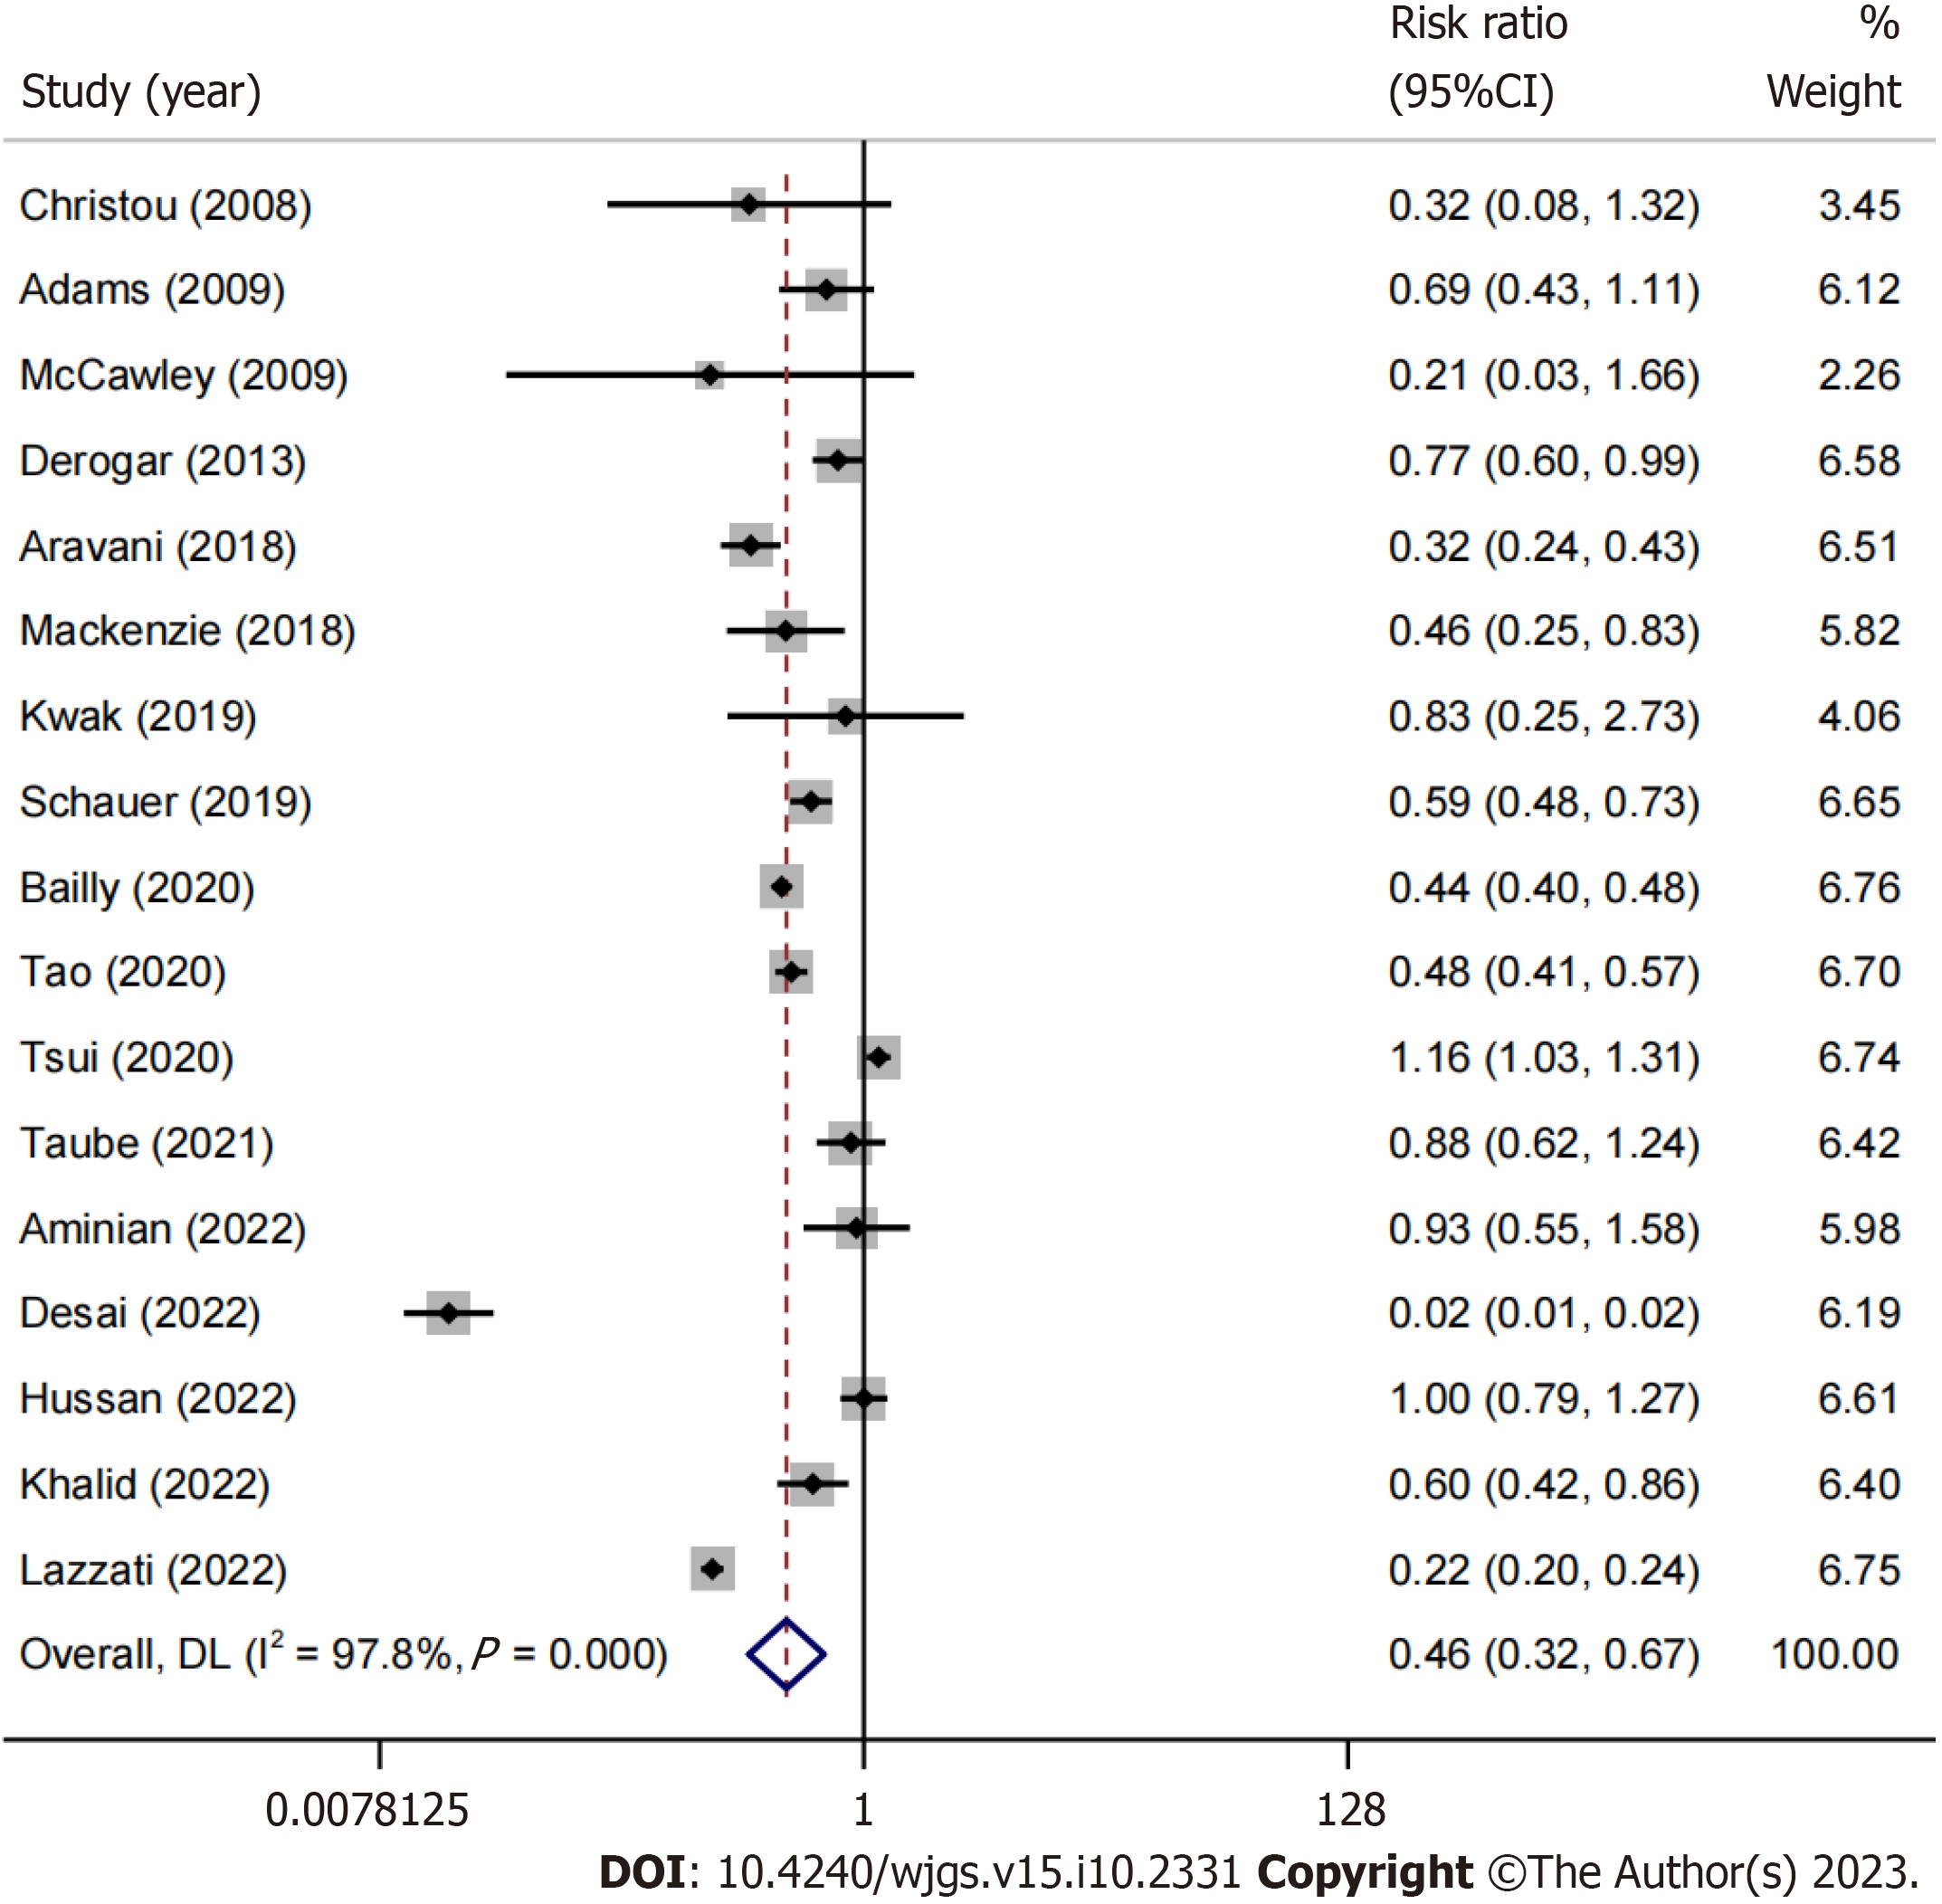
Figure 2 A forest plot contrasting the incidence of colorectal cancer in obese individuals who underwent or did not undergo bariatric surgery.
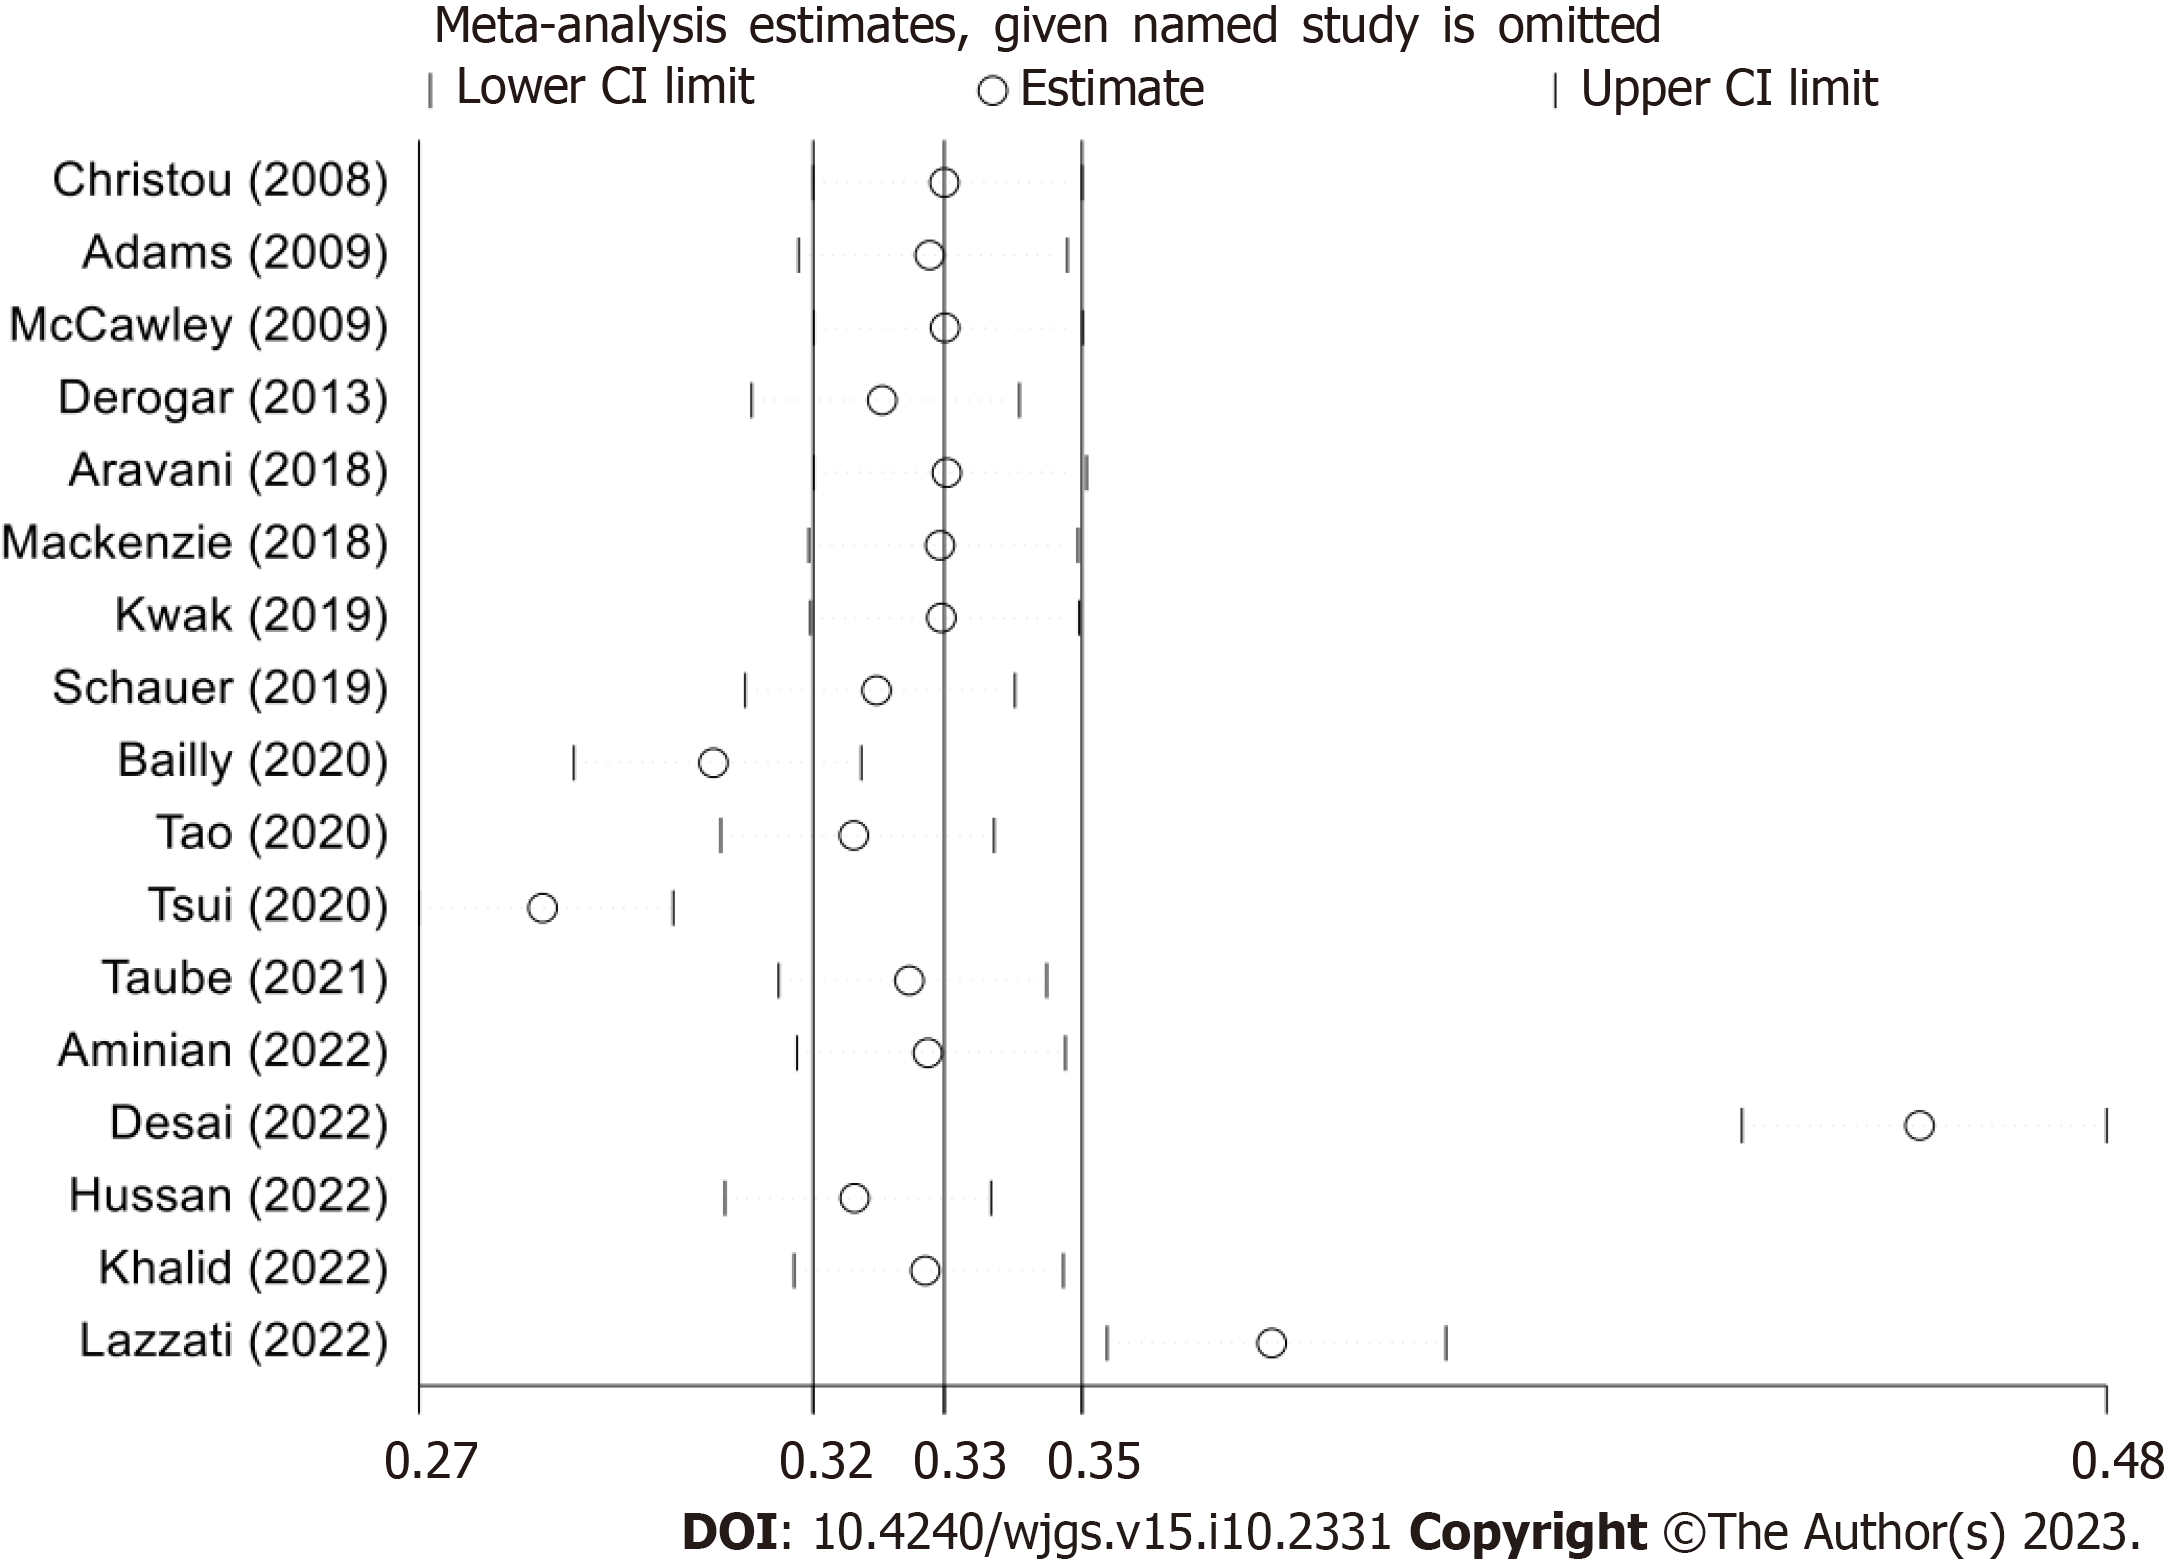
Figure 3 Meta-analysis Estimates (Omitting Named Study).
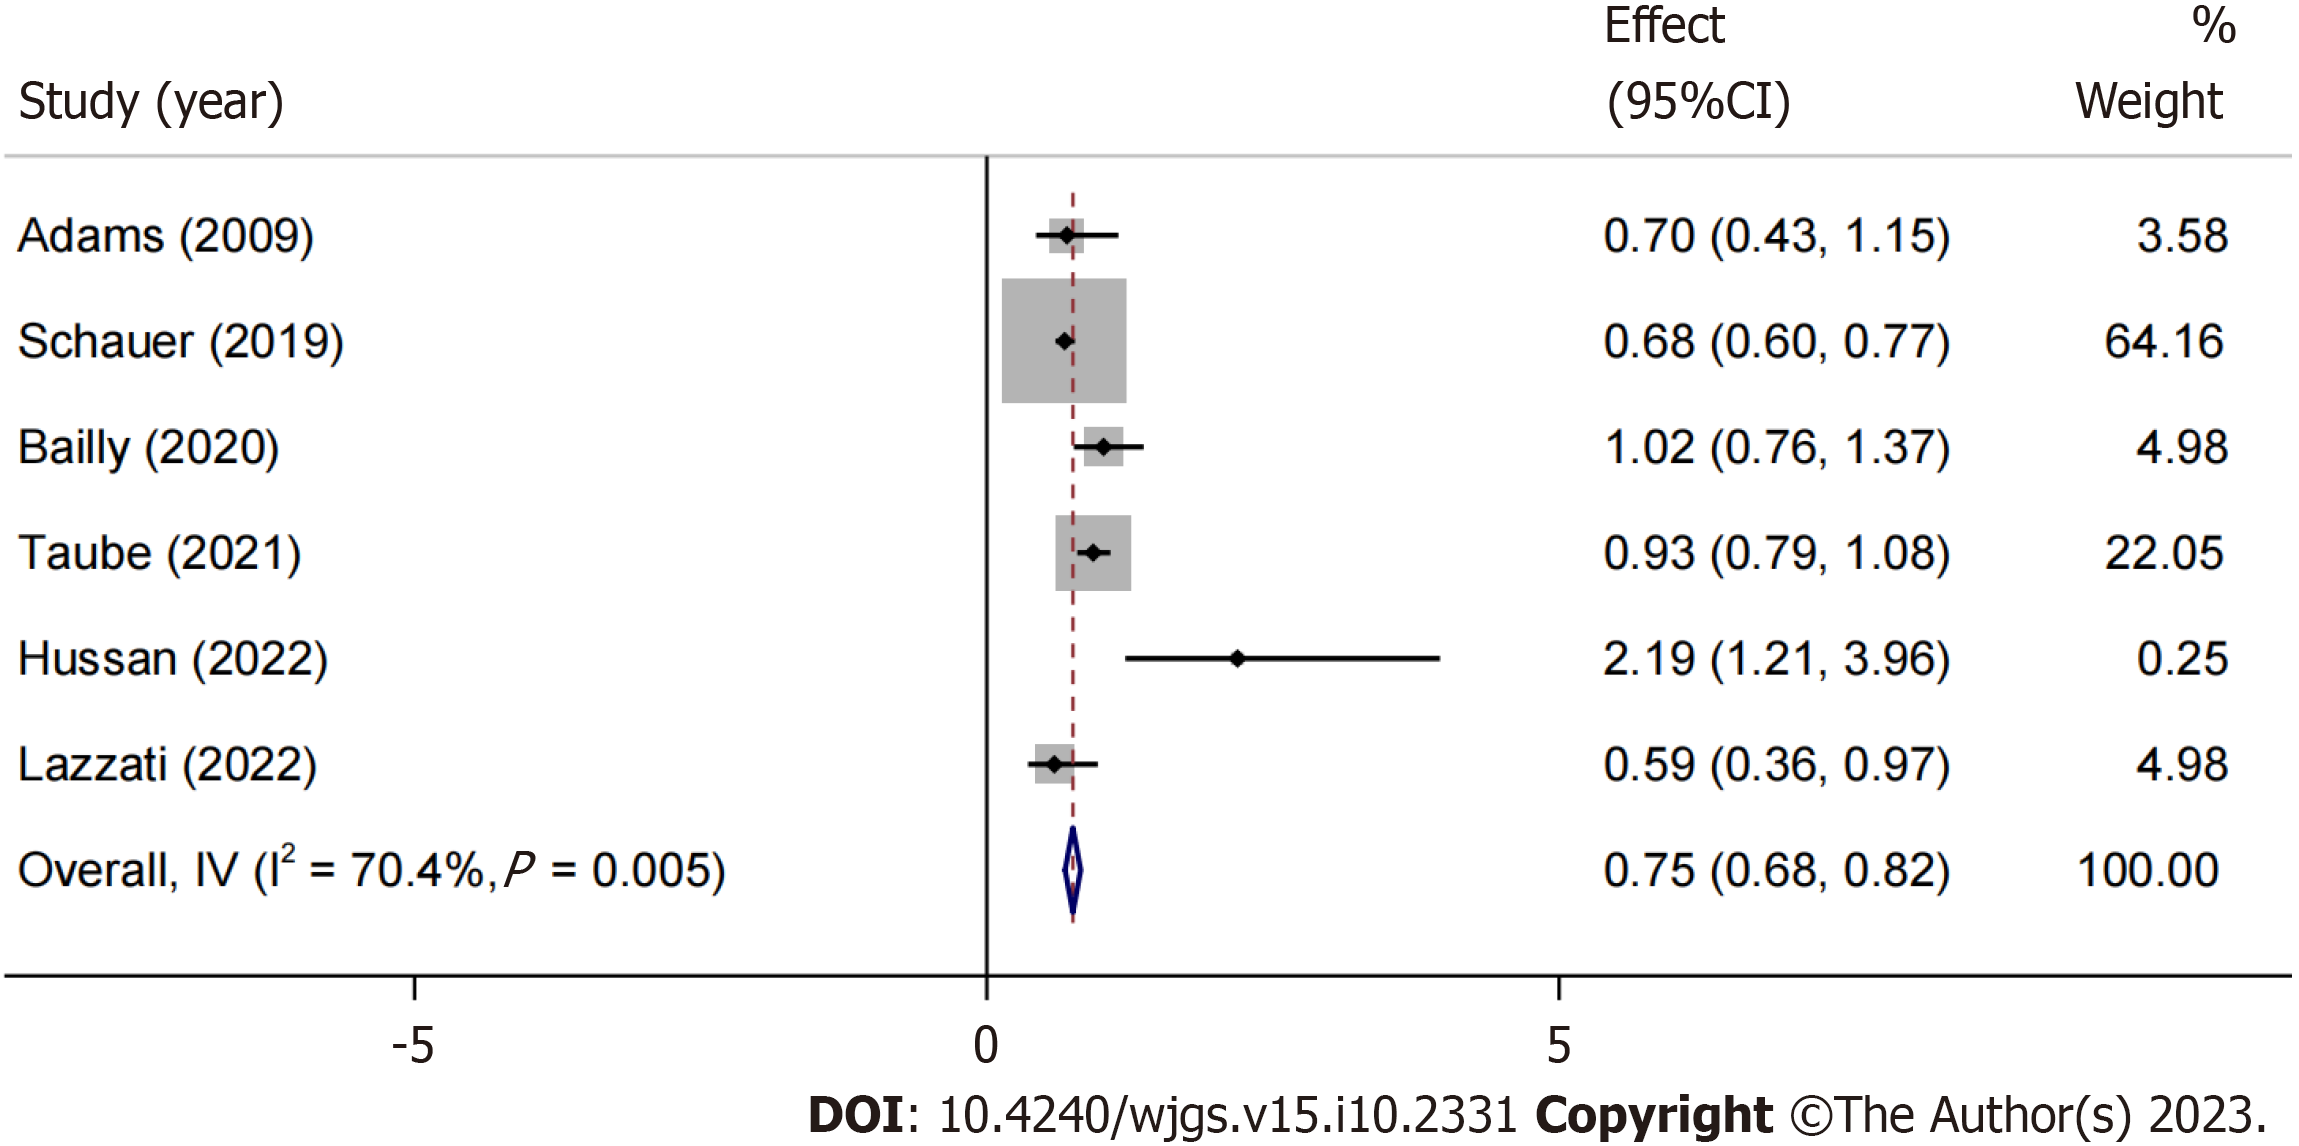
Figure 4 After sensitivity analysis, an hazard ratio meta-analysis forest plot is created.
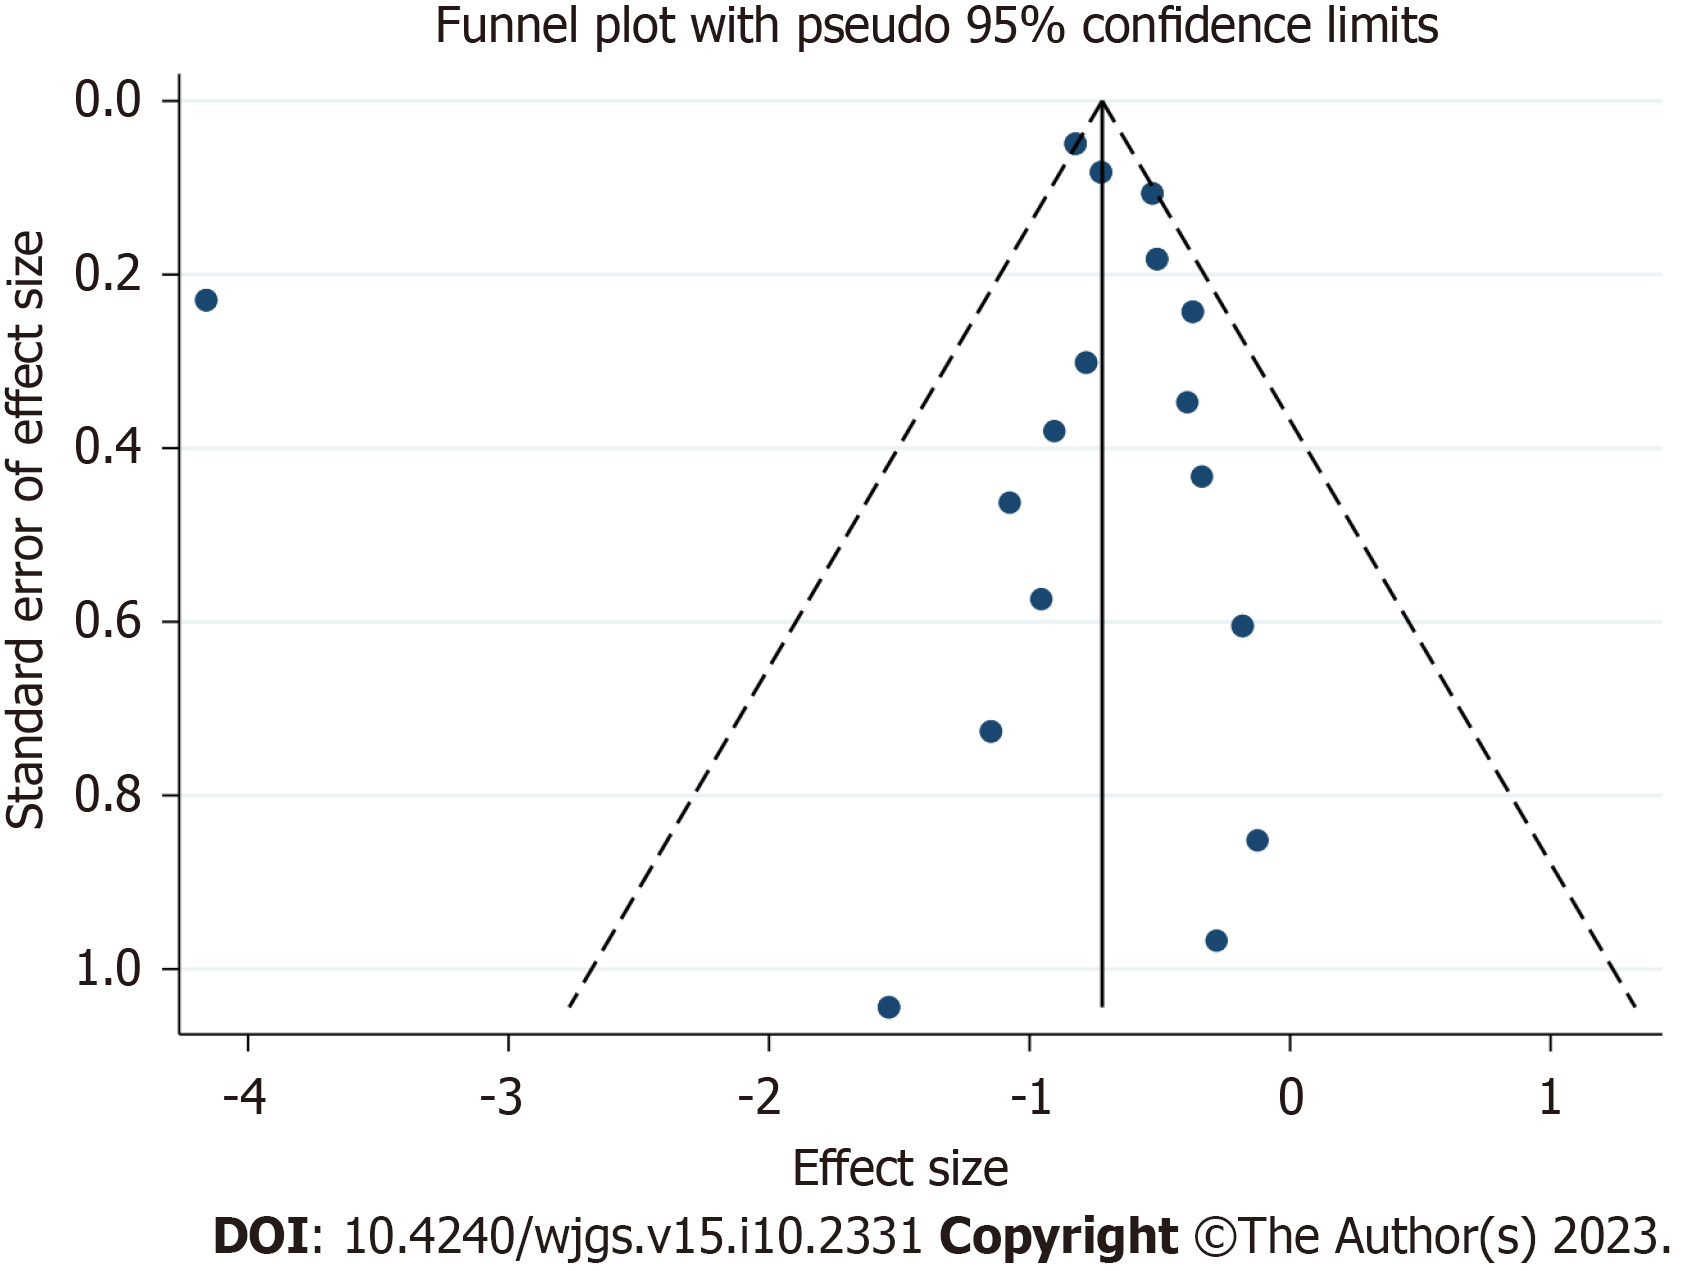
Figure 5 Funnel plot with pseudo 95% confidence limit.
- Citation: Liu YN, Gu JF, Zhang J, Xing DY, Wang GQ. Bariatric surgery reduces colorectal cancer incidence in obese individuals: Systematic review and meta-analysis. World J Gastrointest Surg 2023; 15(10): 2331-2342
- URL: https://www.wjgnet.com/1948-9366/full/v15/i10/2331.htm
- DOI: https://dx.doi.org/10.4240/wjgs.v15.i10.2331


