Copyright
©The Author(s) 2023.
World J Gastrointest Surg. Oct 27, 2023; 15(10): 2222-2233
Published online Oct 27, 2023. doi: 10.4240/wjgs.v15.i10.2222
Published online Oct 27, 2023. doi: 10.4240/wjgs.v15.i10.2222
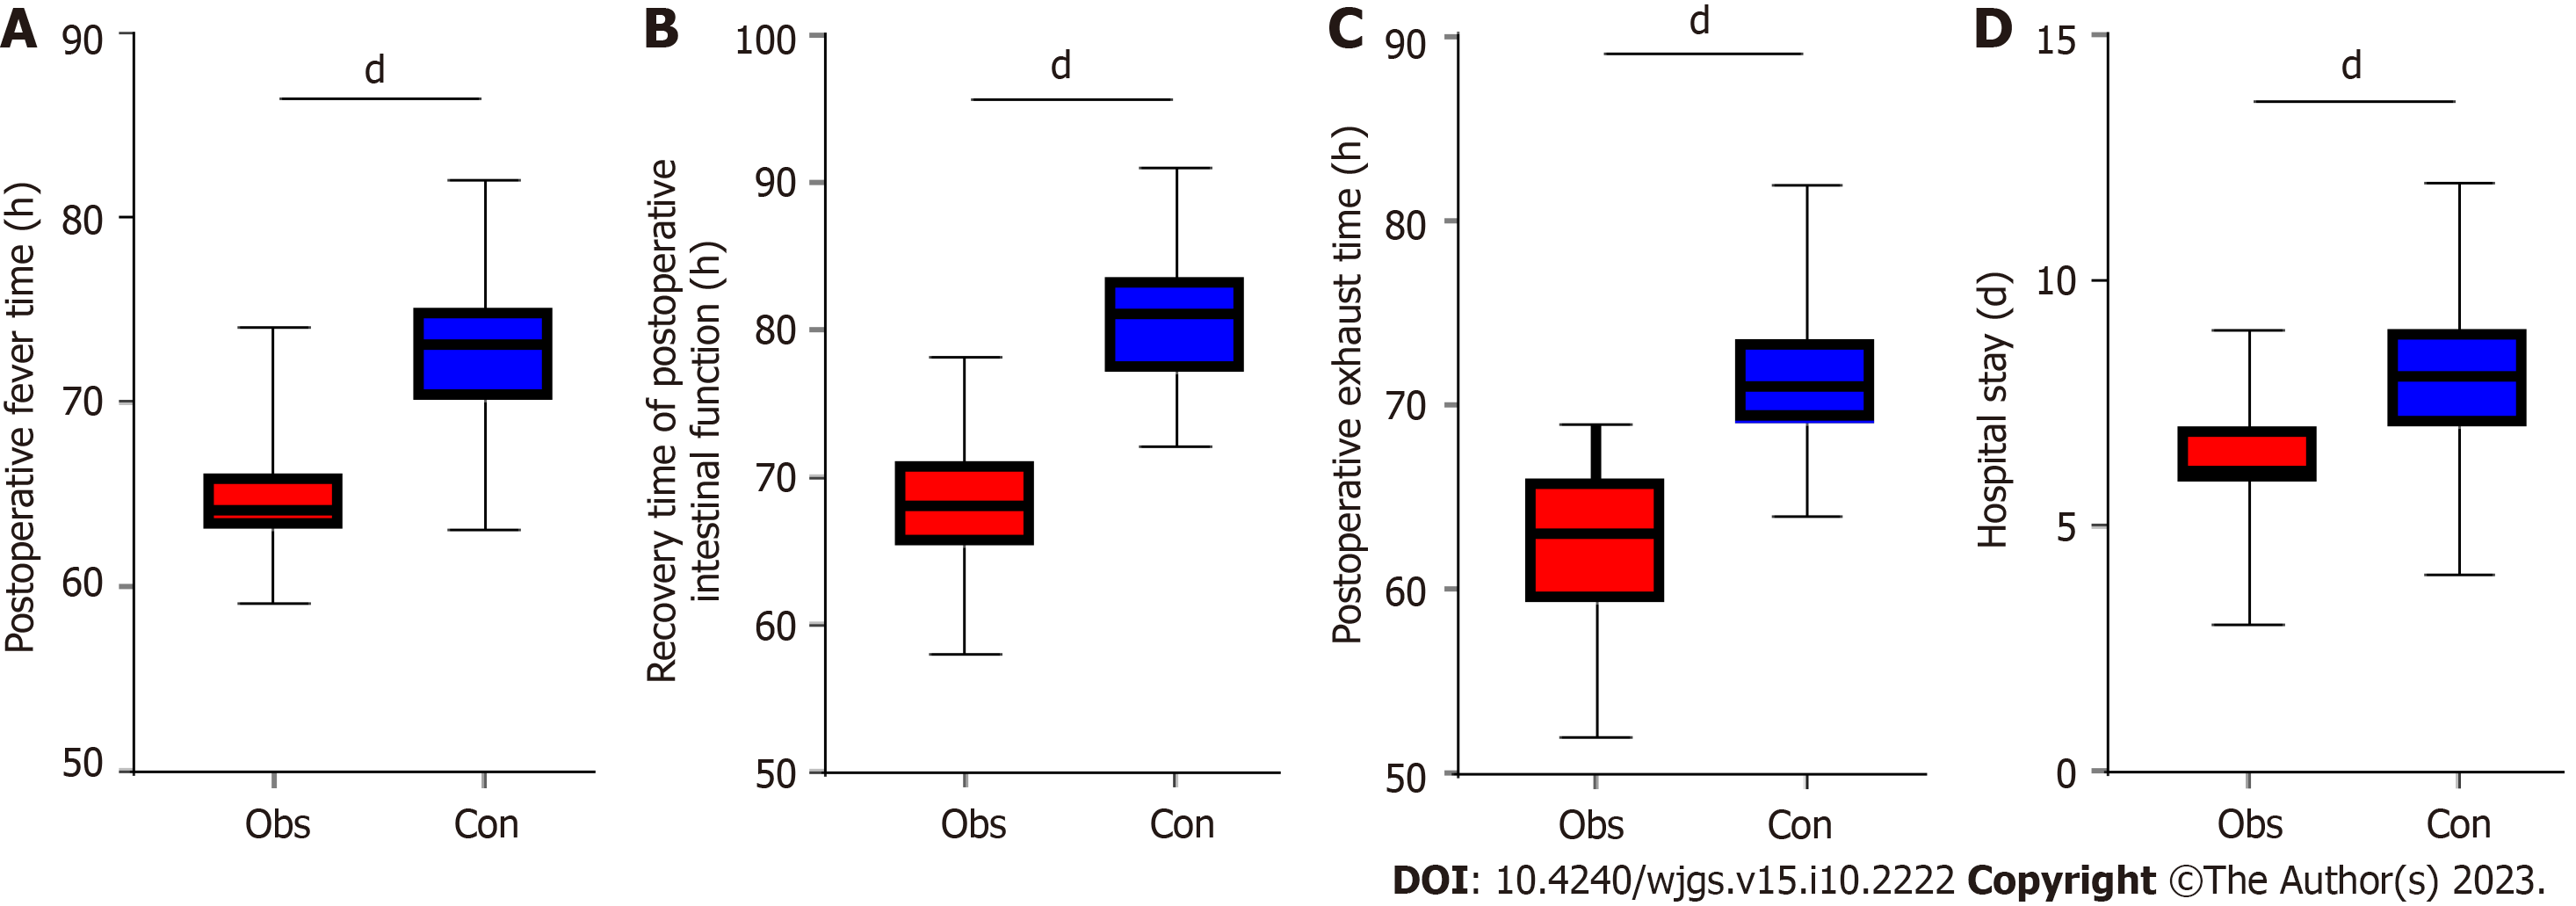
Figure 1 Comparison of patient postoperative clinical indicators.
A: Comparison of the time to postoperative fever after surgery; B: Comparison of patient postoperative bowel function recovery time; C: Comparison of patient postoperative time to exhaustion; D: Comparison of patient length of stay in hospital. dP < 0.0001. Con: Control group (received complete parenteral nutritional support); Obs: Observation group (received early enteral nutritional support).
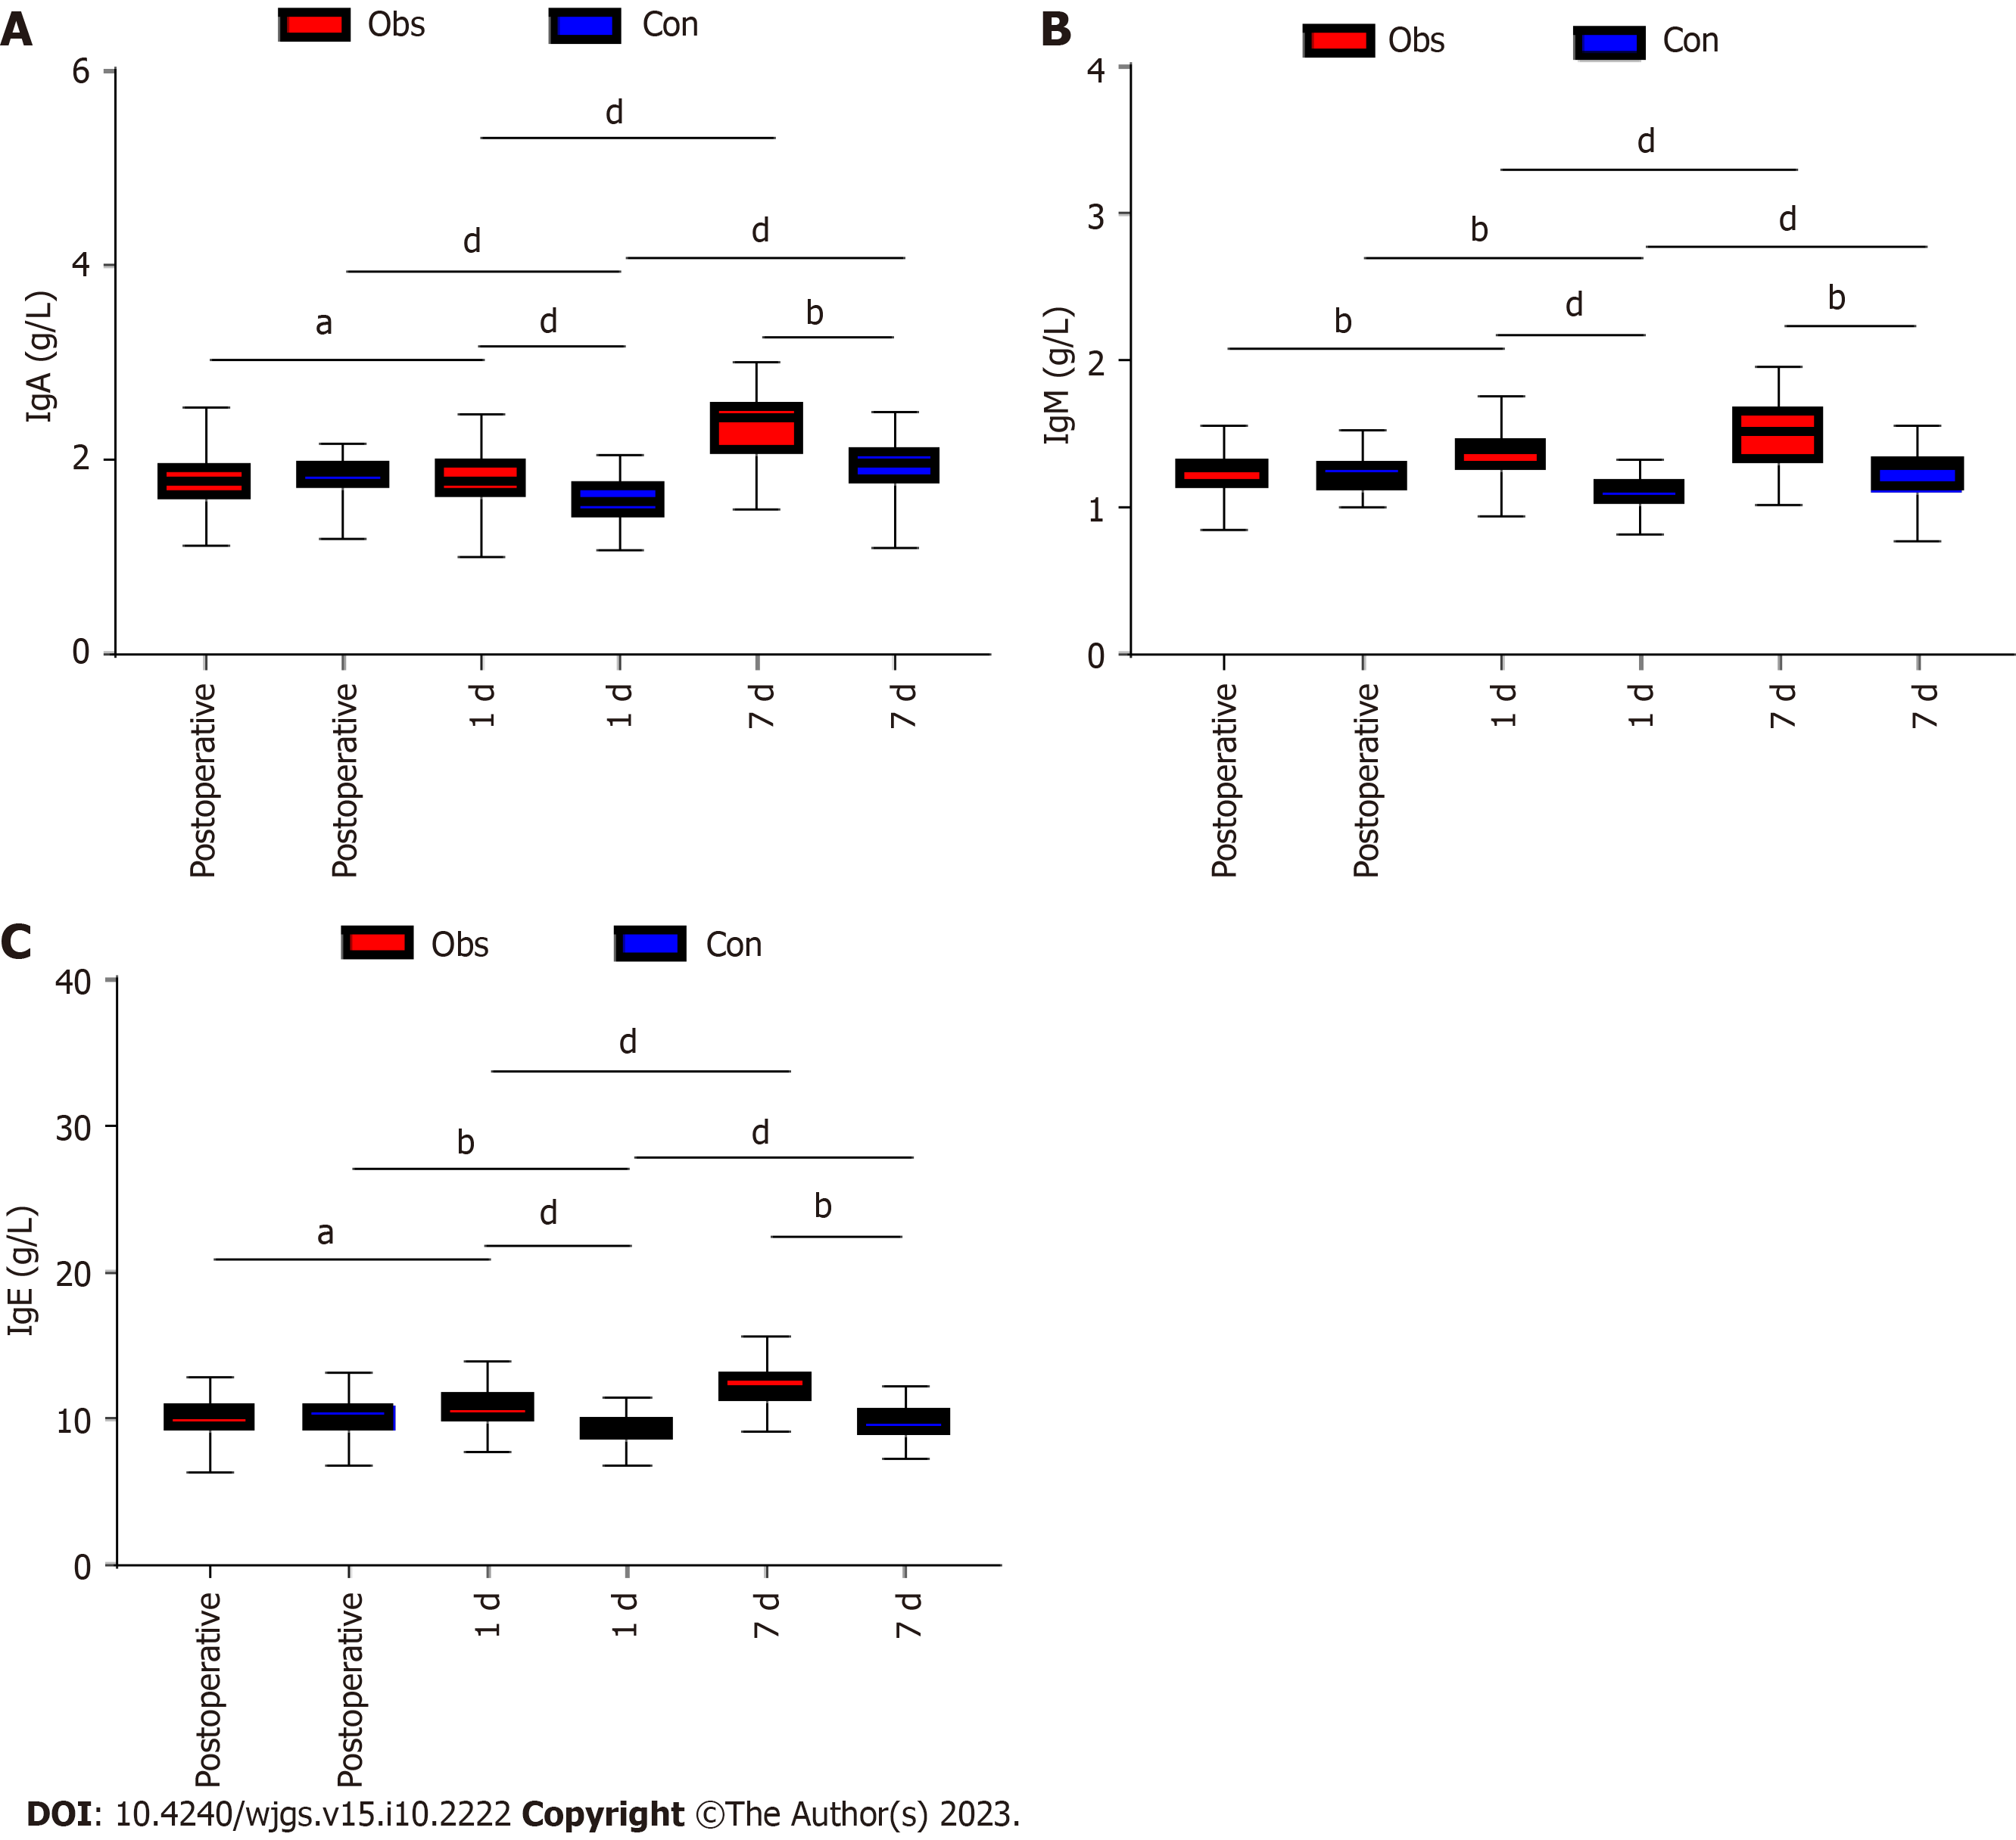
Figure 2 Comparison of immunoglobulin indicators between the two groups of patients.
A: Comparison of the changes in immunoglobulin (Ig) A before surgery and 1 d and 7 d after surgery; B: Comparison of IgM changes before surgery and 1 d and 7 d after surgery between the two groups; C: Comparison of IgG changes before surgery and 1 d and 7 d after surgery between the two groups of patients. aP < 0.05; bP < 0.01; dP < 0.0001. Con: Control group (received complete parenteral nutritional support); Obs: Observation group (received early enteral nutritional support).
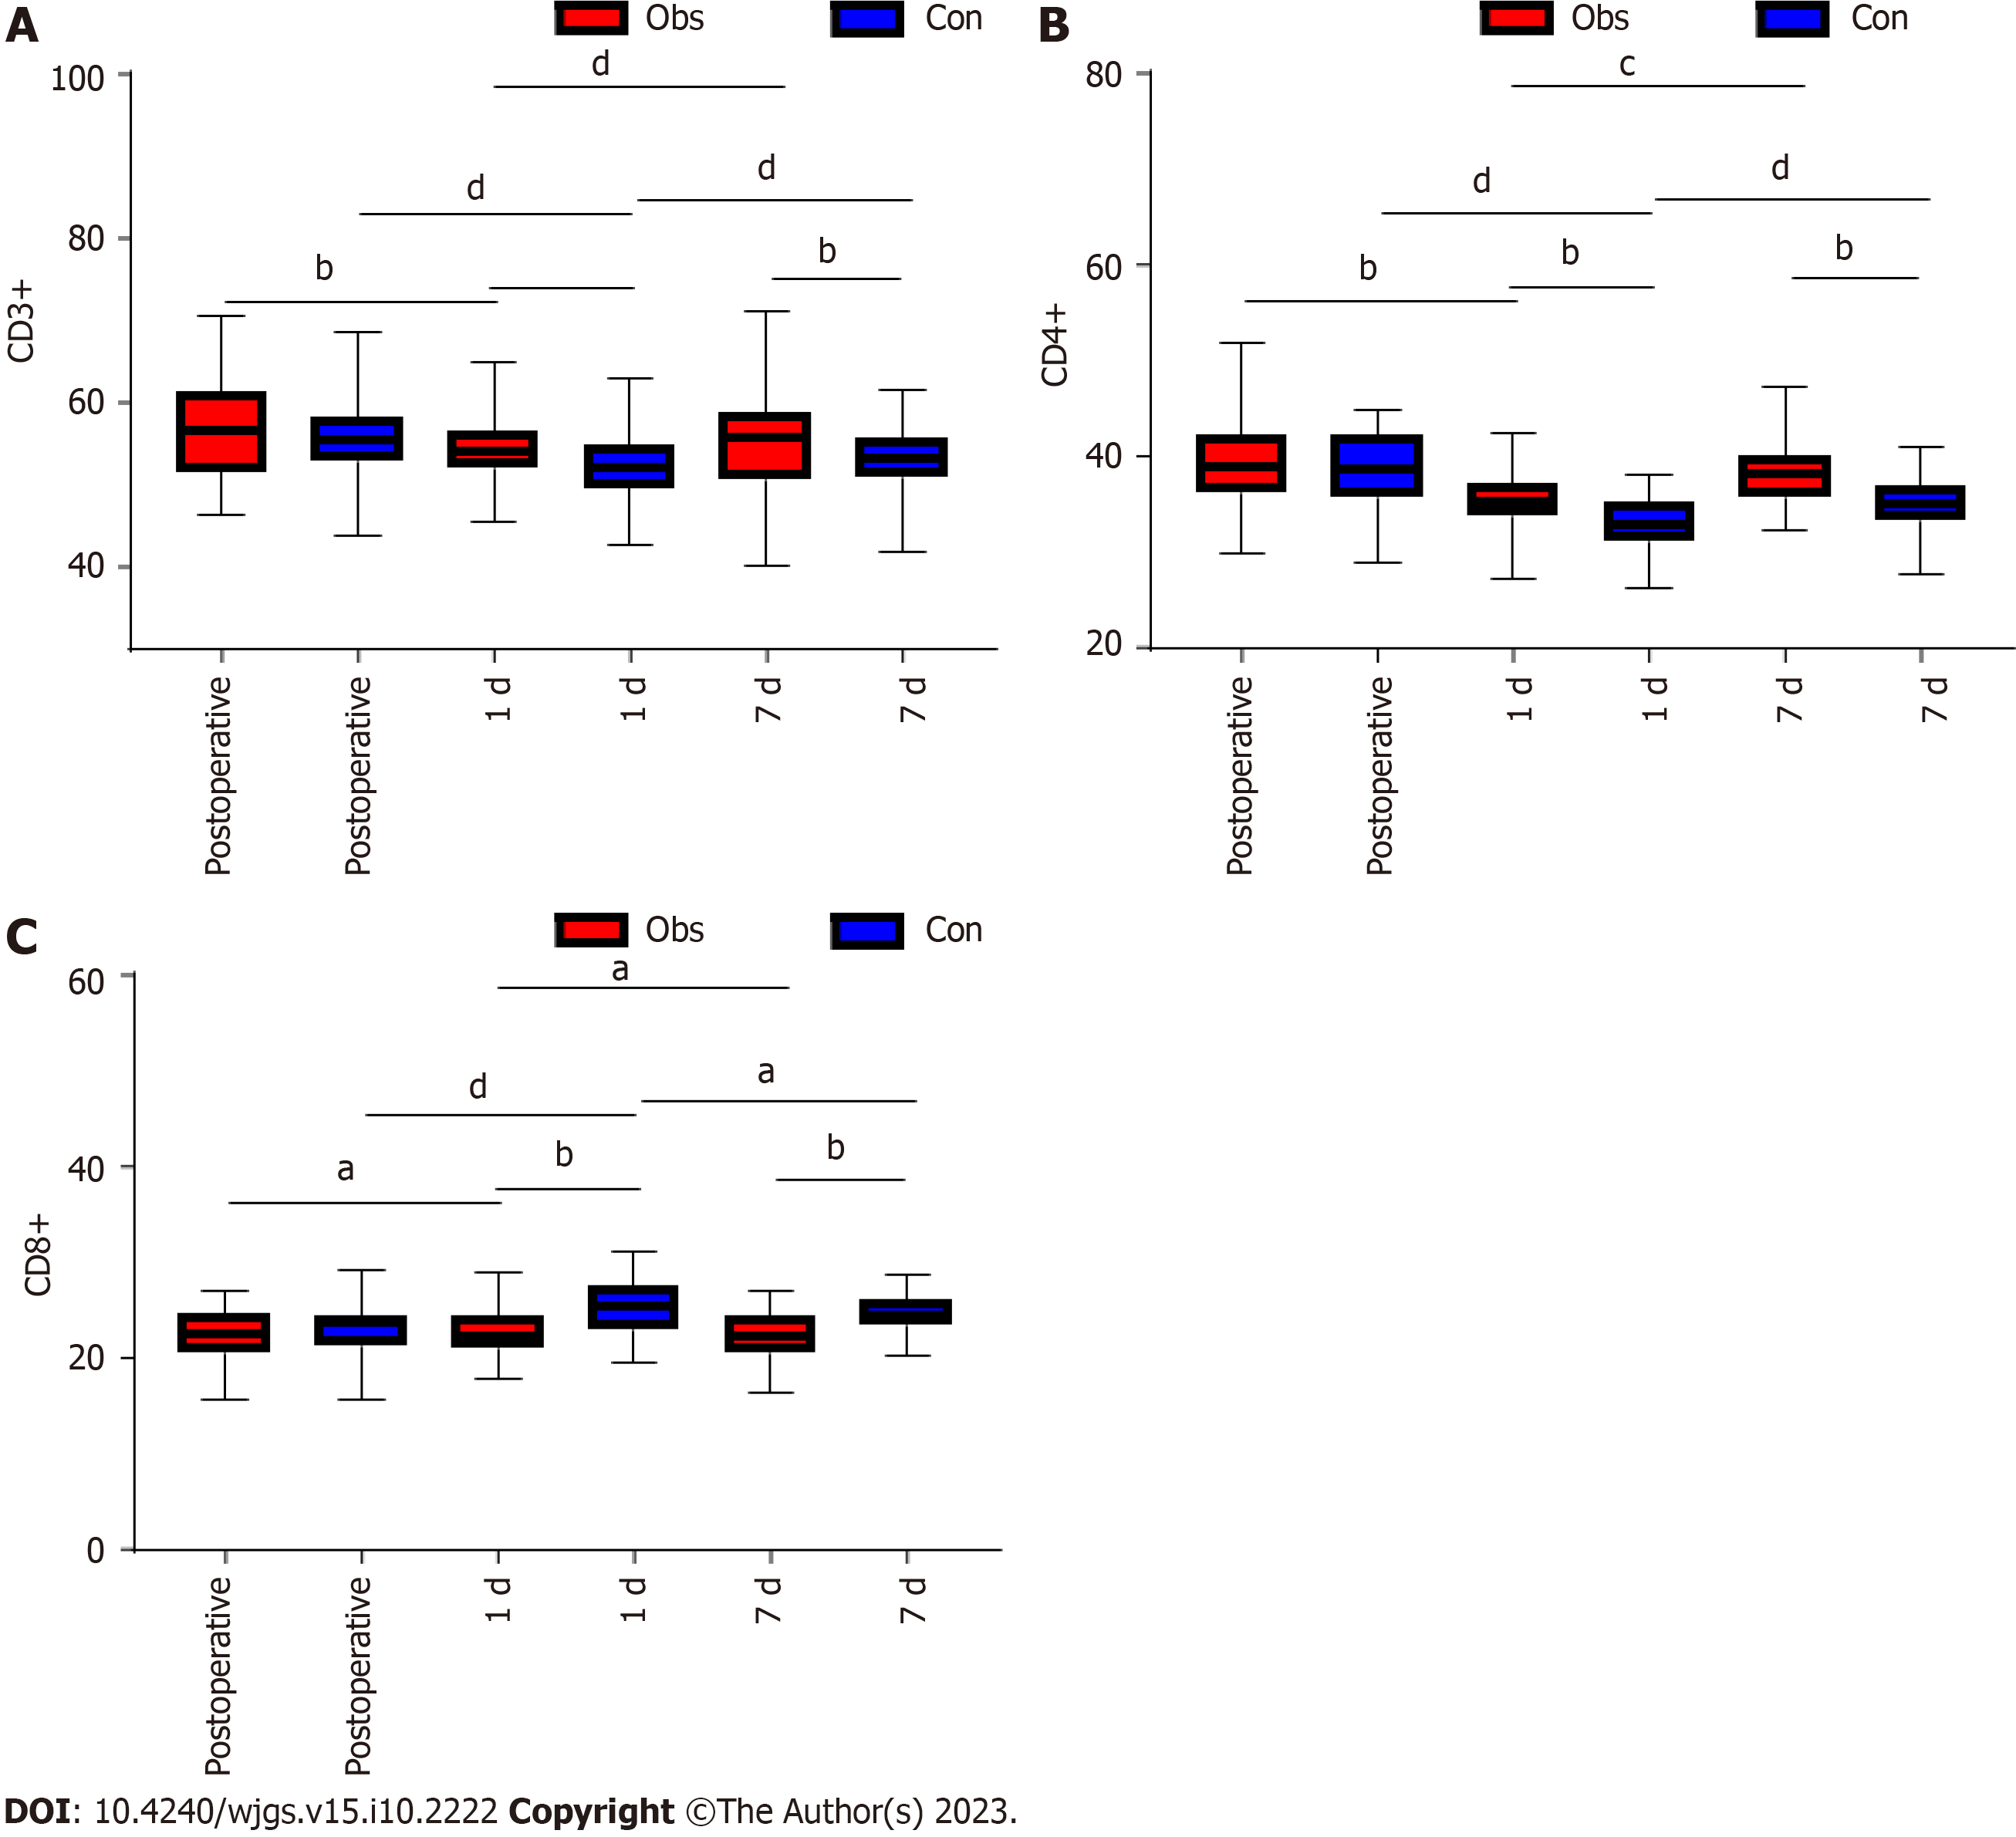
Figure 3 Comparison of peripheral blood T lymphocyte subpopulation indicators between the two groups of patients.
A: Comparison of CD3 changes before surgery and 1 d and 7 d after surgery between the two groups; B: Comparison of CD4 changes before surgery and 1 d and 7 d after surgery between the two groups; C: Comparison of the changes in CD8 before surgery and 1 d and 7 d after surgery between the two groups of patients. aP < 0.05; bP < 0.01; cP < 0.001; dP < 0.0001. Con: Control group (received complete parenteral nutritional support); Obs: Observation group (received early enteral nutritional support).
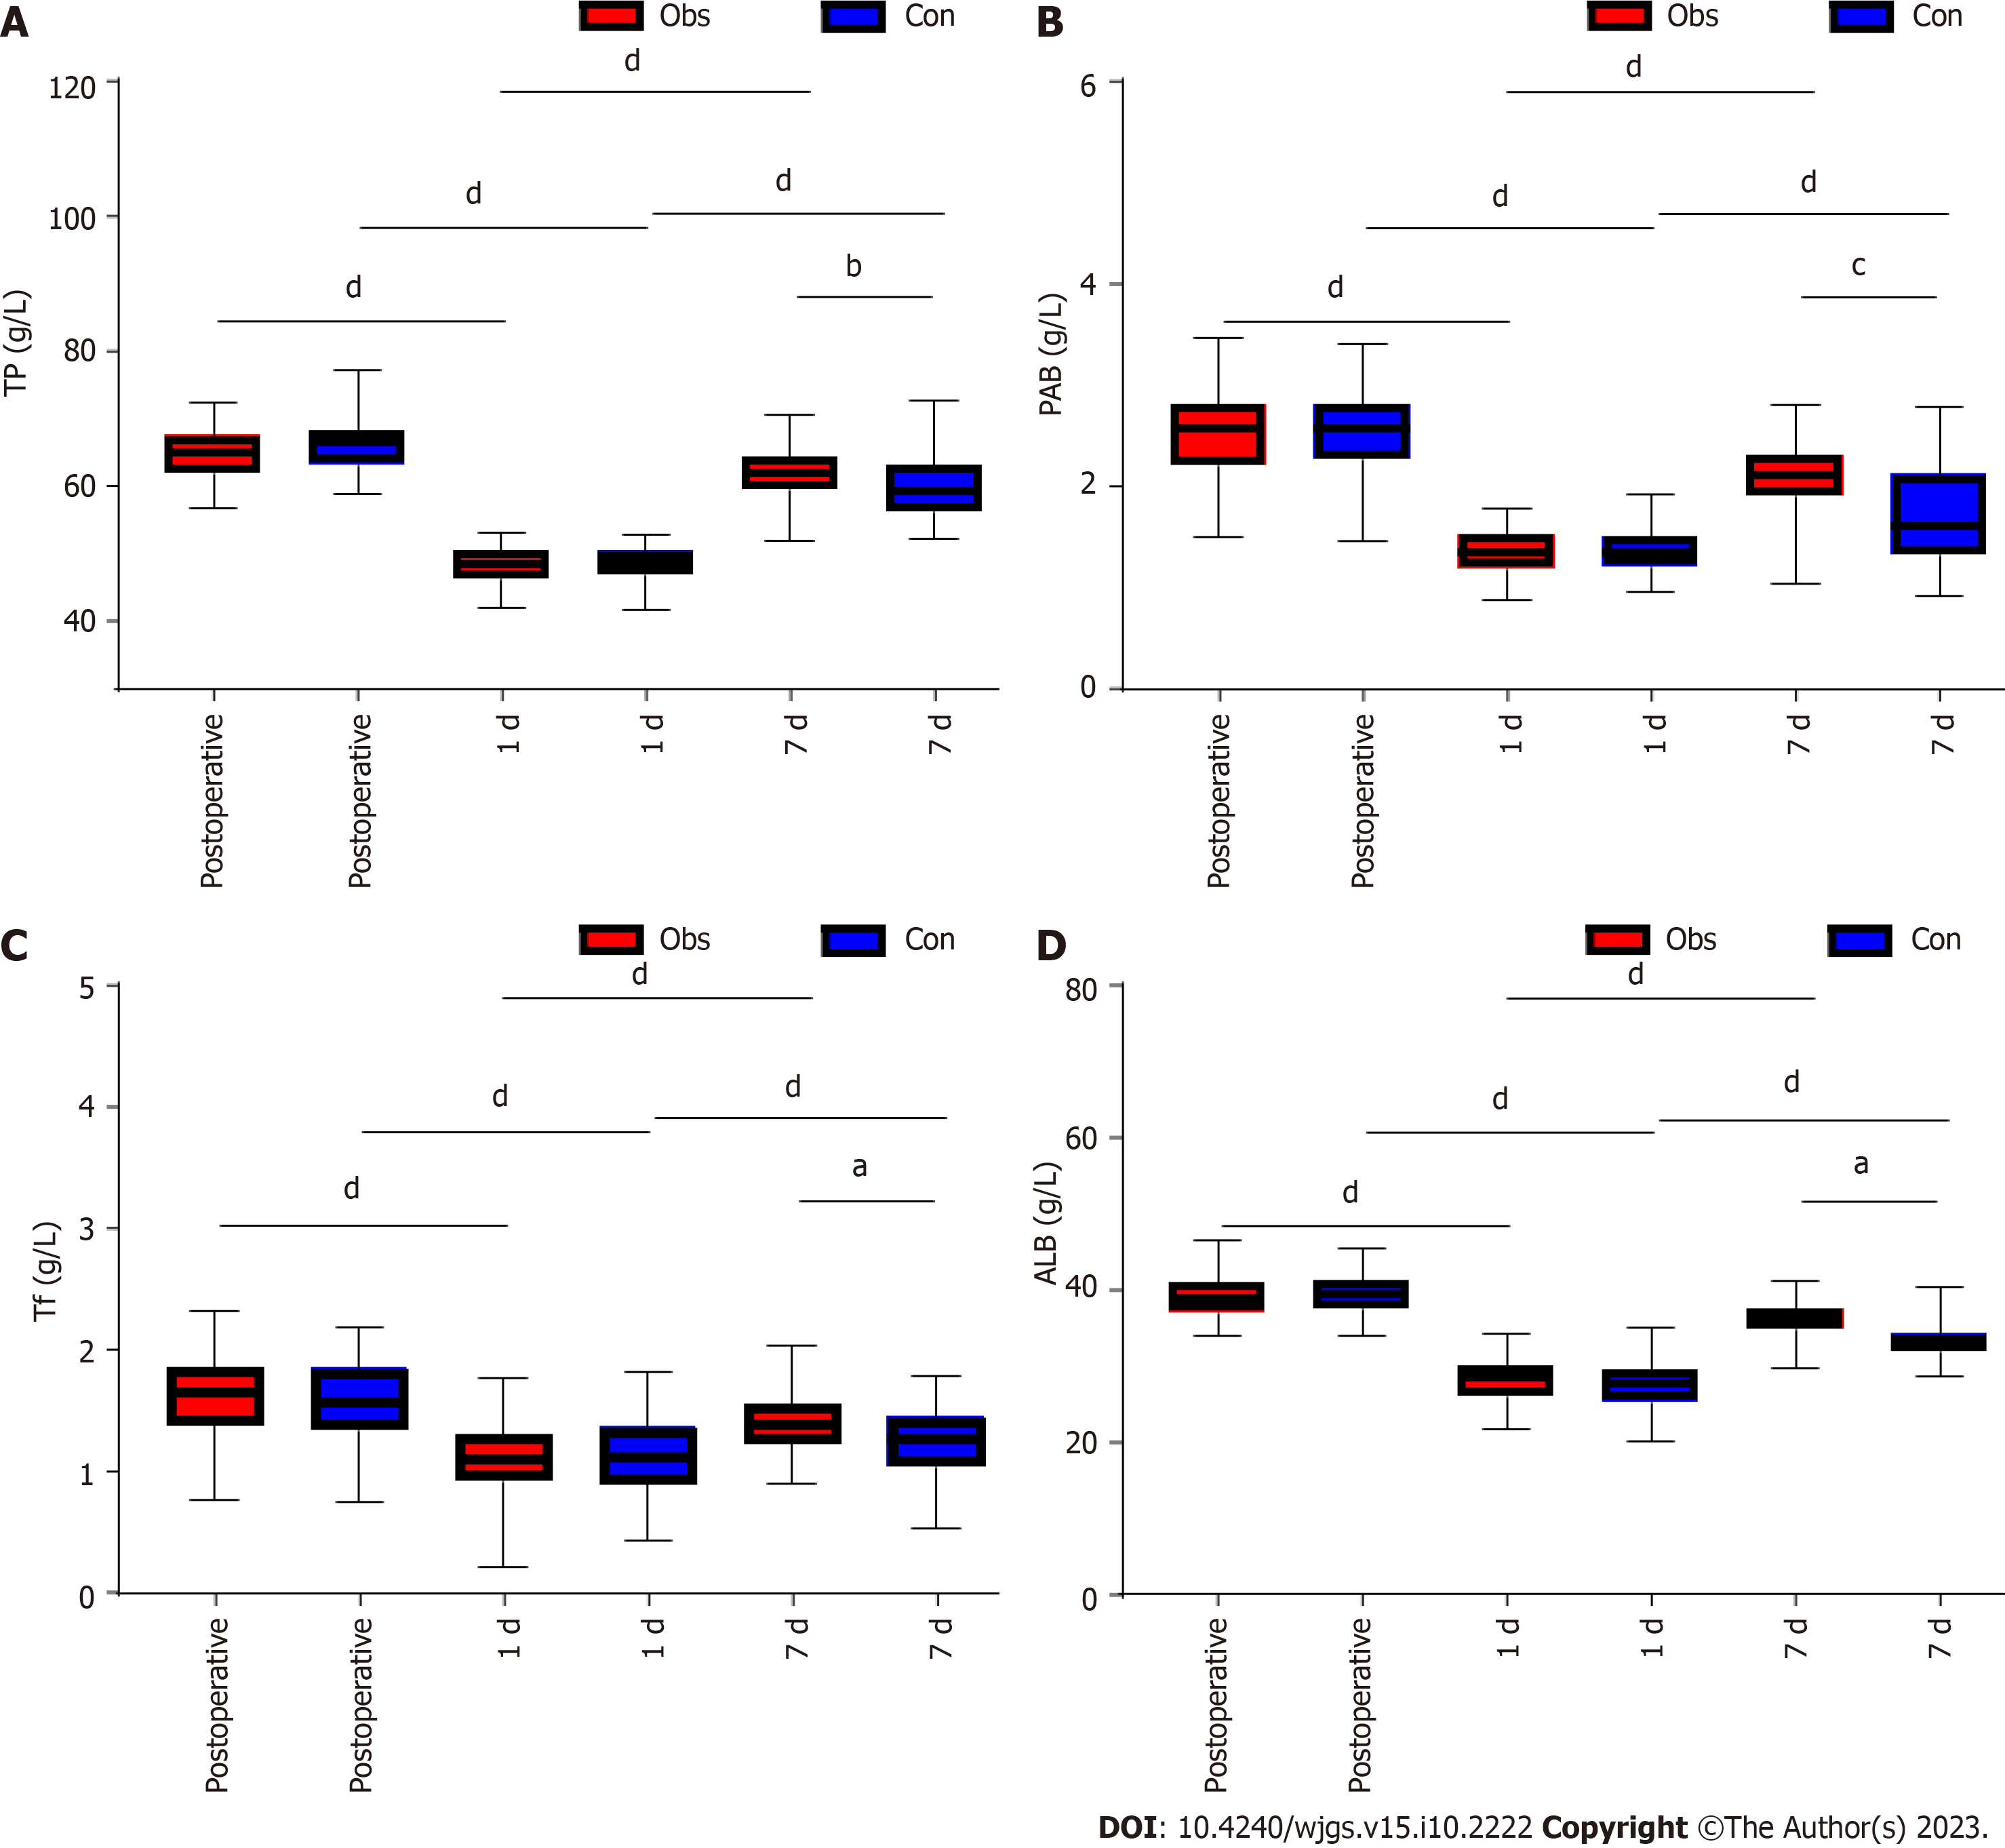
Figure 4 Comparison of nutritional function indicators between the two groups of patients.
A: Comparison of the changes in total protein before surgery and 1 d and 7 d after surgery between the two groups; B: Comparison of the changes in prealbumin before surgery and 1 d and 7 d after surgery between the two groups; C: Comparison of the changes in transferrin (Tf) before surgery and 1 d and 7 d after surgery in the two groups; D: Comparison of the changes in albumin before surgery and 1 d and 7 d after surgery in the two groups. aP < 0.05; bP < 0.01; cP < 0.001; dP < 0.0001. Con: Control group (received complete parenteral nutritional support); Obs: Observation group (received early enteral nutritional support).
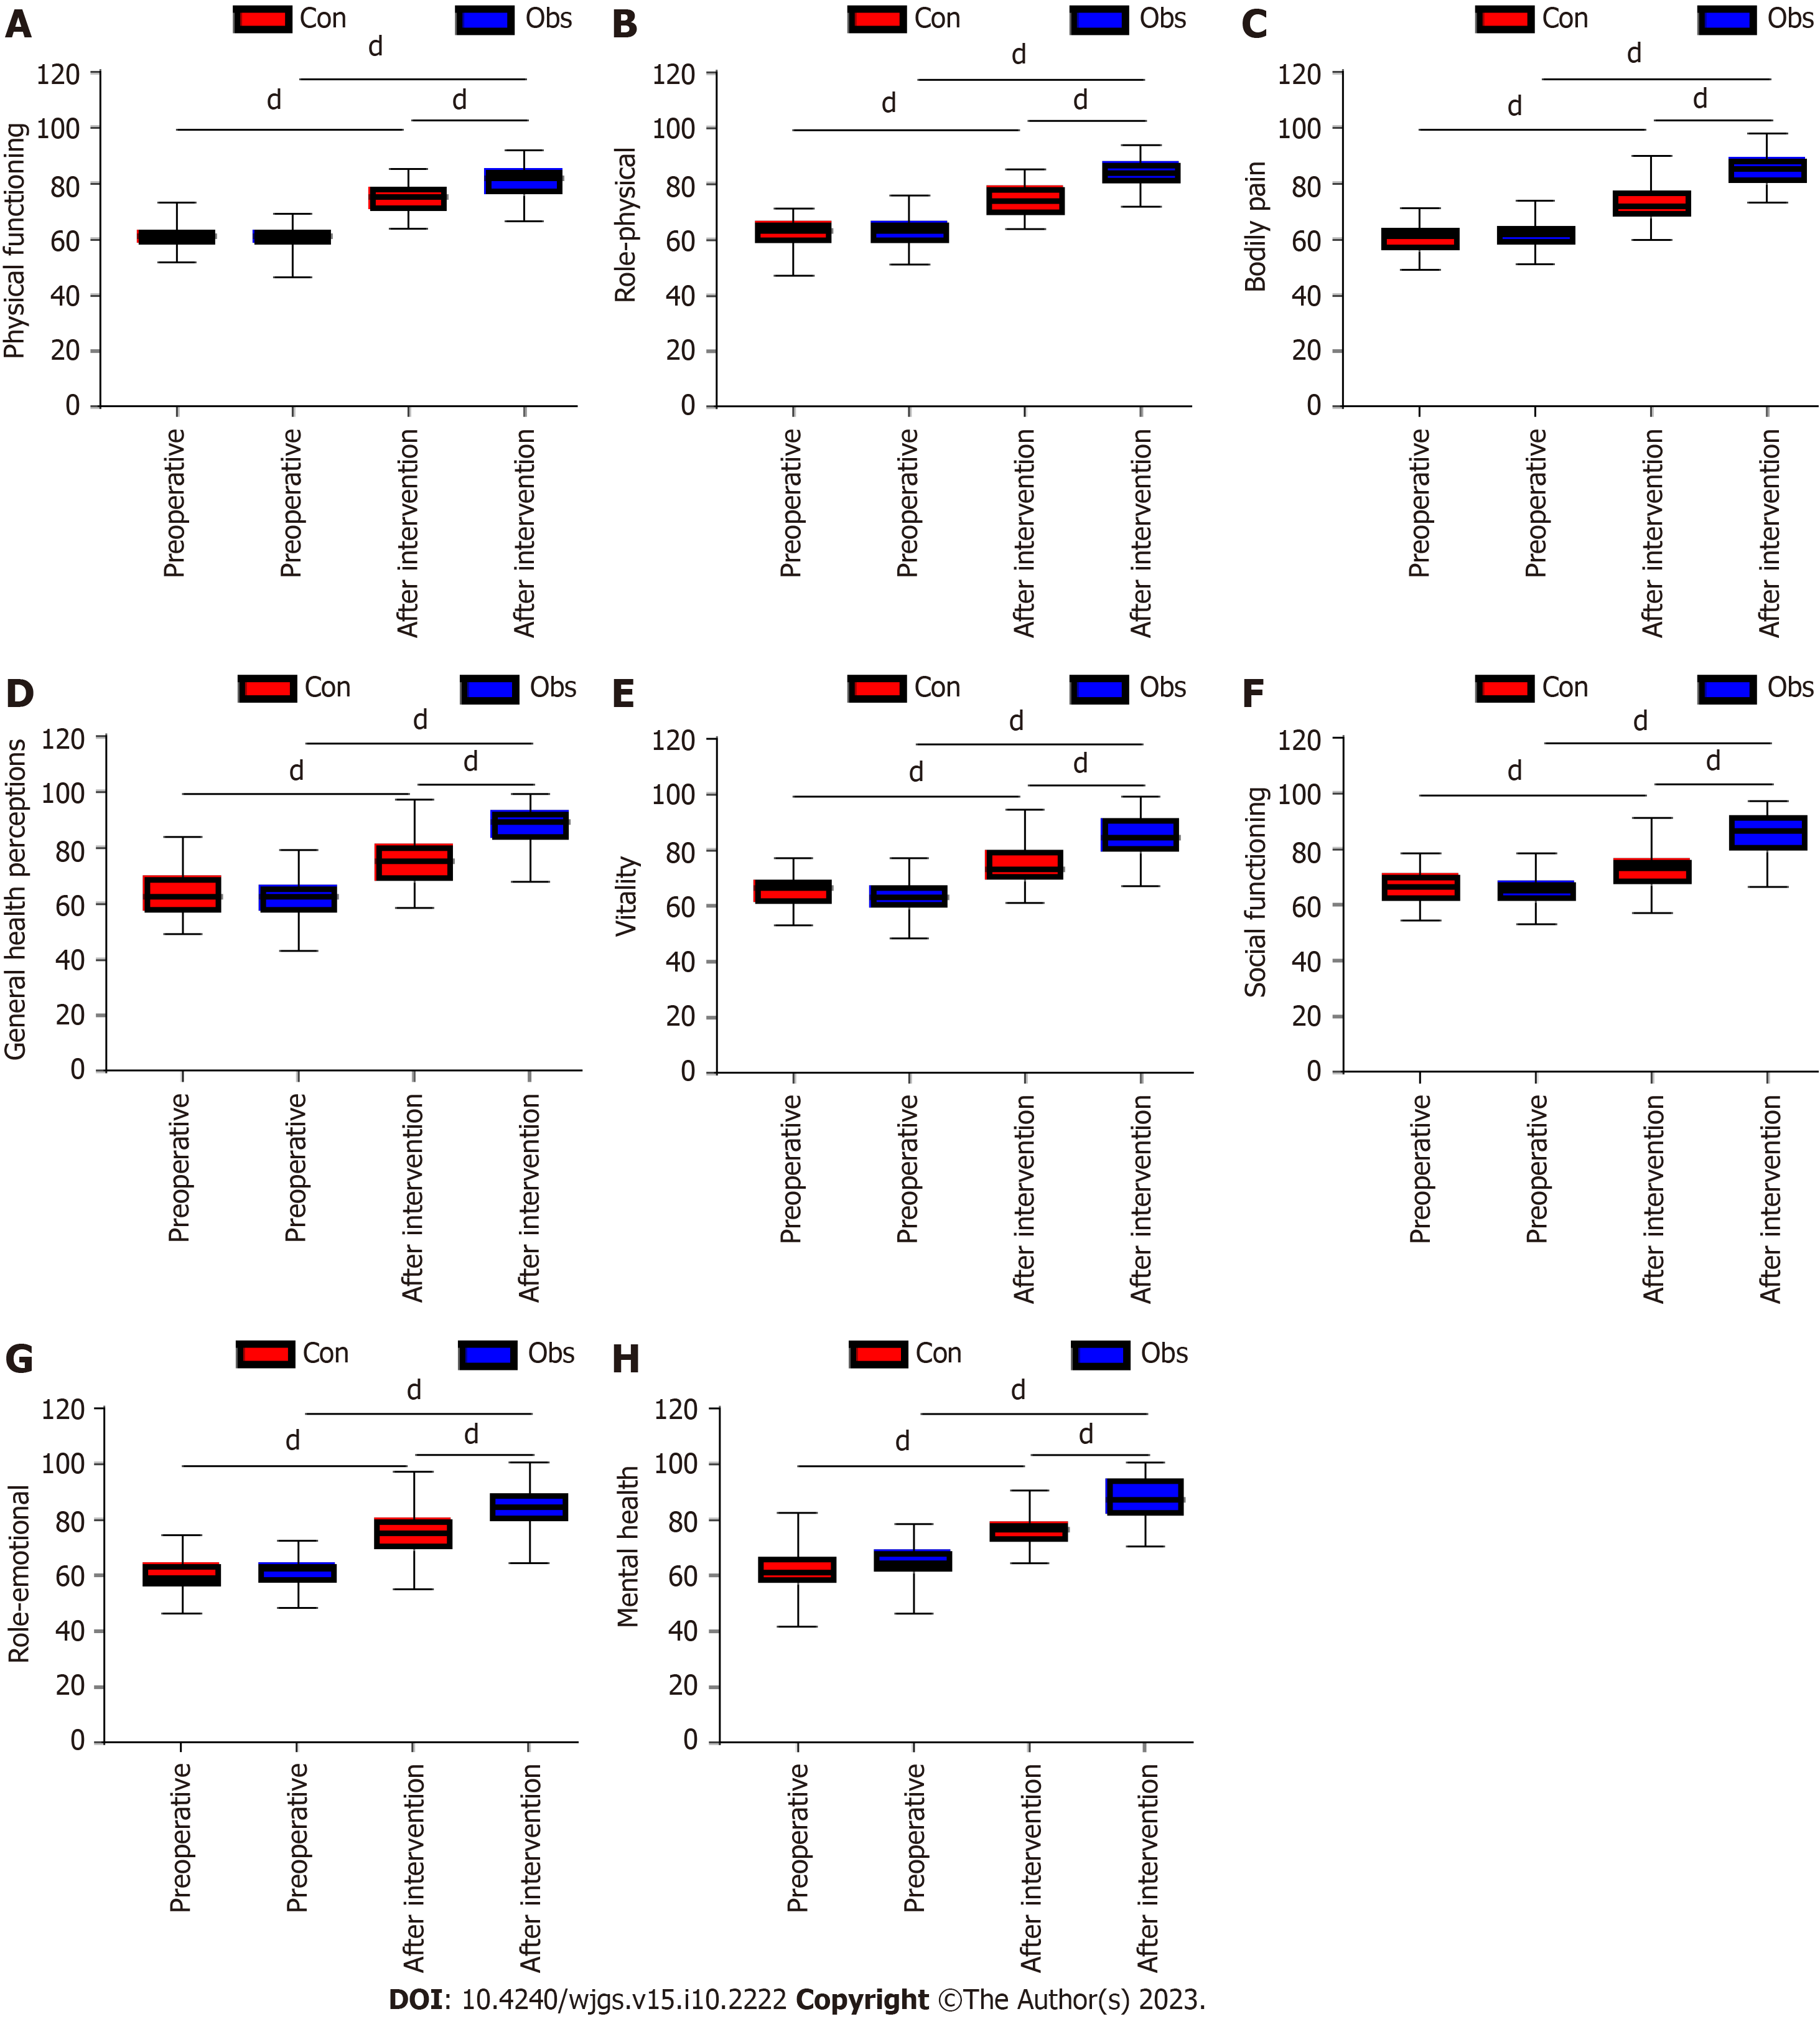
Figure 5 Comparison of patient quality of life scores before and after the intervention.
A: Physical functioning scores before and after the intervention; B: Role-physical scores before and after intervention; C: Bodily pain scores before and after intervention; D: General health perceptions scores before and after the intervention; E: Vitality scores before and after the intervention; F: Social functioning scores before and after the intervention; G: Role-emotional scores before and after the intervention; H: Mental health scores before and after the intervention. dP < 0.0001. Con: Control group (received complete parenteral nutritional support); Obs: Observation group (received early enteral nutritional support).
- Citation: Chen Z, Hong B, He JJ, Ye QQ, Hu QY. Examining the impact of early enteral nutritional support on postoperative recovery in patients undergoing surgical treatment for gastrointestinal neoplasms. World J Gastrointest Surg 2023; 15(10): 2222-2233
- URL: https://www.wjgnet.com/1948-9366/full/v15/i10/2222.htm
- DOI: https://dx.doi.org/10.4240/wjgs.v15.i10.2222


