Copyright
©The Author(s) 2022.
World J Gastrointest Surg. Sep 27, 2022; 14(9): 930-939
Published online Sep 27, 2022. doi: 10.4240/wjgs.v14.i9.930
Published online Sep 27, 2022. doi: 10.4240/wjgs.v14.i9.930
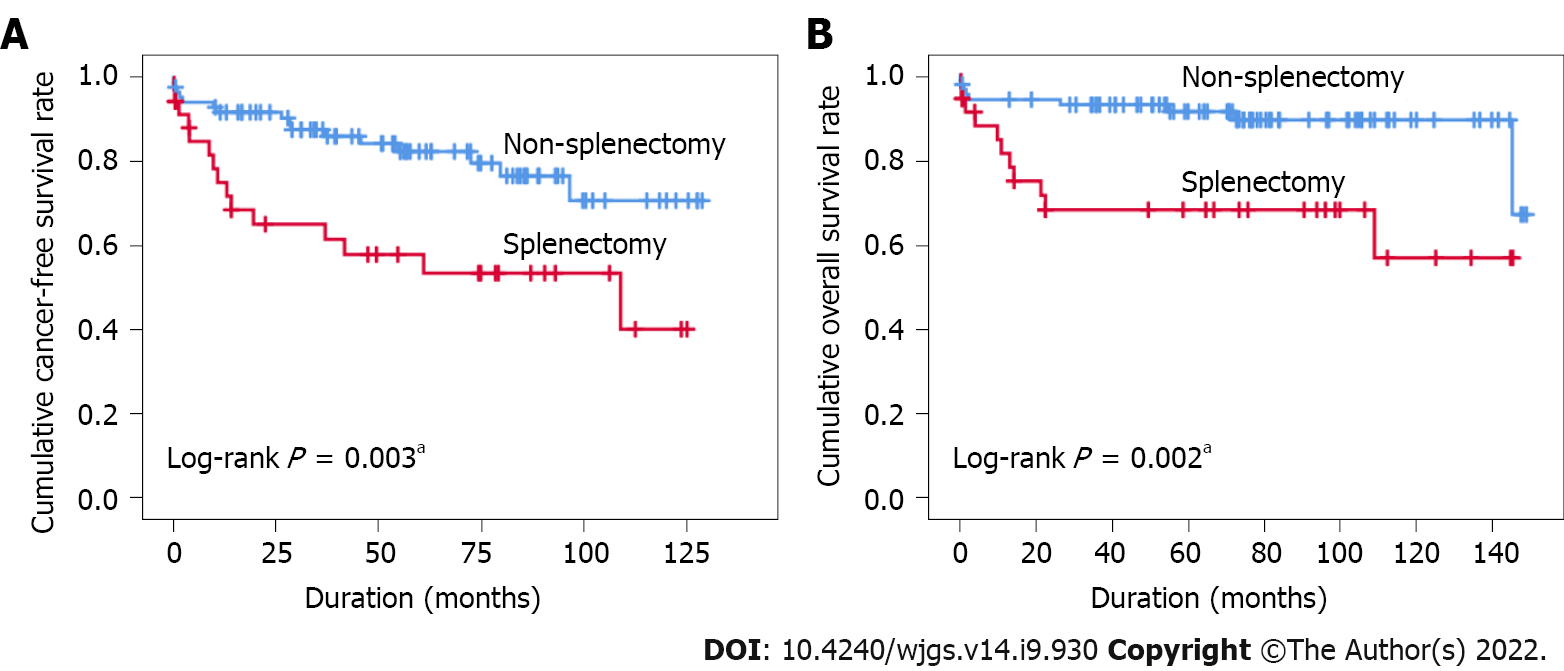
Figure 1 Kaplan–Meier curves.
A: Cancer-free survival in 120 patients. The rates were significantly different between the splenectomy and nonsplenectomy groups (P = 0.003); B: Overall survival in 120 patients. The rates were significantly different between the splenectomy and non-splenectomy groups (P = 0.002). aP < 0.05.
- Citation: Fan HL, Hsieh CB, Kuo SM, Chen TW. Liver transplantation with simultaneous splenectomy increases risk of cancer development and mortality in hepatocellular carcinoma patients. World J Gastrointest Surg 2022; 14(9): 930-939
- URL: https://www.wjgnet.com/1948-9366/full/v14/i9/930.htm
- DOI: https://dx.doi.org/10.4240/wjgs.v14.i9.930


