Copyright
©The Author(s) 2022.
World J Gastrointest Surg. Jun 27, 2022; 14(6): 580-593
Published online Jun 27, 2022. doi: 10.4240/wjgs.v14.i6.580
Published online Jun 27, 2022. doi: 10.4240/wjgs.v14.i6.580
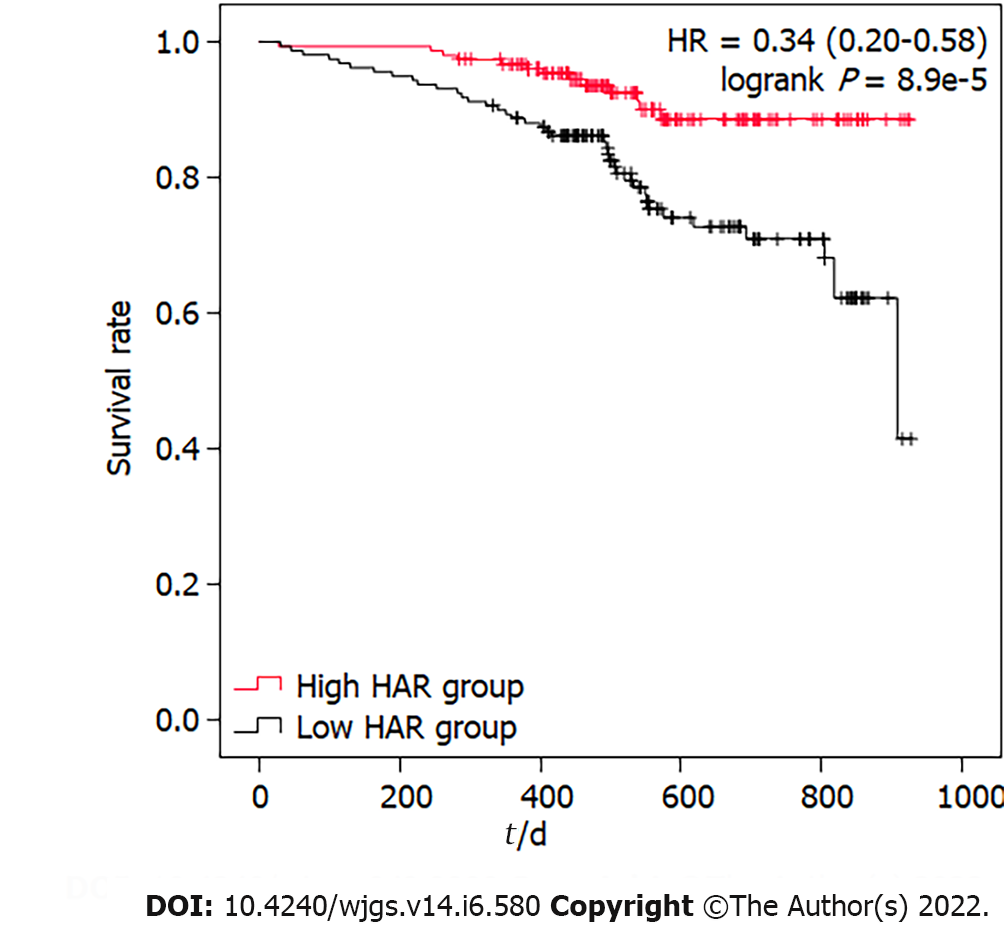
Figure 1 Survival curve of gastric cancer patients with low hemoglobin to albumin ratio and high hemoglobin to albumin ratio.
HAR: Hemoglobin to albumin ratio; HR: Hazard ratio.
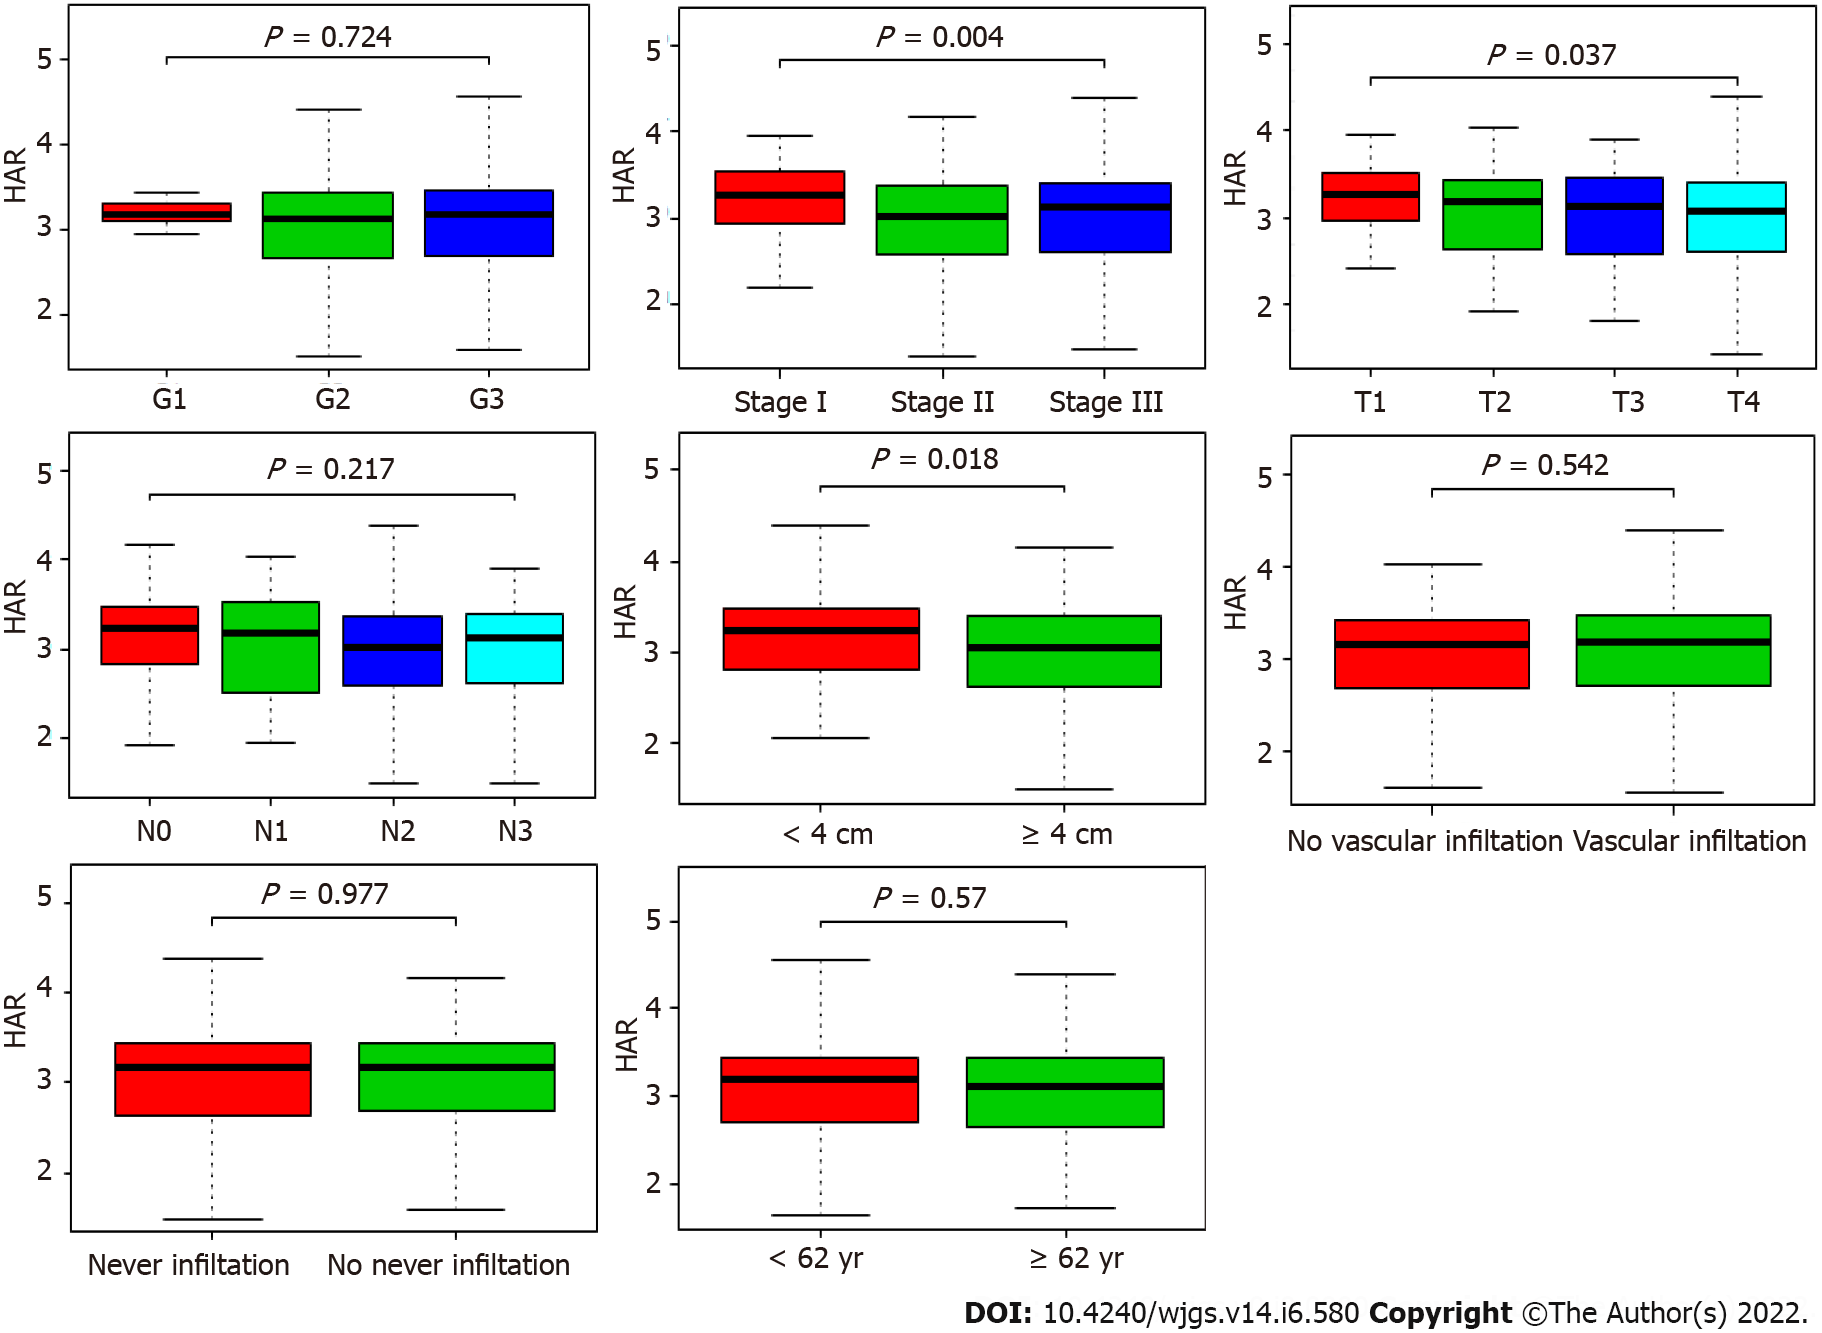
Figure 2 Association between hemoglobin to albumin ratio and clinicopathological characteristics, including grade, stage, T classification, N classification, tumor size, vascular infiltration, nerve infiltration and age.
HAR: Hemoglobin to albumin ratio.
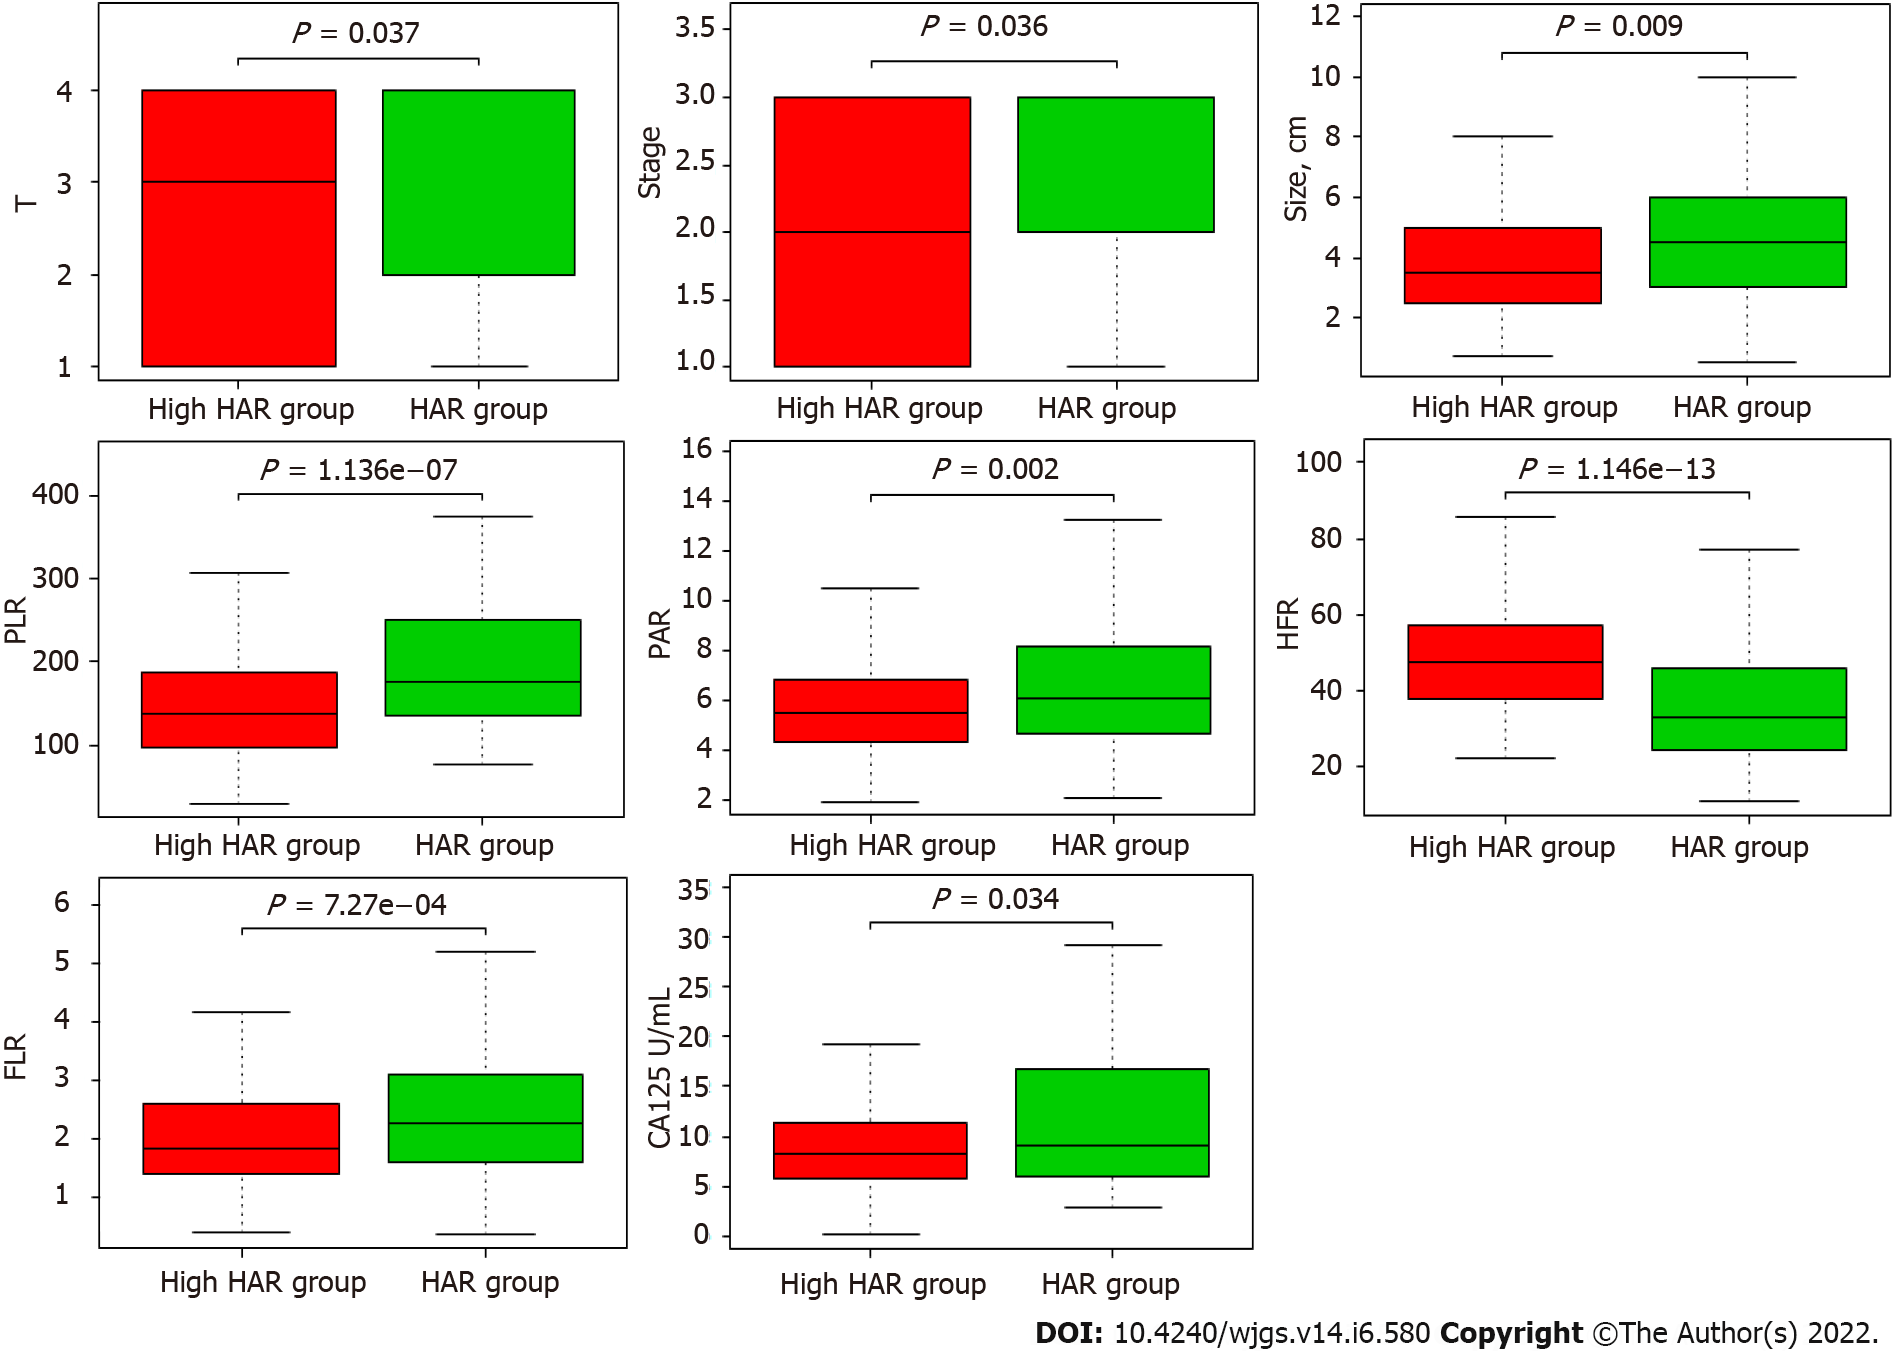
Figure 3 Relationships between hemoglobin to albumin ratio and prognostic factors, including stage, T classification, and tumor size, CA125, fibrinogen to lymphocyte ratio, platelet to albumin ratio, platelet to lymphocyte ratio and hemoglobin to fibrinogen ratio.
HAR: Hemoglobin to albumin ratio; FLR: Fibrinogen to lymphocyte ratio; HFR: Hemoglobin to fibrinogen ratio; PAR: Platelet to albumin ratio; PLR: Platelet to lymphocyte ratio.
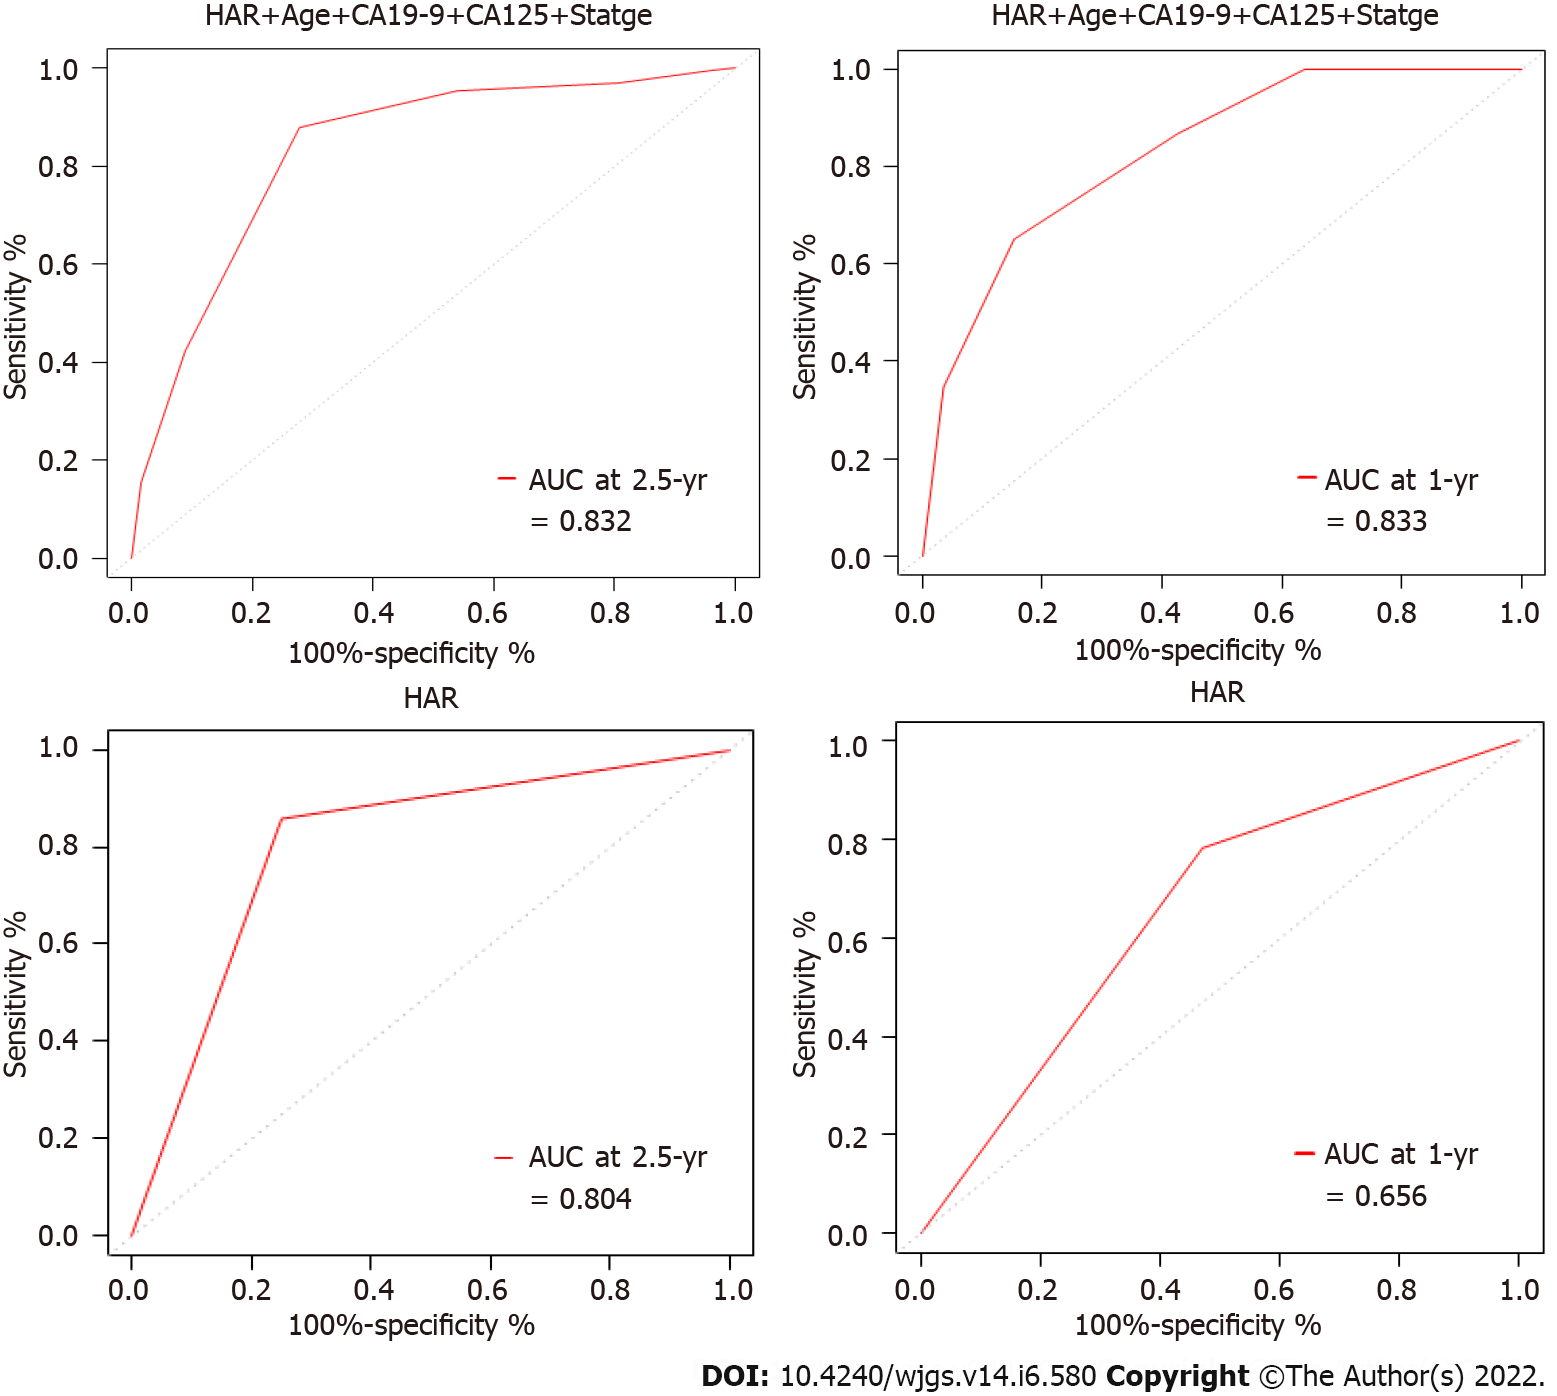
Figure 4 Receiver operating characteristic curve of hemoglobin to albumin ratio or combined factors to predict the short-term survival of gastric cancer patients.
HAR: Hemoglobin to albumin ratio; AUC: Area under the curve.
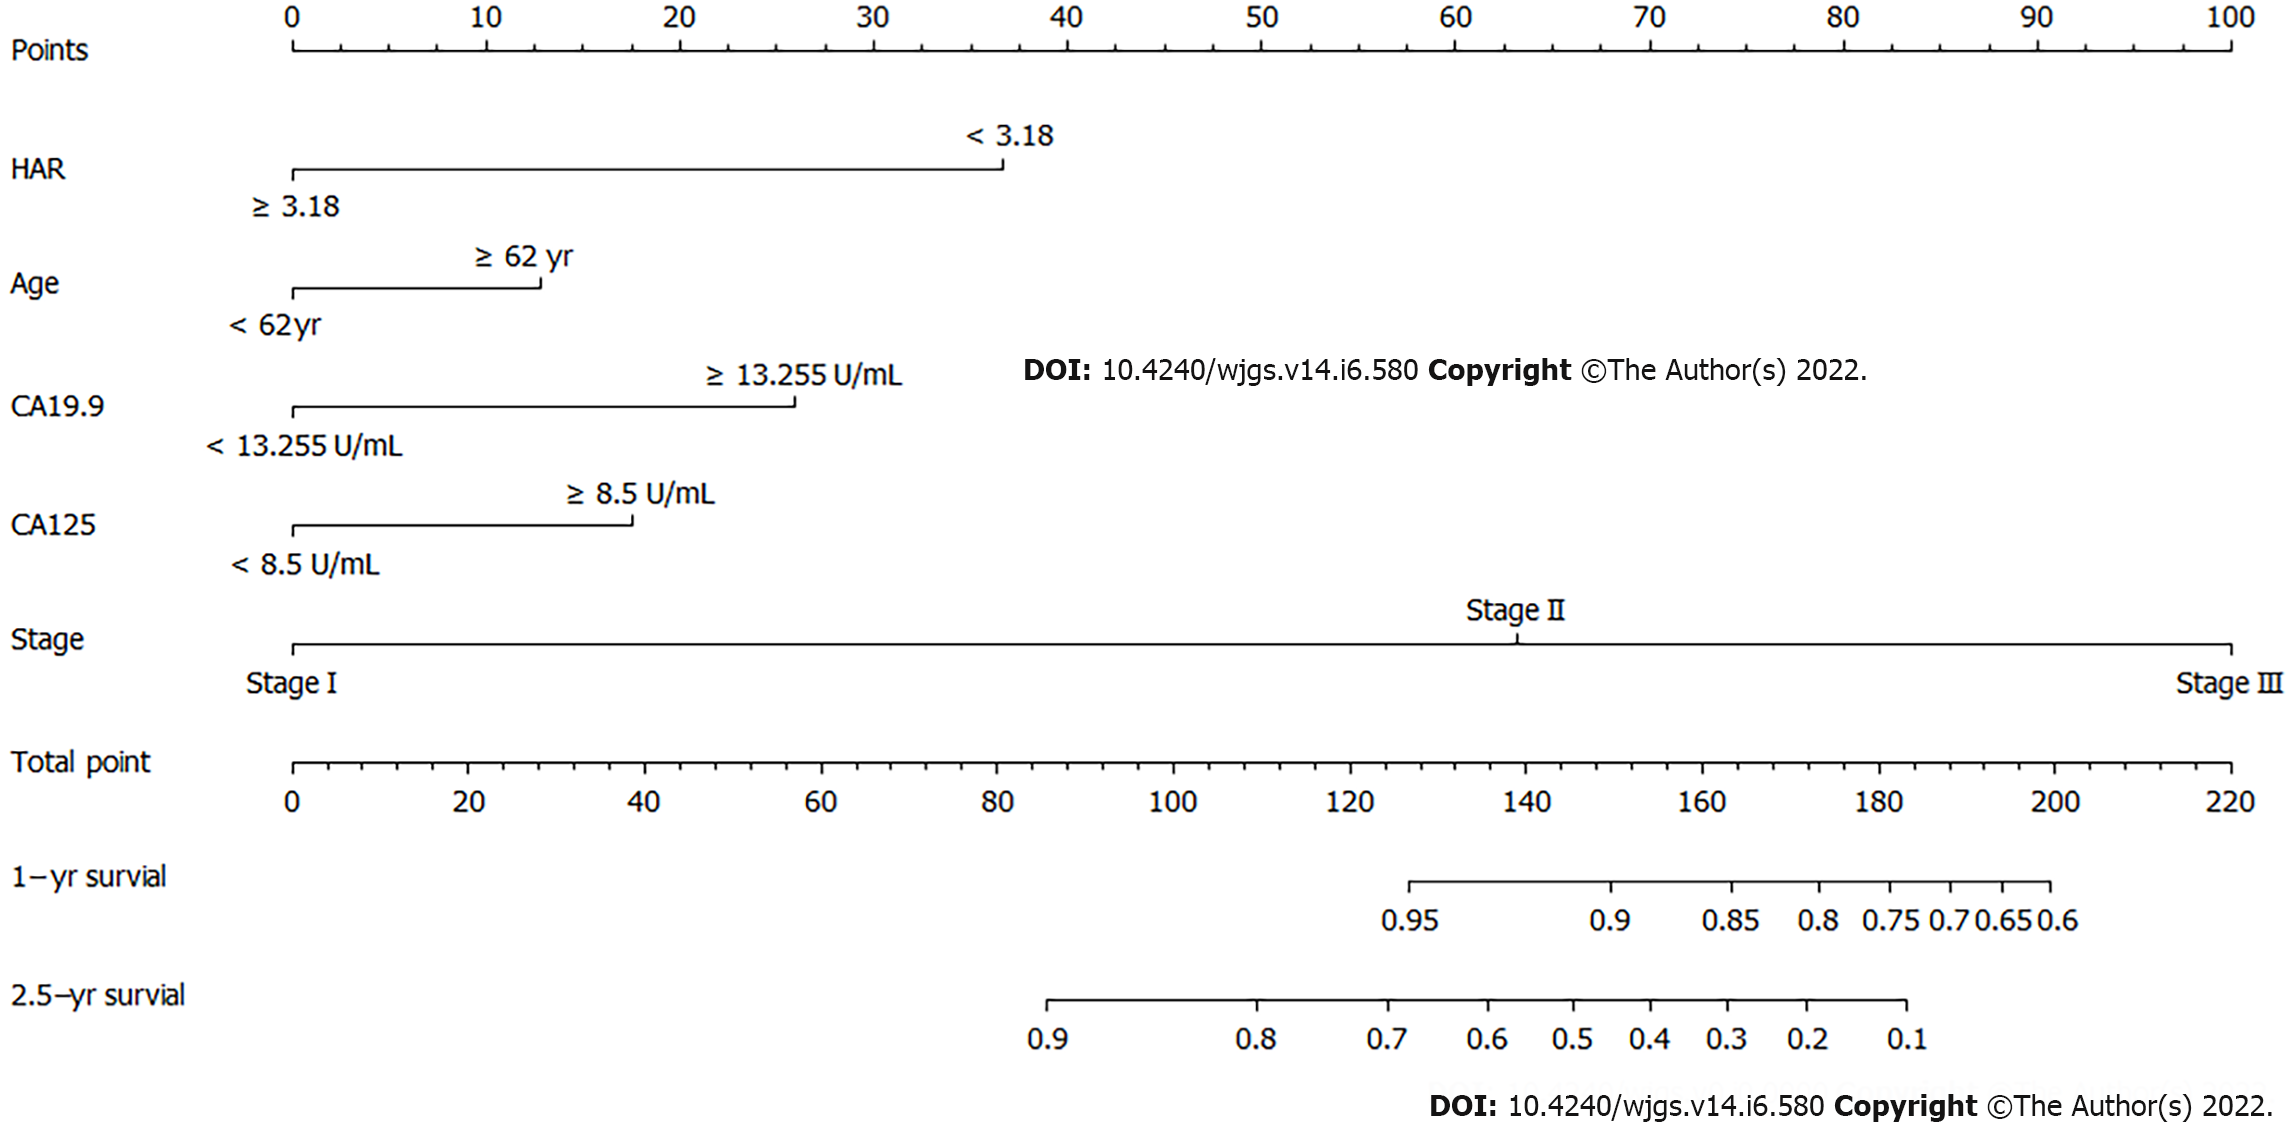
Figure 5 Nomogram of the logistic regression model.
HAR: Hemoglobin to albumin ratio.
- Citation: Hu CG, Hu BE, Zhu JF, Zhu ZM, Huang C. Prognostic significance of the preoperative hemoglobin to albumin ratio for the short-term survival of gastric cancer patients . World J Gastrointest Surg 2022; 14(6): 580-593
- URL: https://www.wjgnet.com/1948-9366/full/v14/i6/580.htm
- DOI: https://dx.doi.org/10.4240/wjgs.v14.i6.580


