Copyright
©The Author(s) 2022.
World J Gastrointest Surg. Nov 27, 2022; 14(11): 1250-1259
Published online Nov 27, 2022. doi: 10.4240/wjgs.v14.i11.1250
Published online Nov 27, 2022. doi: 10.4240/wjgs.v14.i11.1250
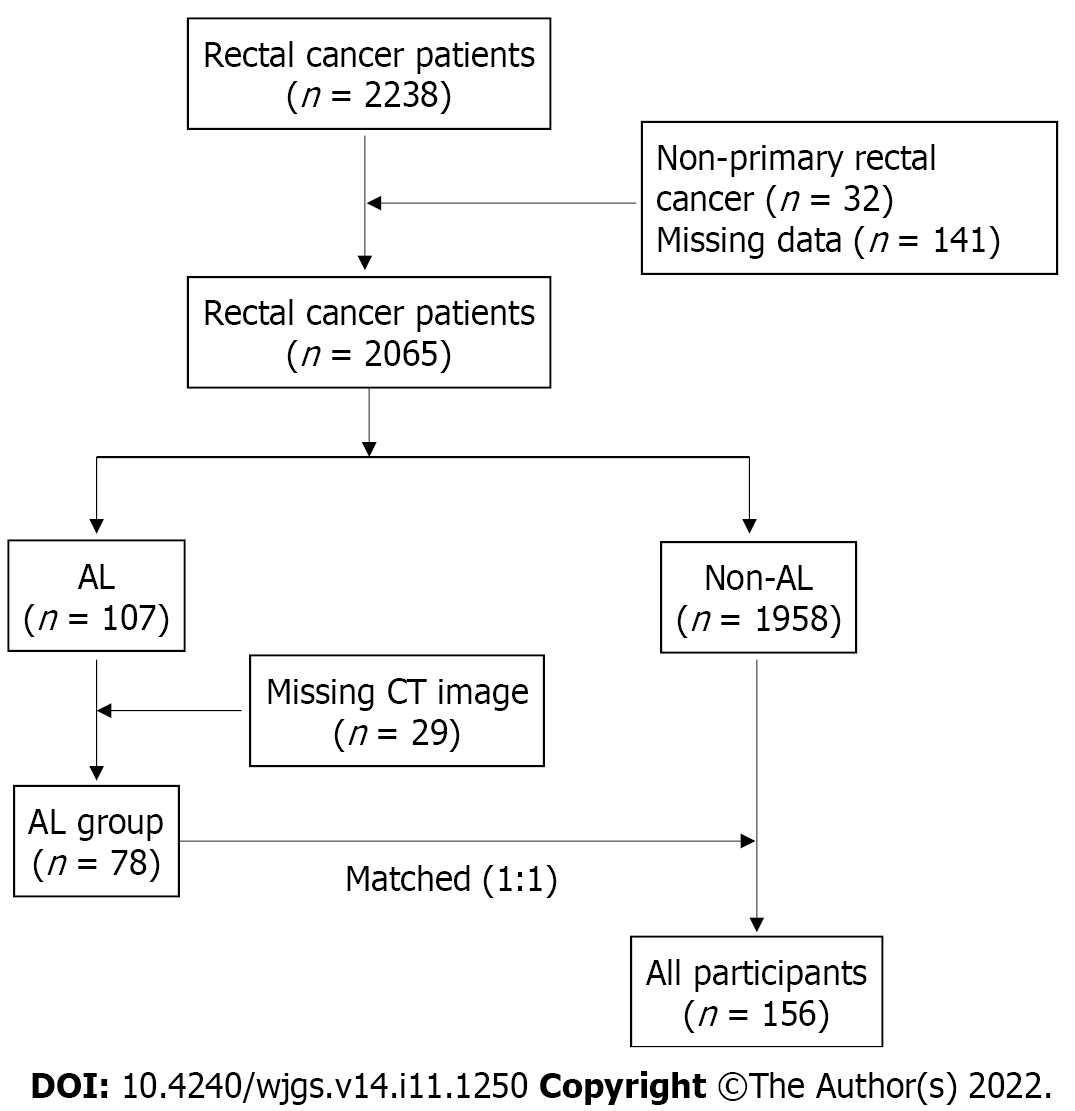
Figure 1
Flow chart of patient inclusion and exclusion.
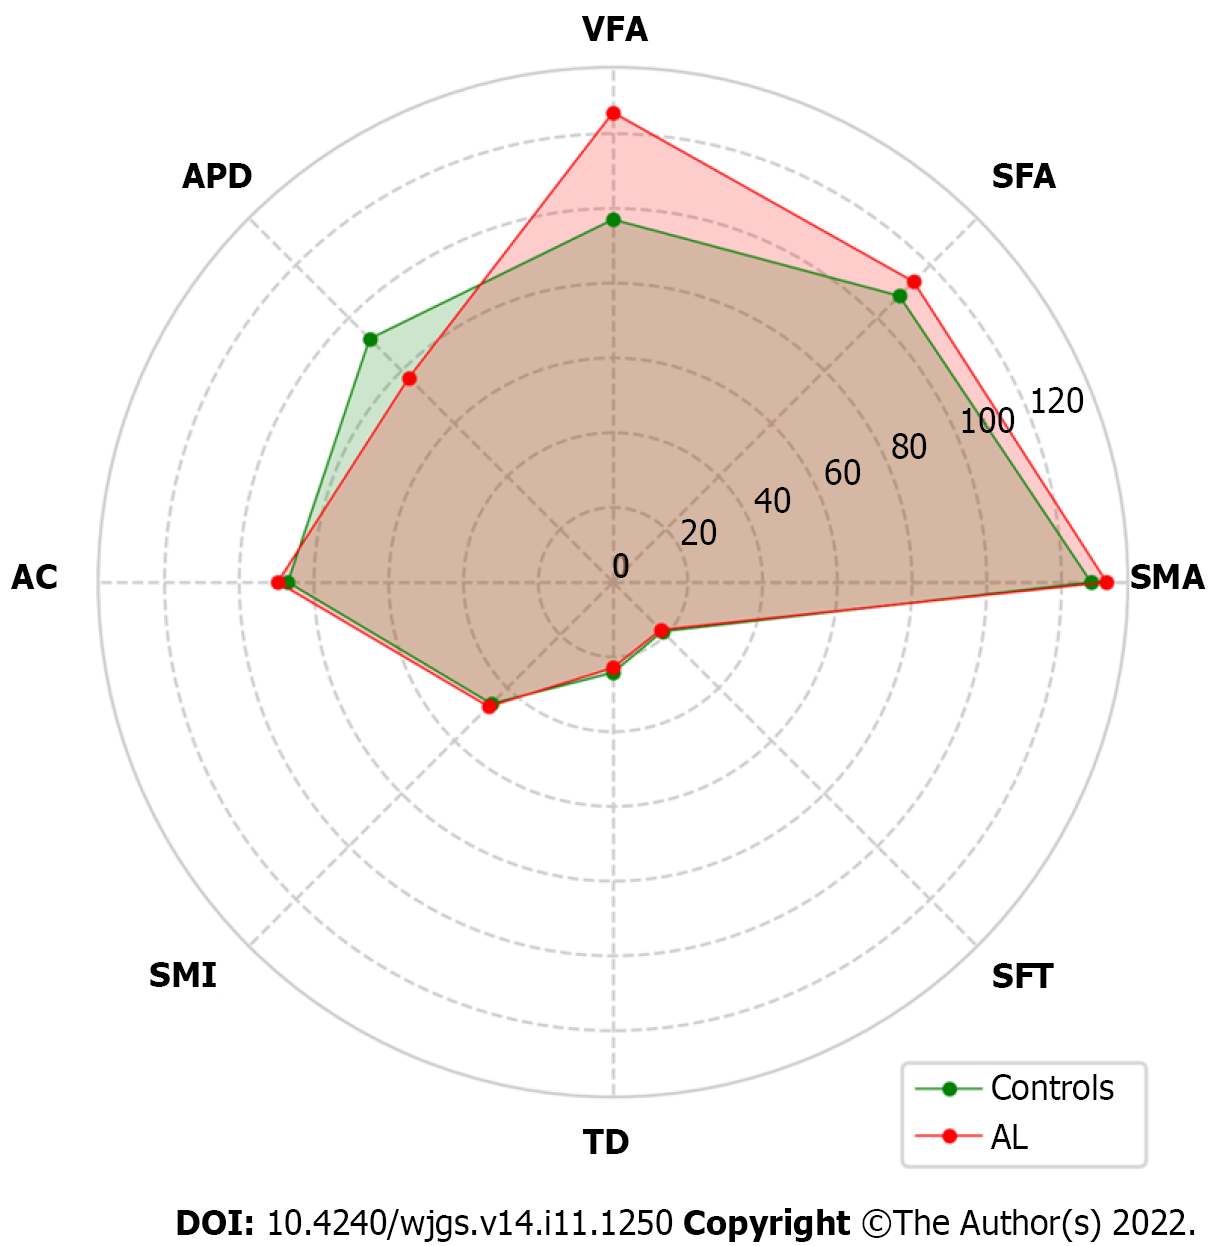
Figure 2 Radar plot for comparison of abdominal composition related parameters between the anastomotic leakage group and the control group.
AC: Abdominal circumference; SFA: Subcutaneous fat area; SFT: Subcutaneous fat thickness; SMA: Skeletal muscle area; SMI: Skeletal muscle index (SMA/height2); VFA: Visceral fat area; APD: Anterior to posterior diameter of abdominal cavity; TD: Transverse diameter of abdominal cavity; AL: Anastomotic leakage.
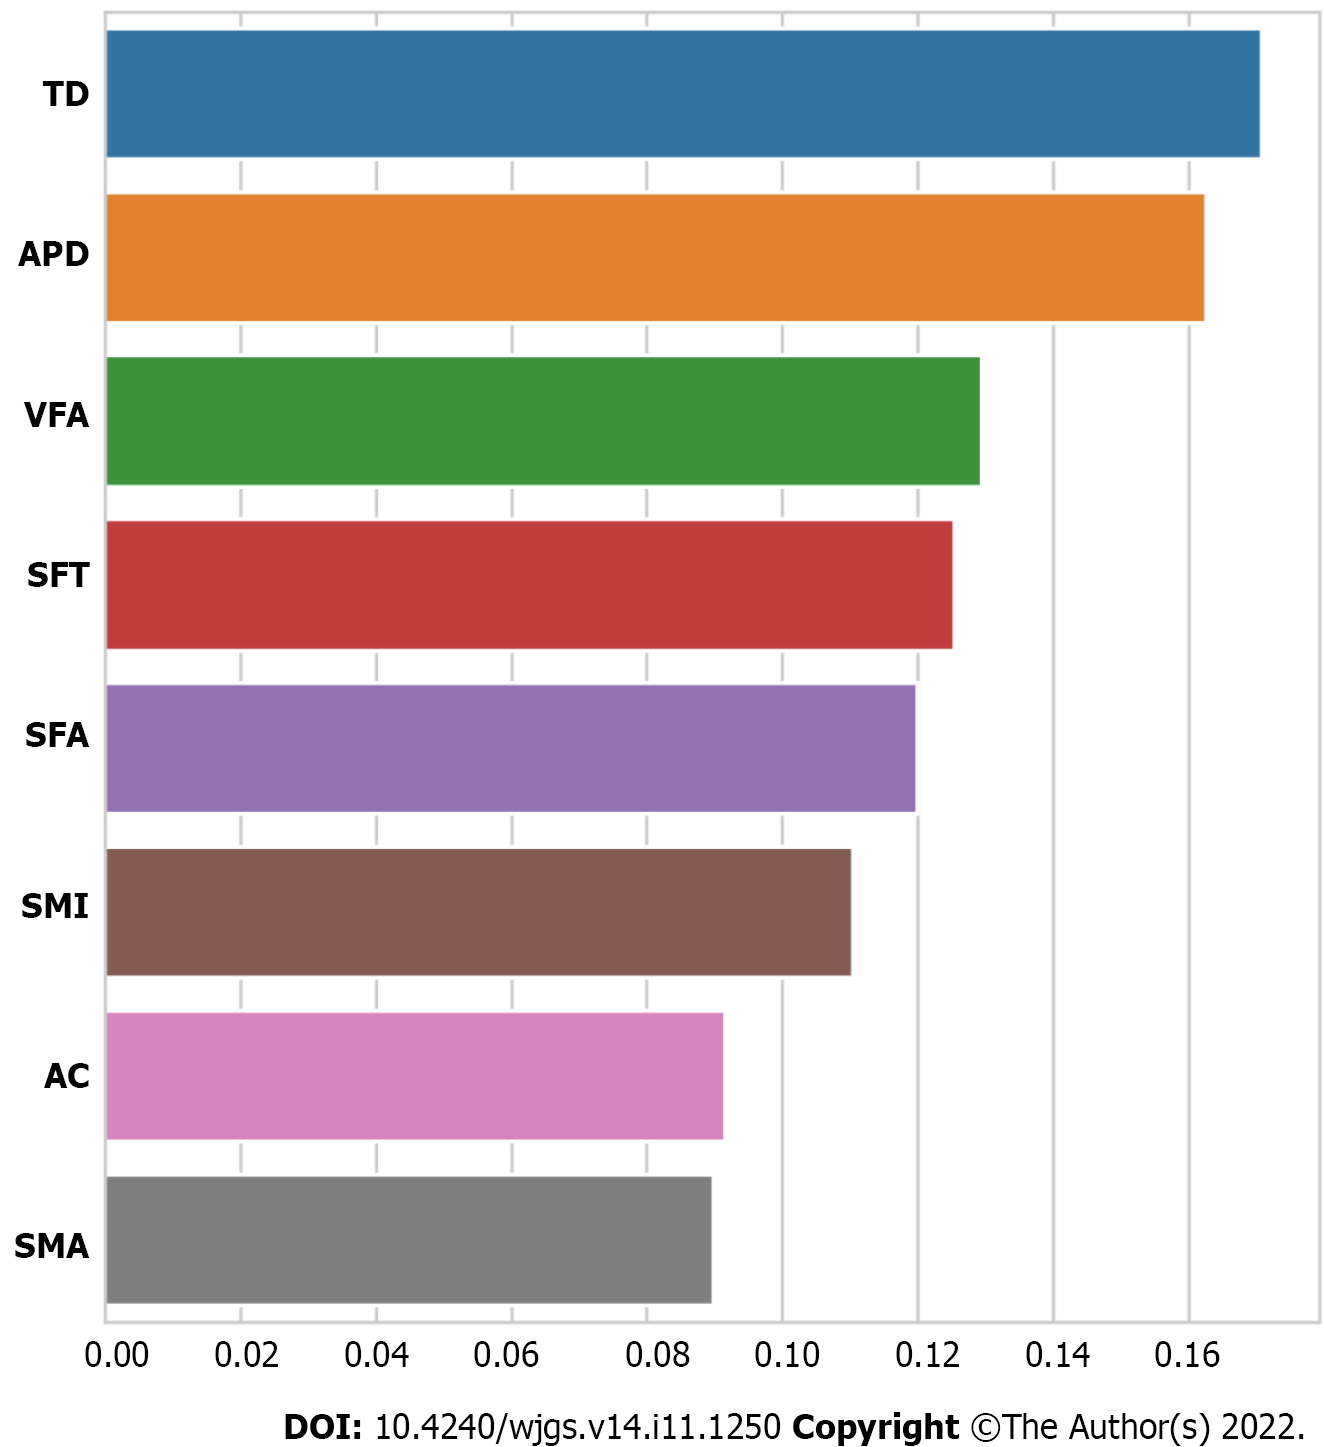
Figure 3 Importance of each feature in the development of anastomotic leakage.
AC: Abdominal circumference; SFA: Subcutaneous fat area; SFT: Subcutaneous fat thickness; SMA: Skeletal muscle area; SMI: Skeletal muscle index (SMA/height2); VFA: Visceral fat area; APD: Anterior to posterior diameter of abdominal cavity; TD: Transverse diameter of abdominal cavity; AL: Anastomotic leakage.
- Citation: Shao SL, Li YK, Qin JC, Liu L. Comprehensive abdominal composition evaluation of rectal cancer patients with anastomotic leakage compared with body mass index-matched controls. World J Gastrointest Surg 2022; 14(11): 1250-1259
- URL: https://www.wjgnet.com/1948-9366/full/v14/i11/1250.htm
- DOI: https://dx.doi.org/10.4240/wjgs.v14.i11.1250


