Copyright
©The Author(s) 2022.
World J Gastrointest Surg. Nov 27, 2022; 14(11): 1230-1249
Published online Nov 27, 2022. doi: 10.4240/wjgs.v14.i11.1230
Published online Nov 27, 2022. doi: 10.4240/wjgs.v14.i11.1230
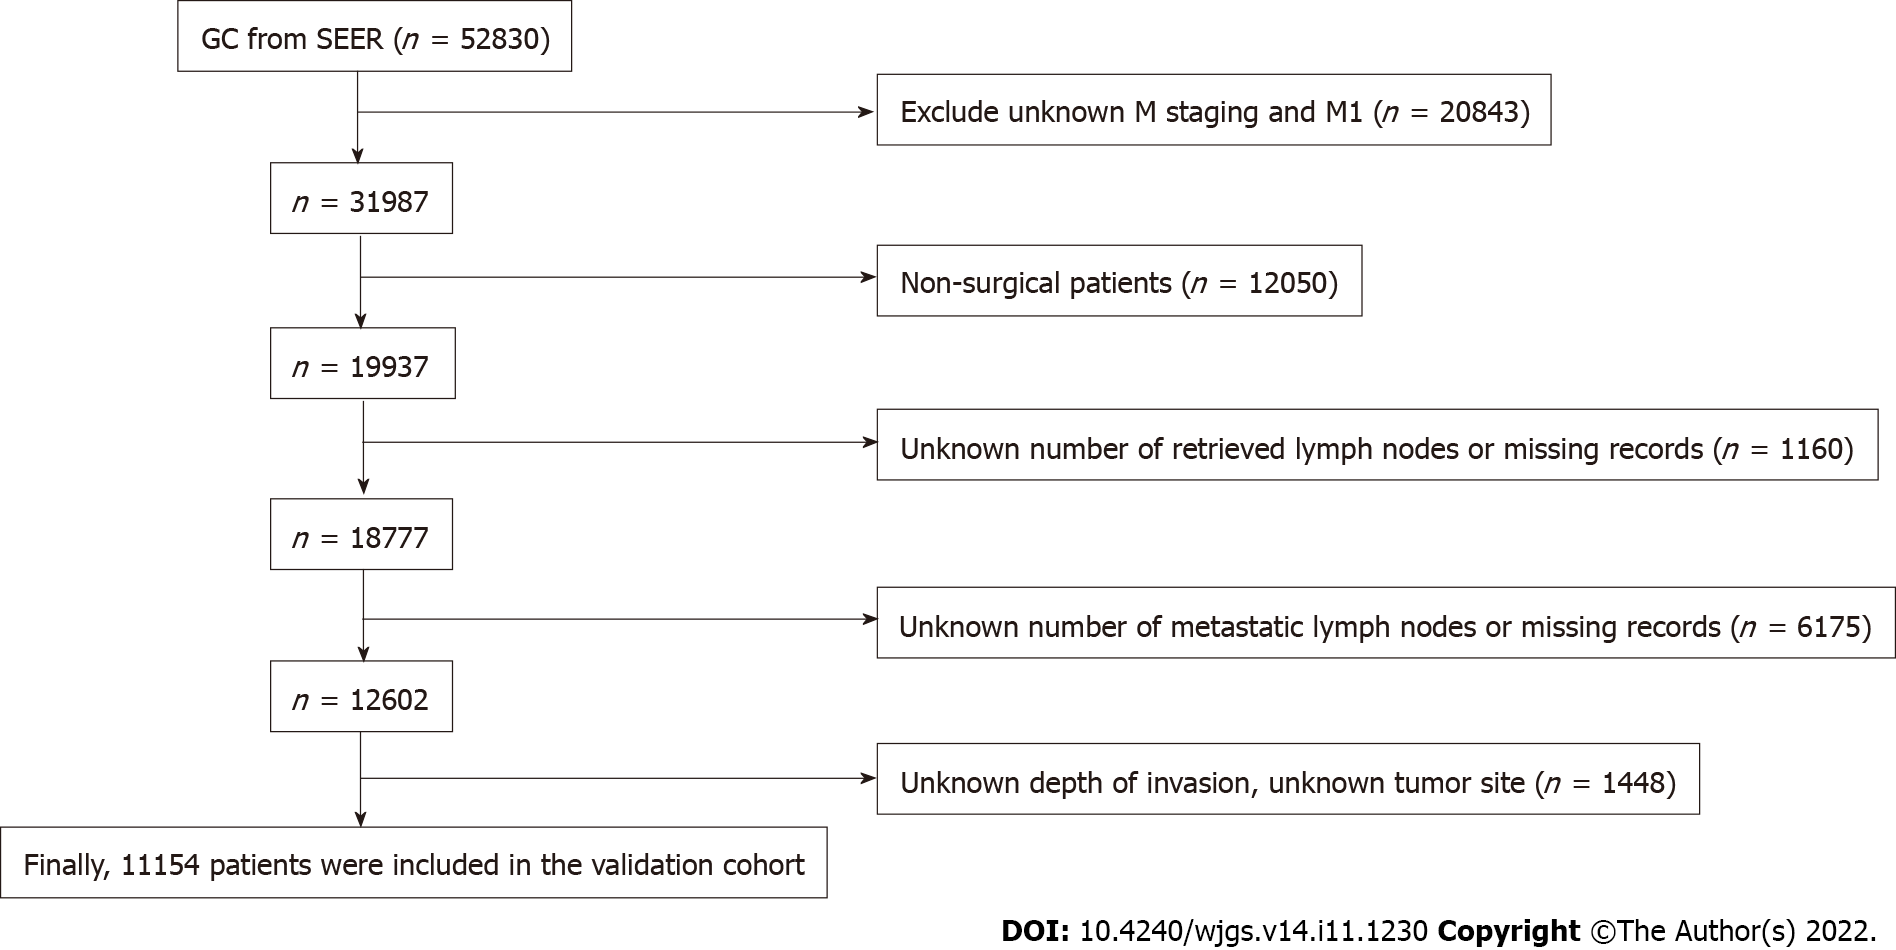
Figure 1 Flow chart of Surveillance, Epidemiology, and End Results database screening process based on exclusion criteria.
GC: Gastric cancer; SEER: Surveillance, Epidemiology, and End Results.
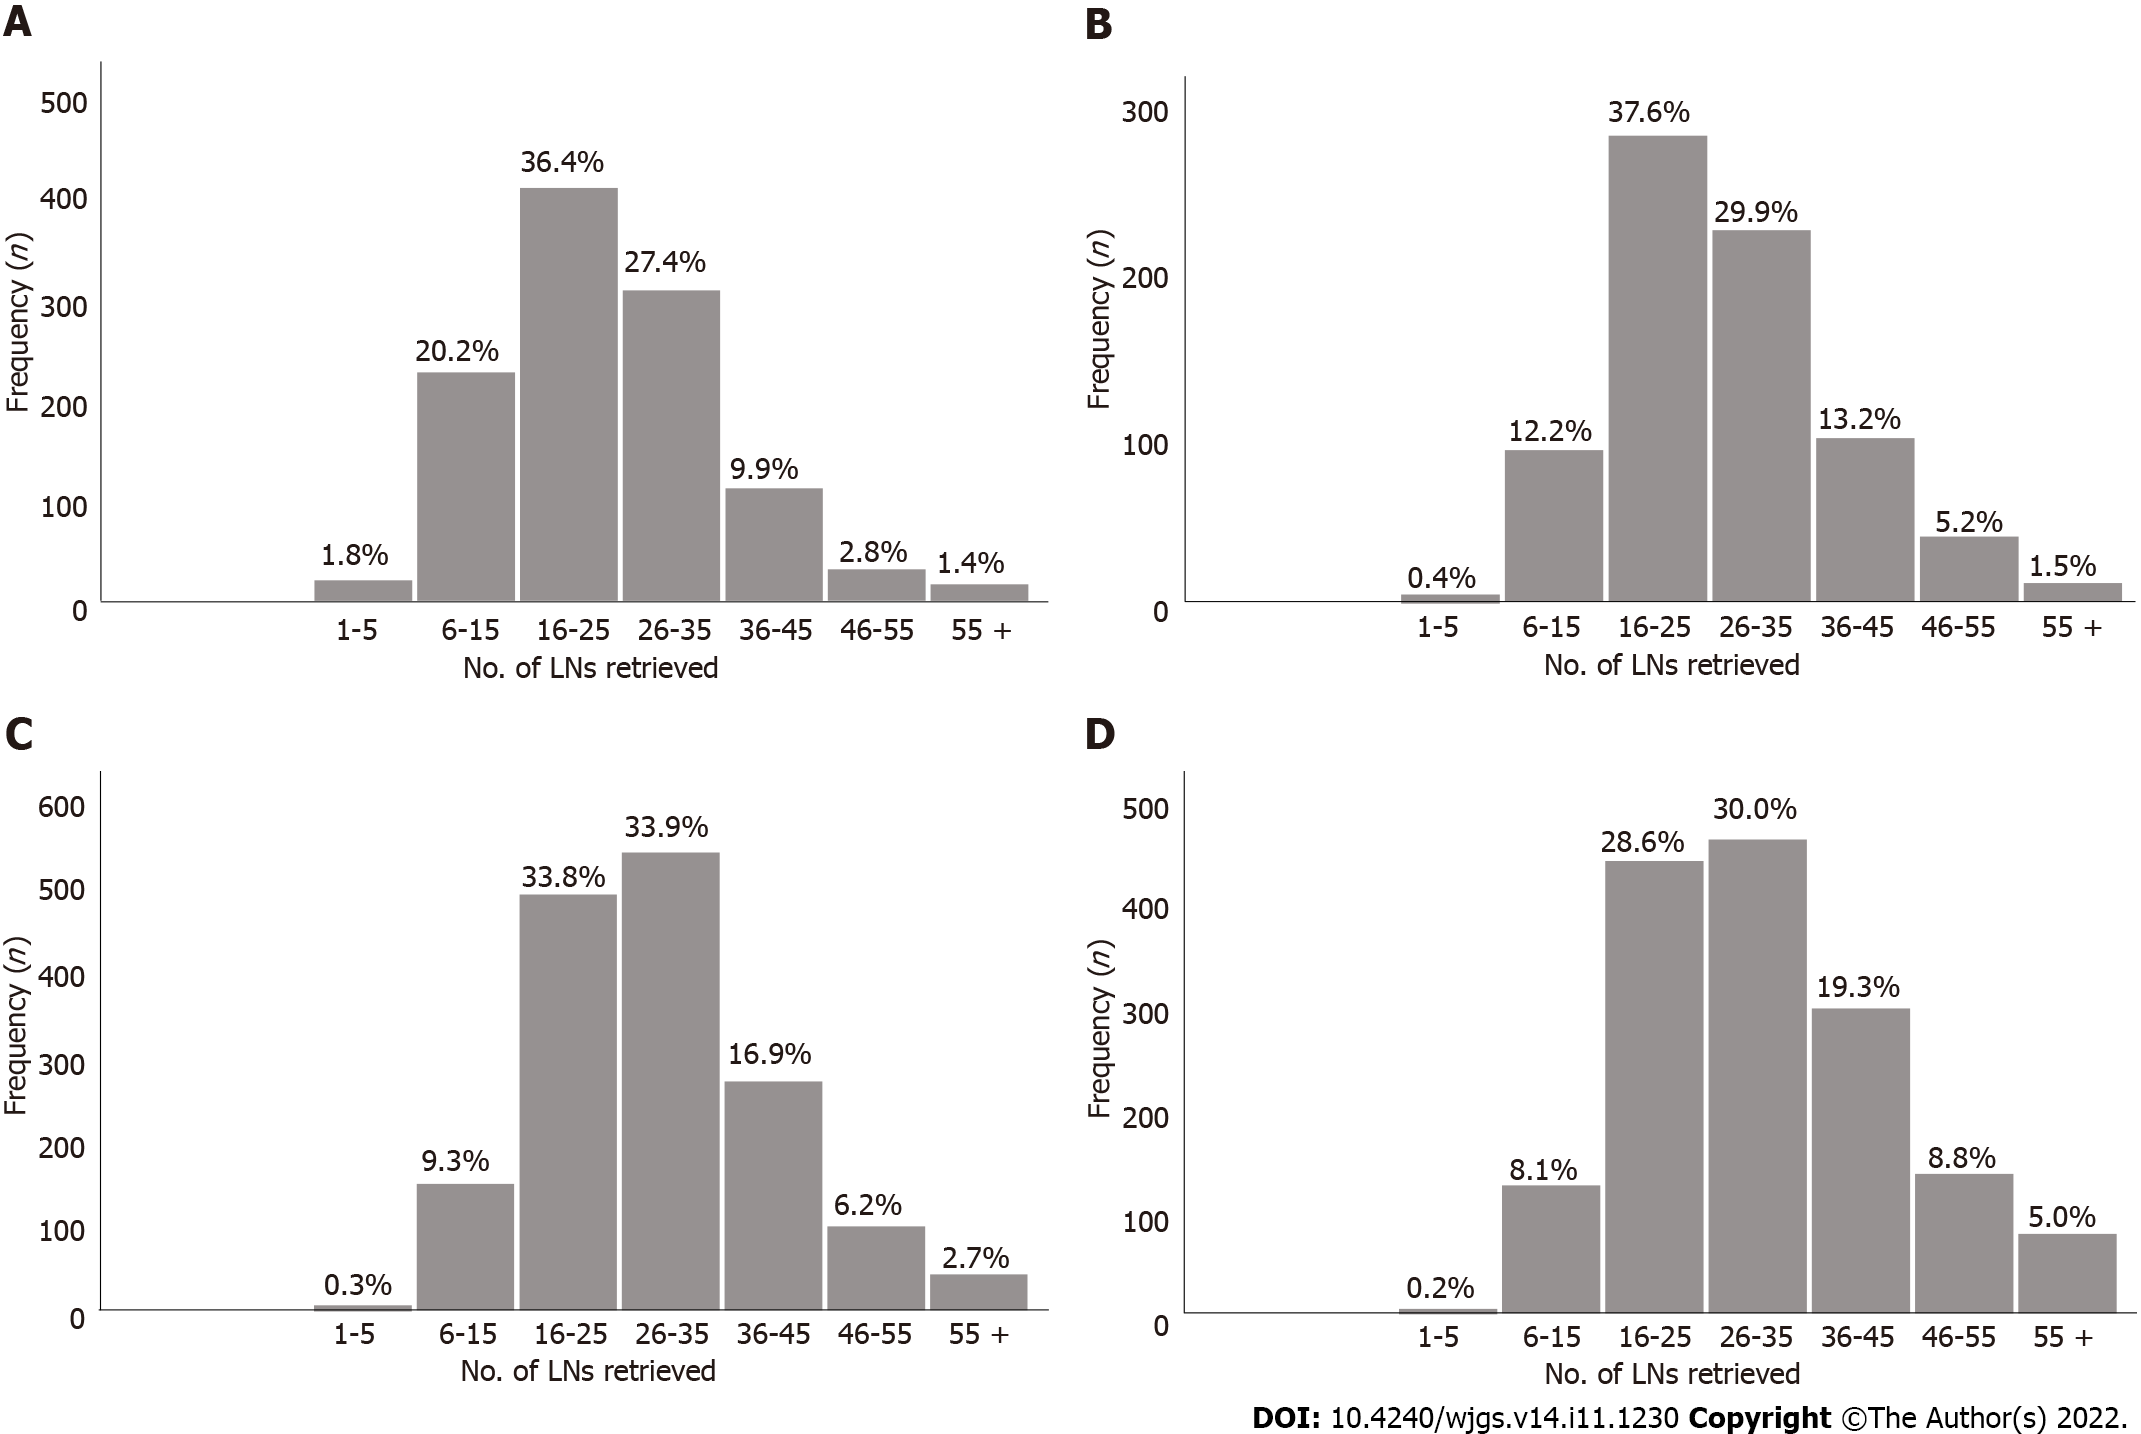
Figure 2 Number of lymph nodes examined for each stage subgroup in the training cohort.
A: pT1; B: pT2; C: pT3; D: pT4. LNs: Lymph nodes.
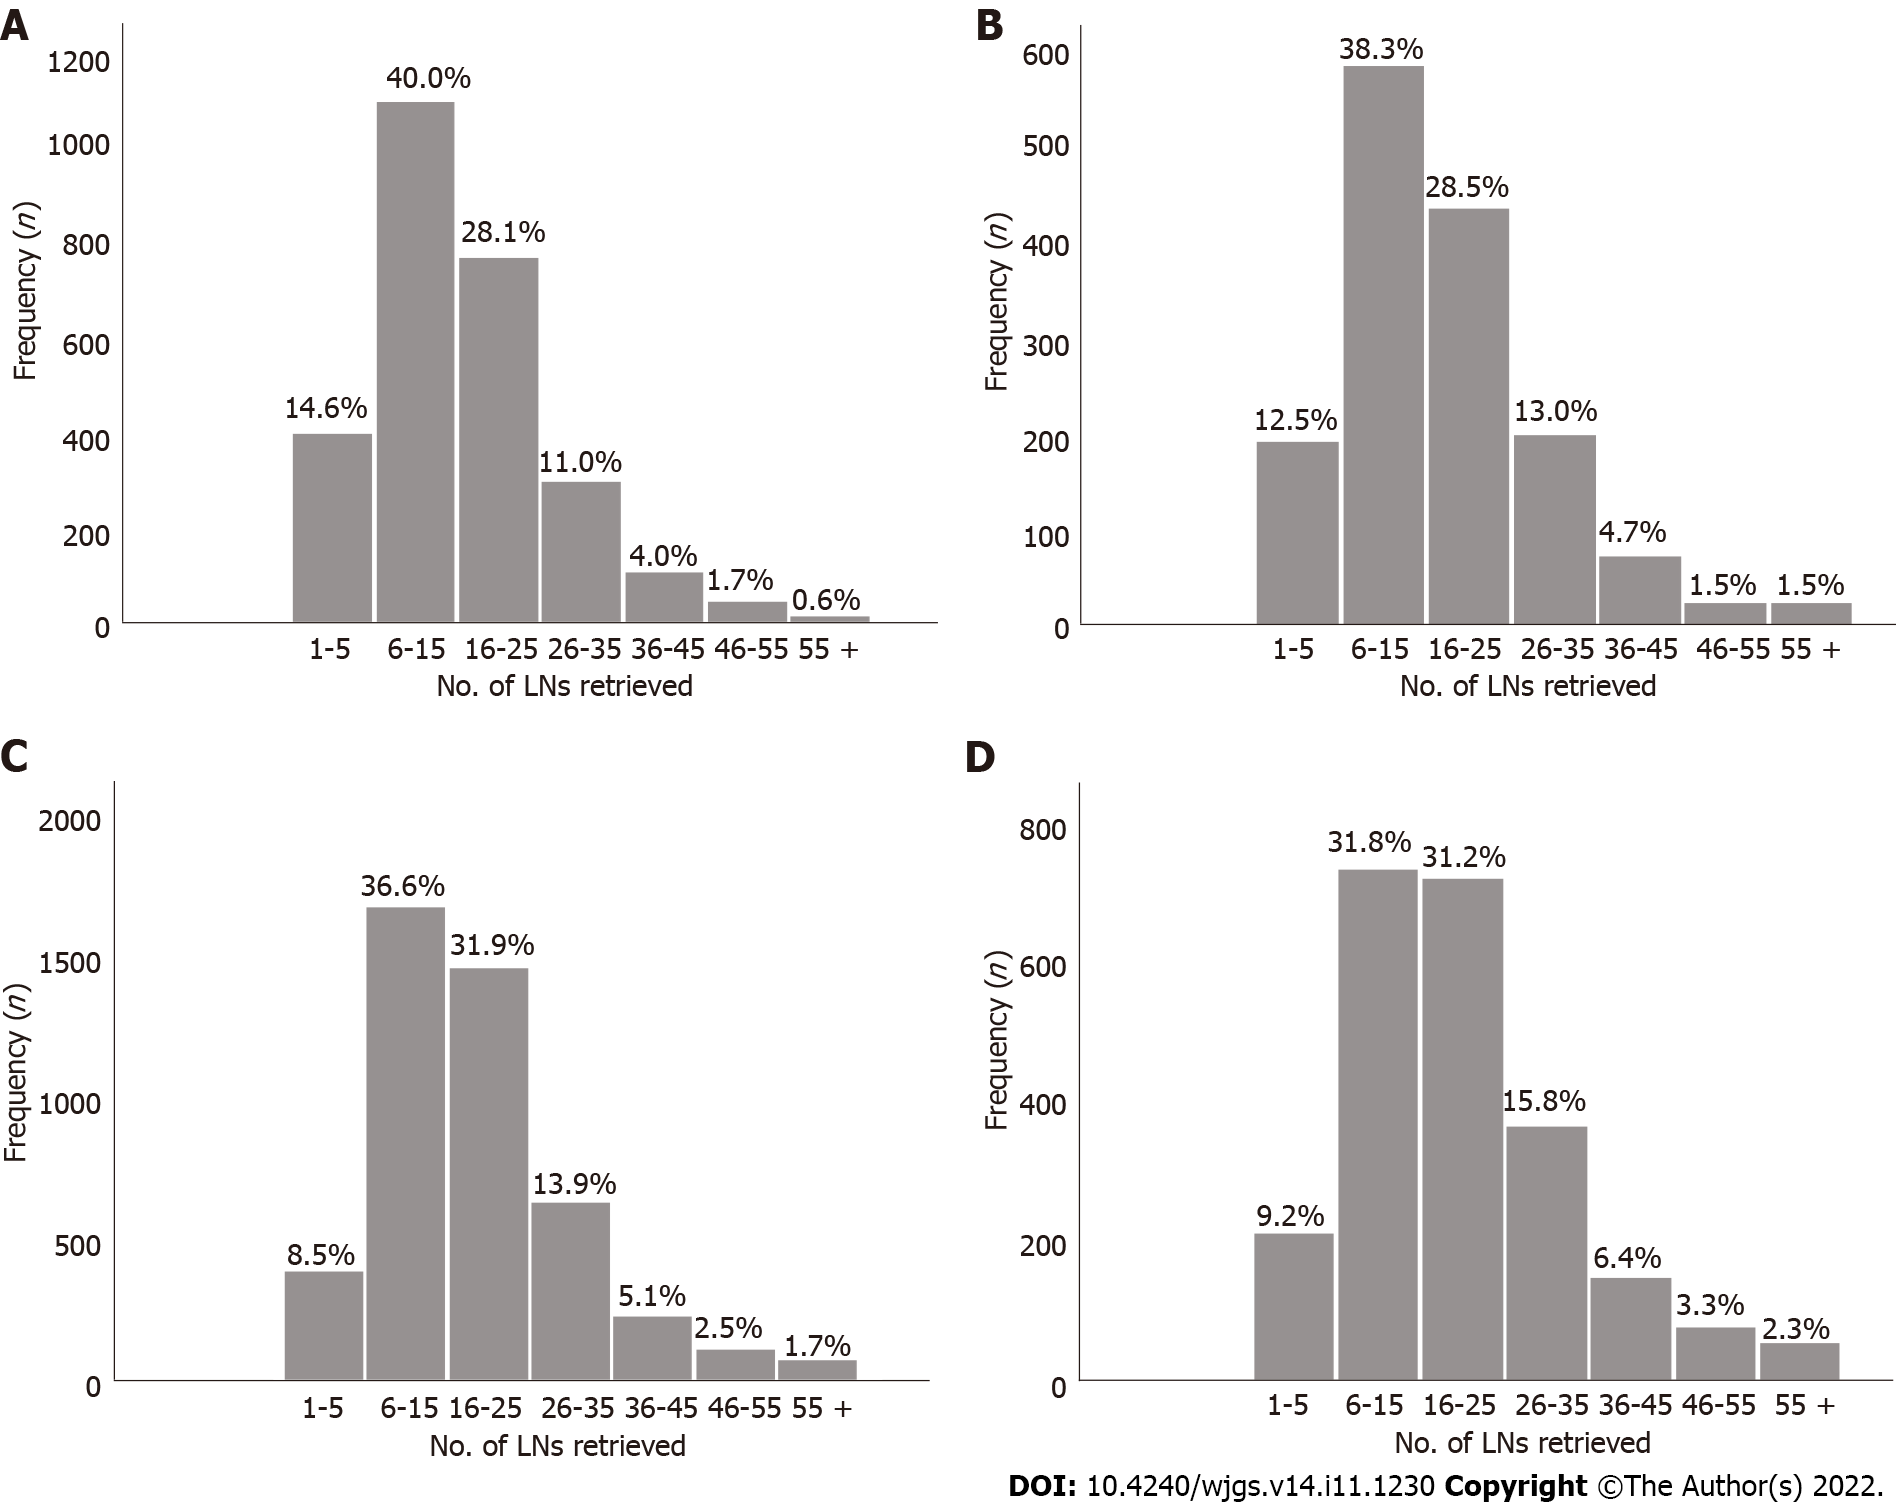
Figure 3 Number of lymph nodes examined for each stage subgroup in the validation cohort.
A: pT1; B: pT2; C: pT3; D: pT4. LNs: Lymph nodes.
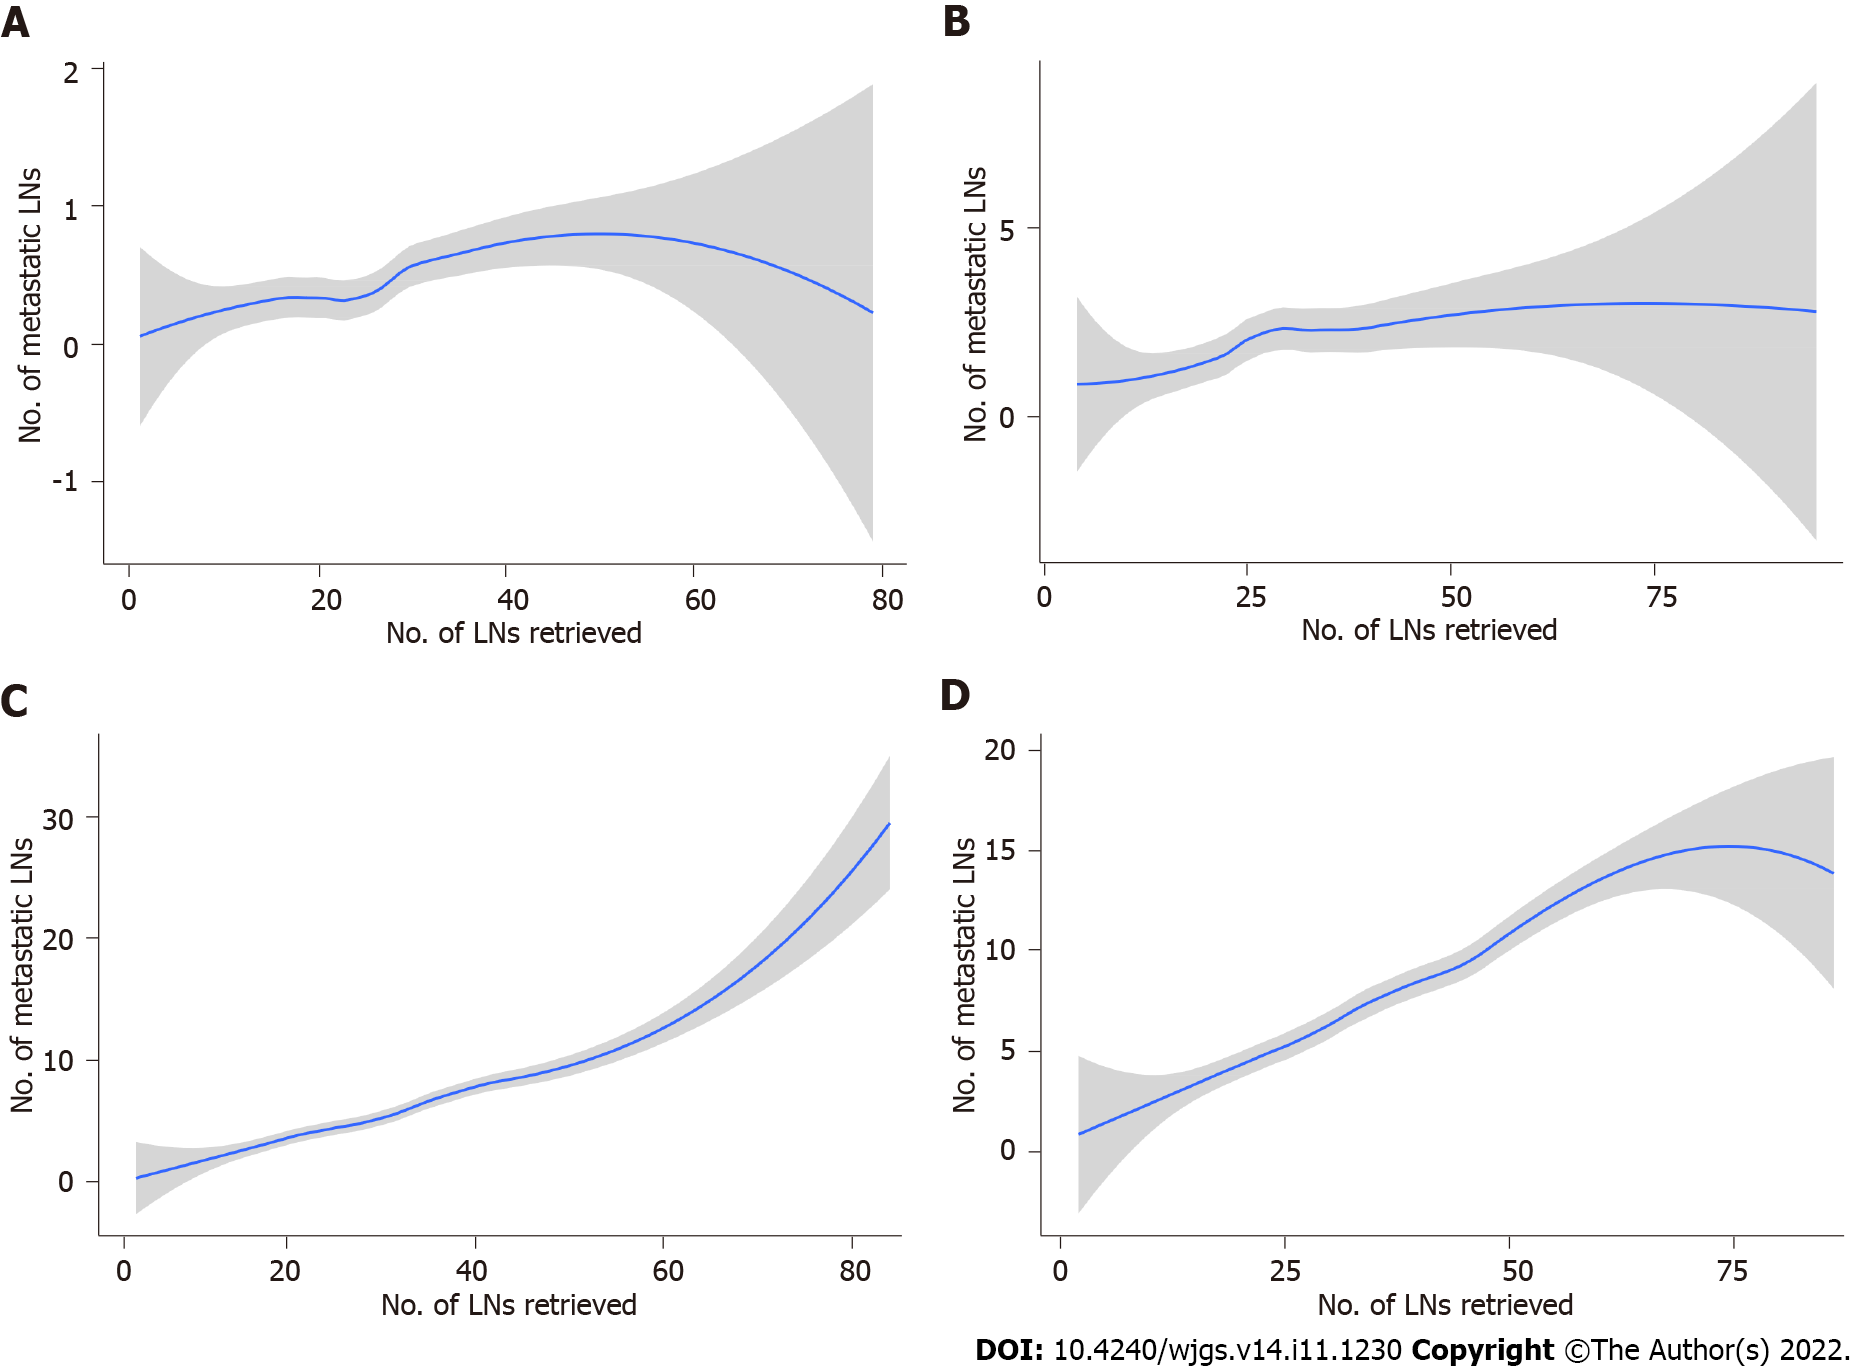
Figure 4 The association between the number of examined lymph nodes and the number of metastatic lymph nodes locally weighted smoothing in the Chinese training cohort.
A: pT1; B: pT2; C: pT3; D: pT4. The shaded area is the 95% confidence interval. LNs: Lymph nodes.
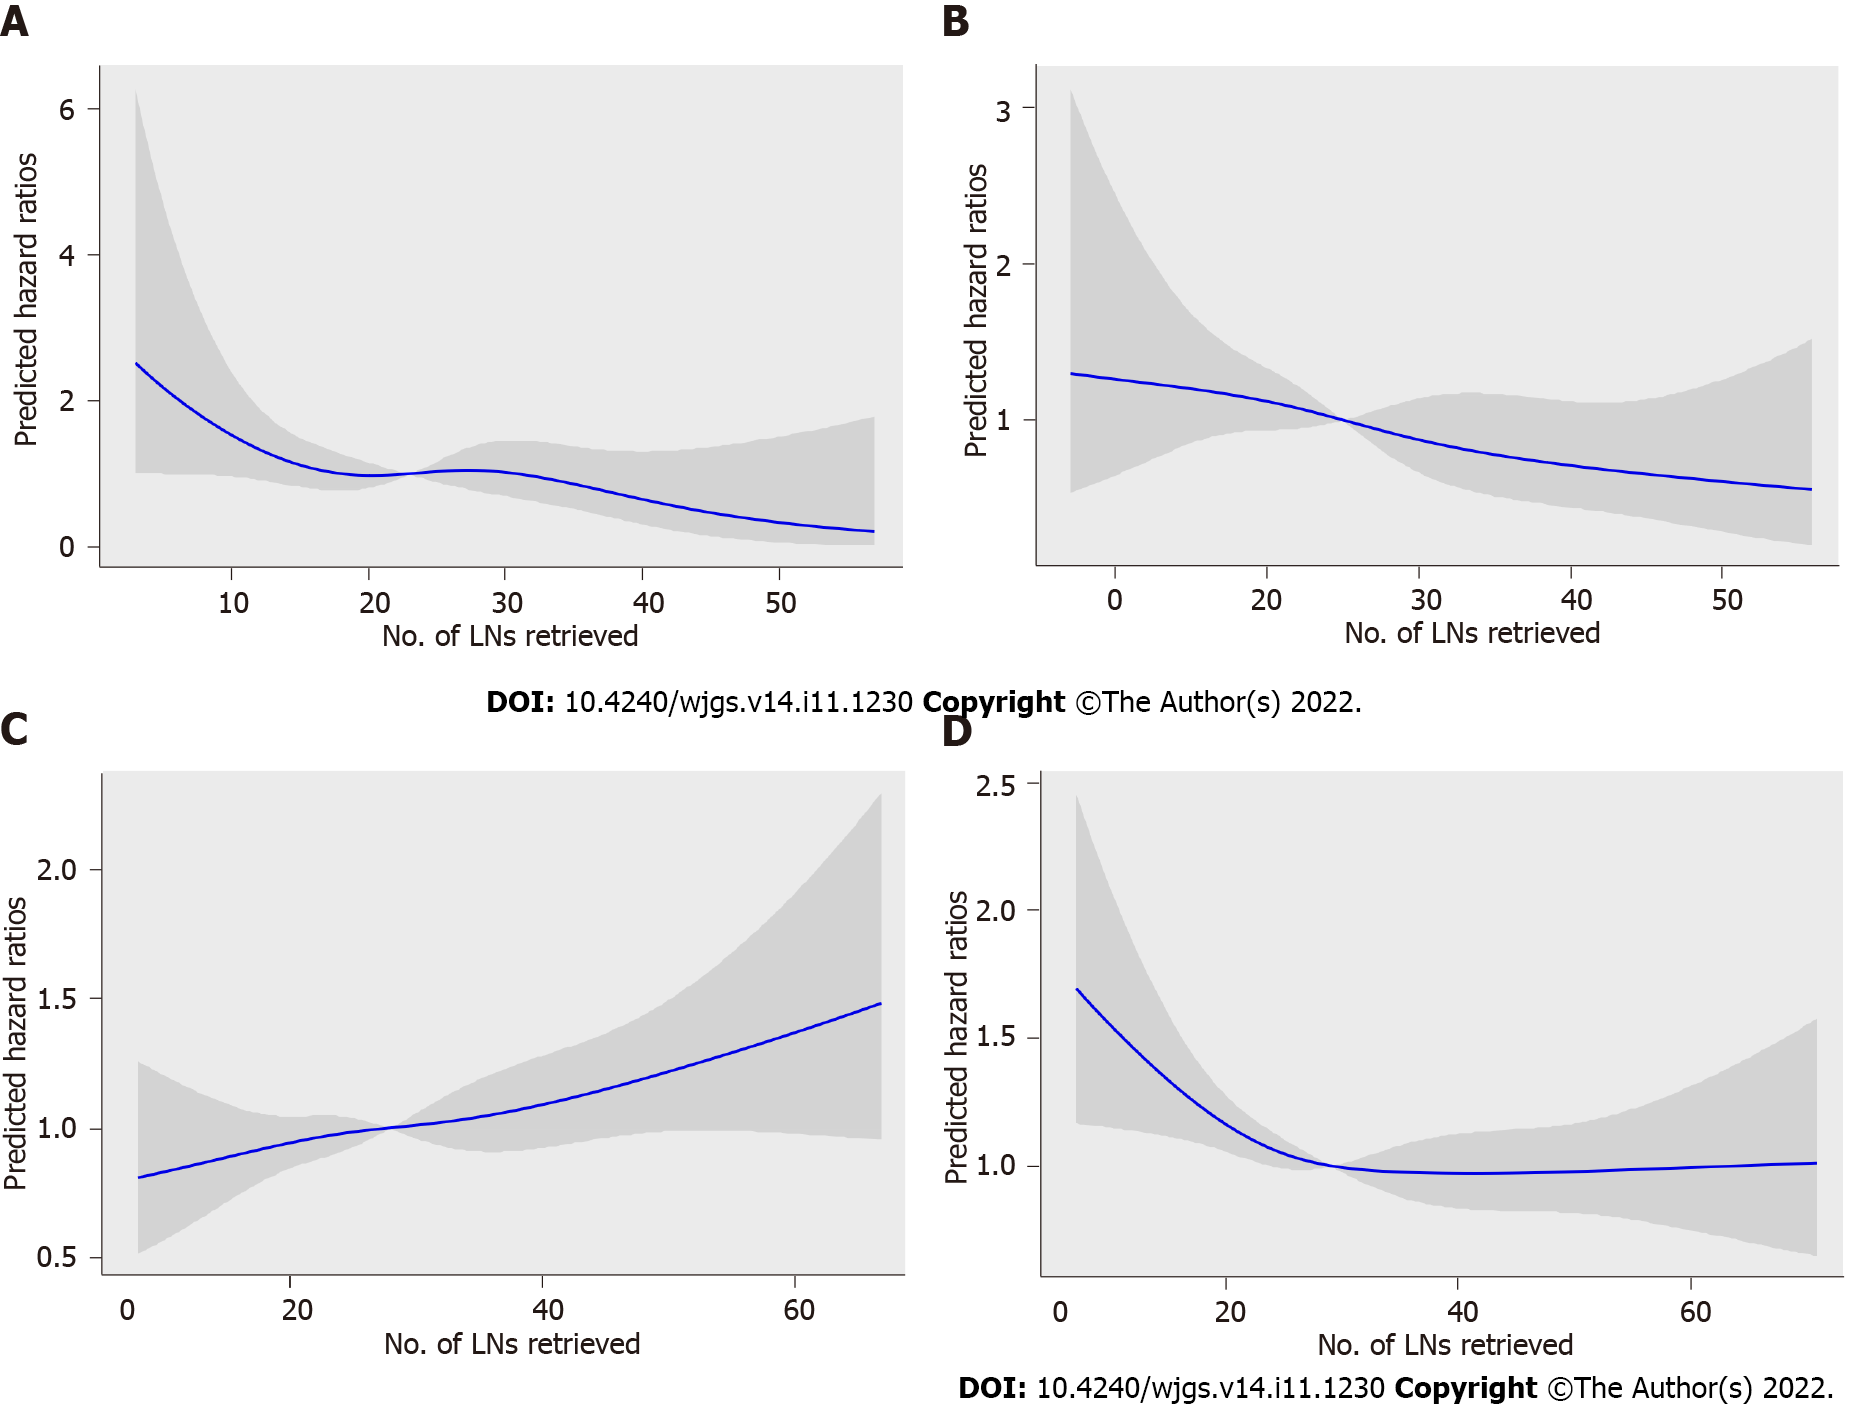
Figure 5 Association between the number of examined lymph nodes and the hazard ratios in the Chinese training cohort.
A: pT1; B: pT2; C: pT3; D: pT4. The blue line represents the estimated hazard ratios, and the shaded area is the 95% confidence interval. LNs: Lymph nodes; HRs: Hazard ratios.
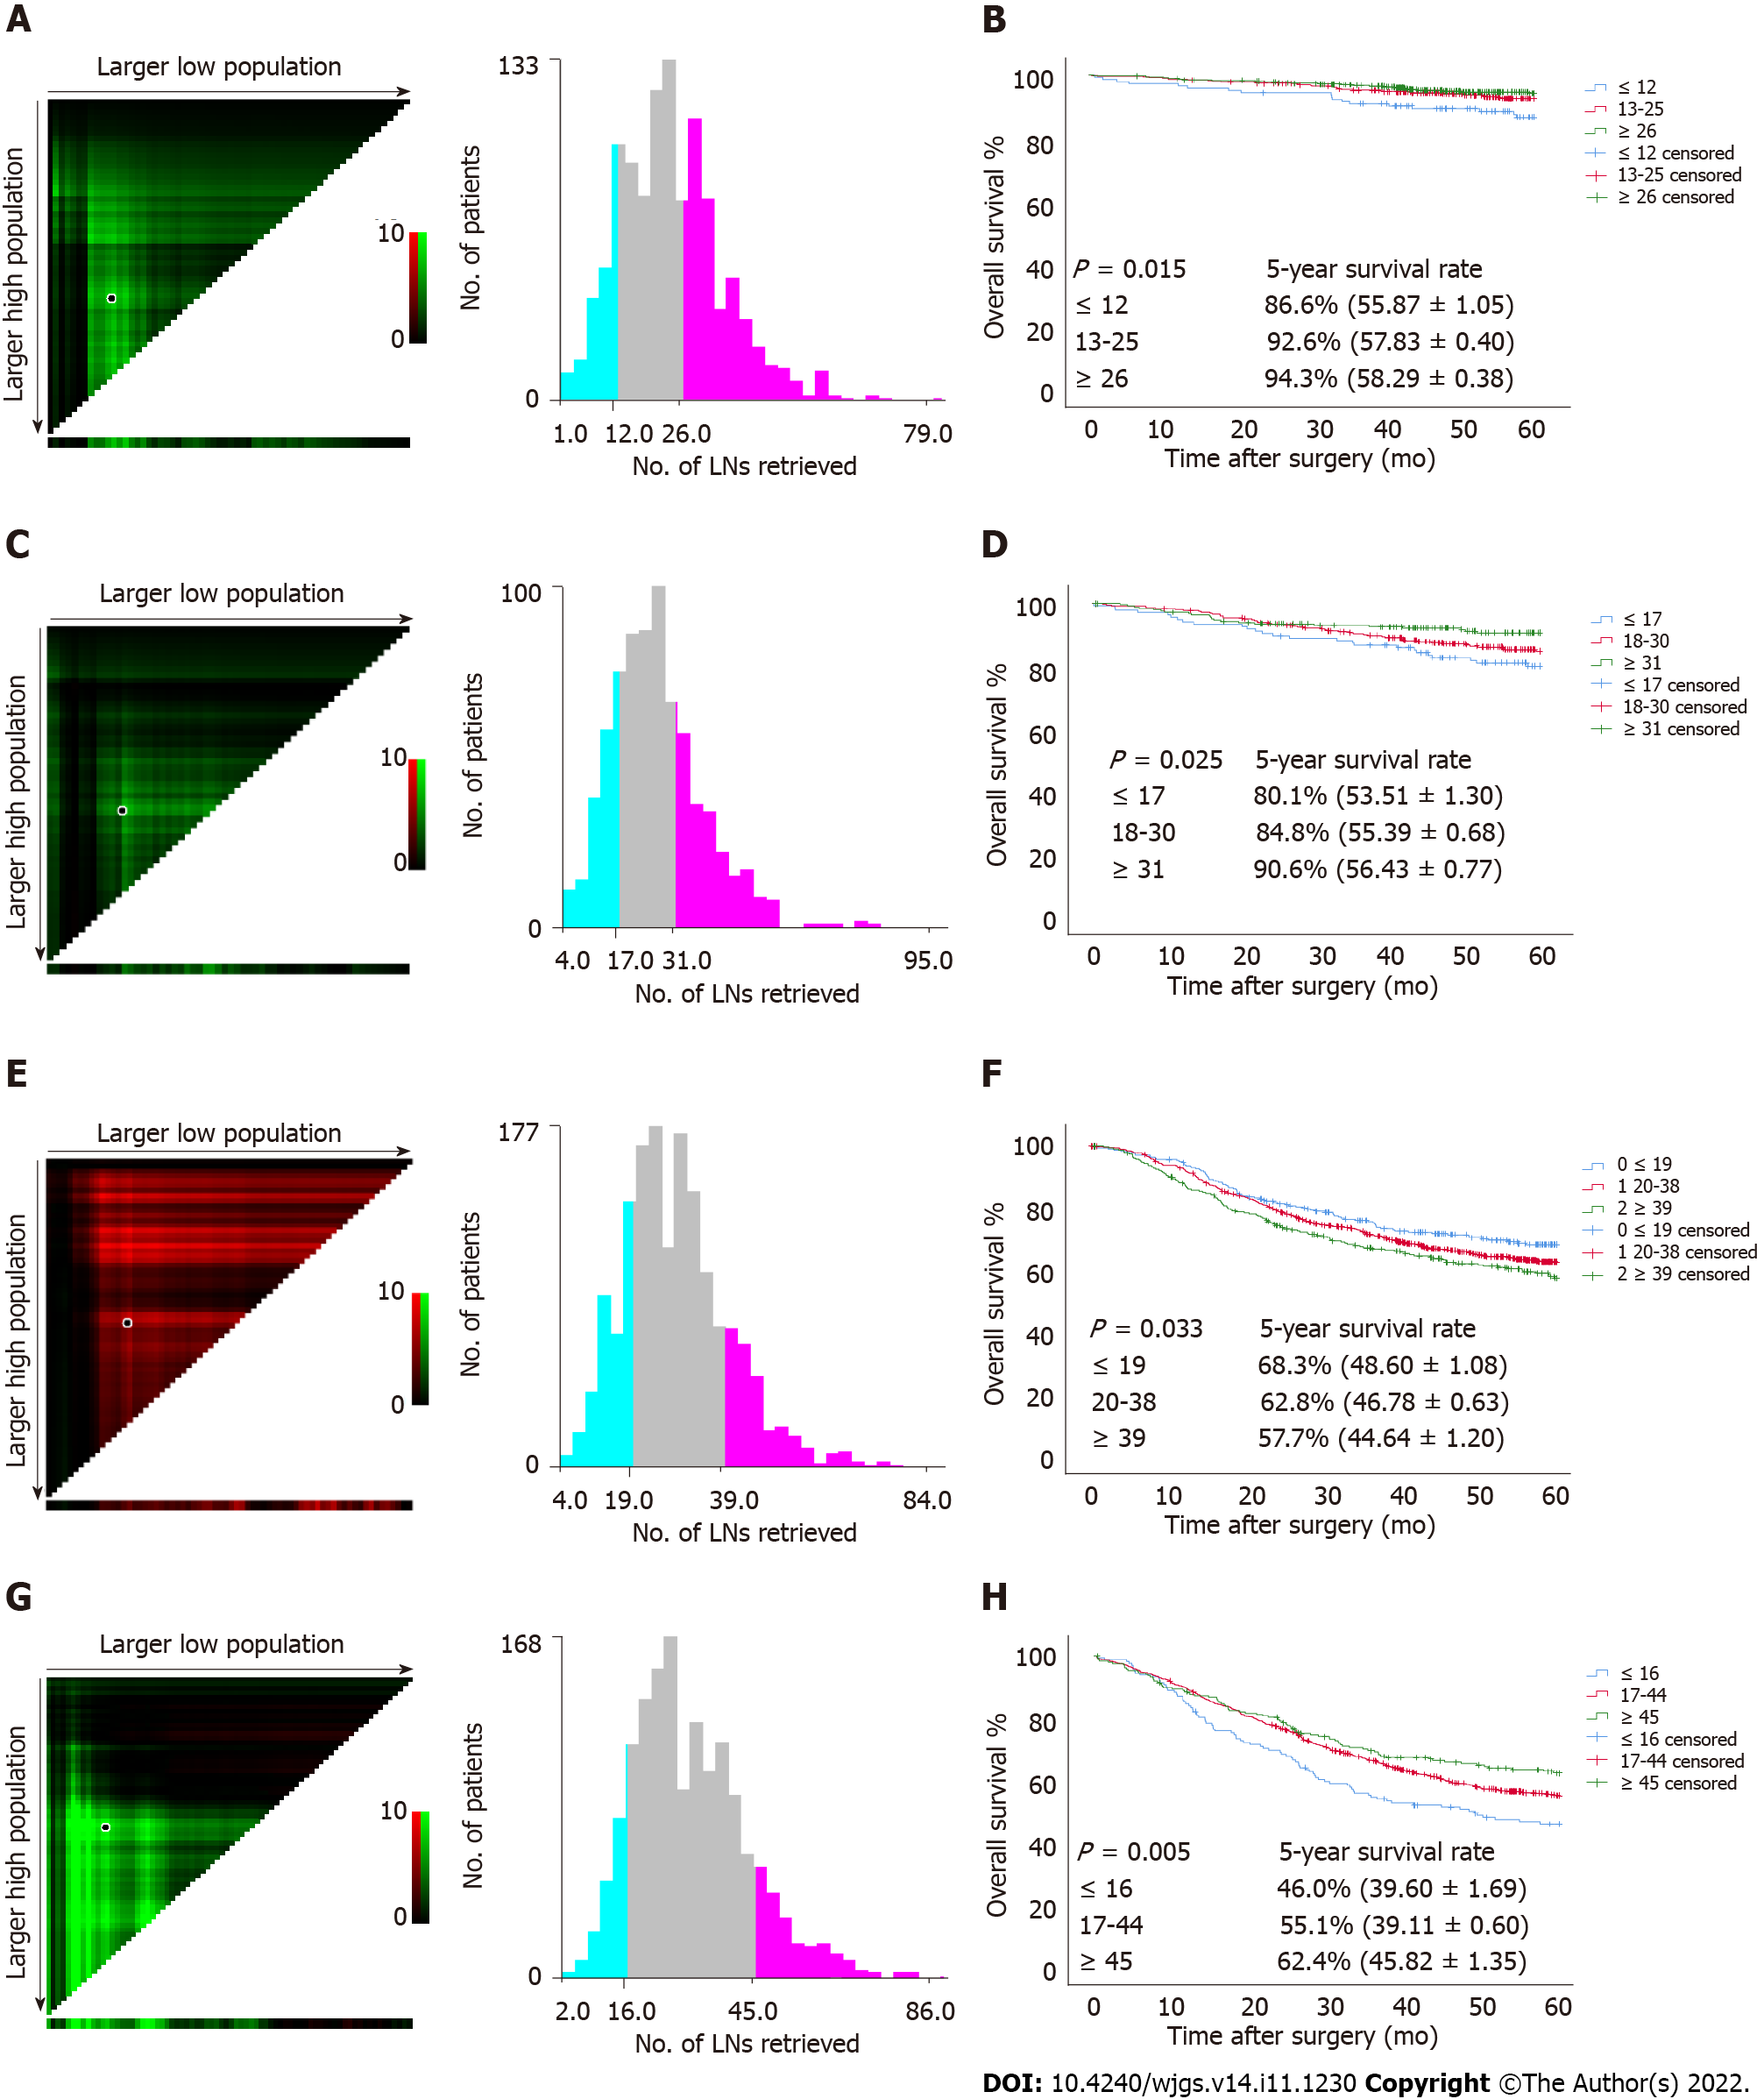
Figure 6 Estimation of the cutoff value of retrieved lymph nodes using X-tile software and overall survival curves of pT1-pT4 patients stratified by the estimated cutoff value in the Chinese training cohort.
A and B: pT1; C and D: pT2; E and F: pT3; G and H: pT4. LNs: Lymph nodes.
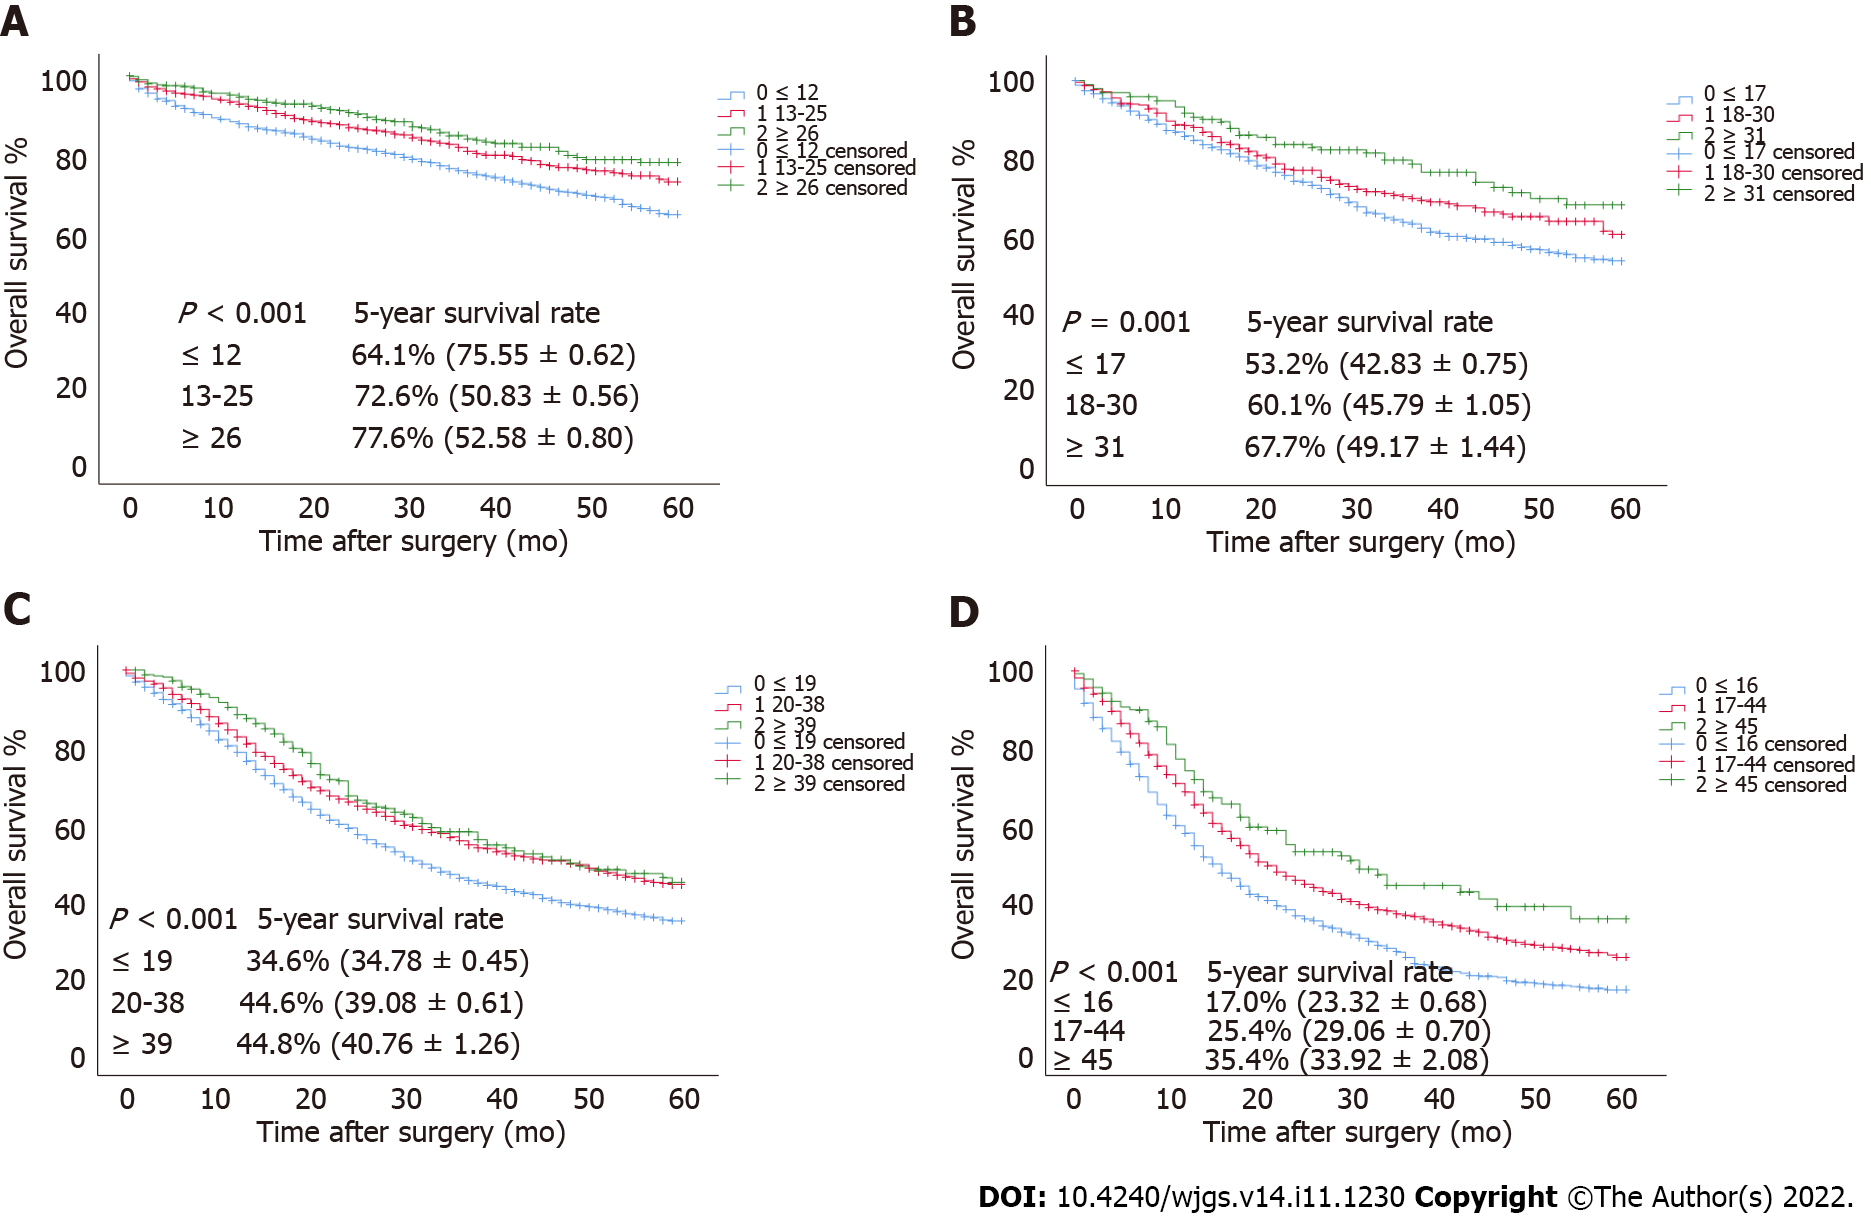
Figure 7 The overall survival curves of pT1-pT4 patients in the validation cohort stratified according to the estimated cutoff value.
A: pT1; B: pT2; C: pT3; D: pT4.
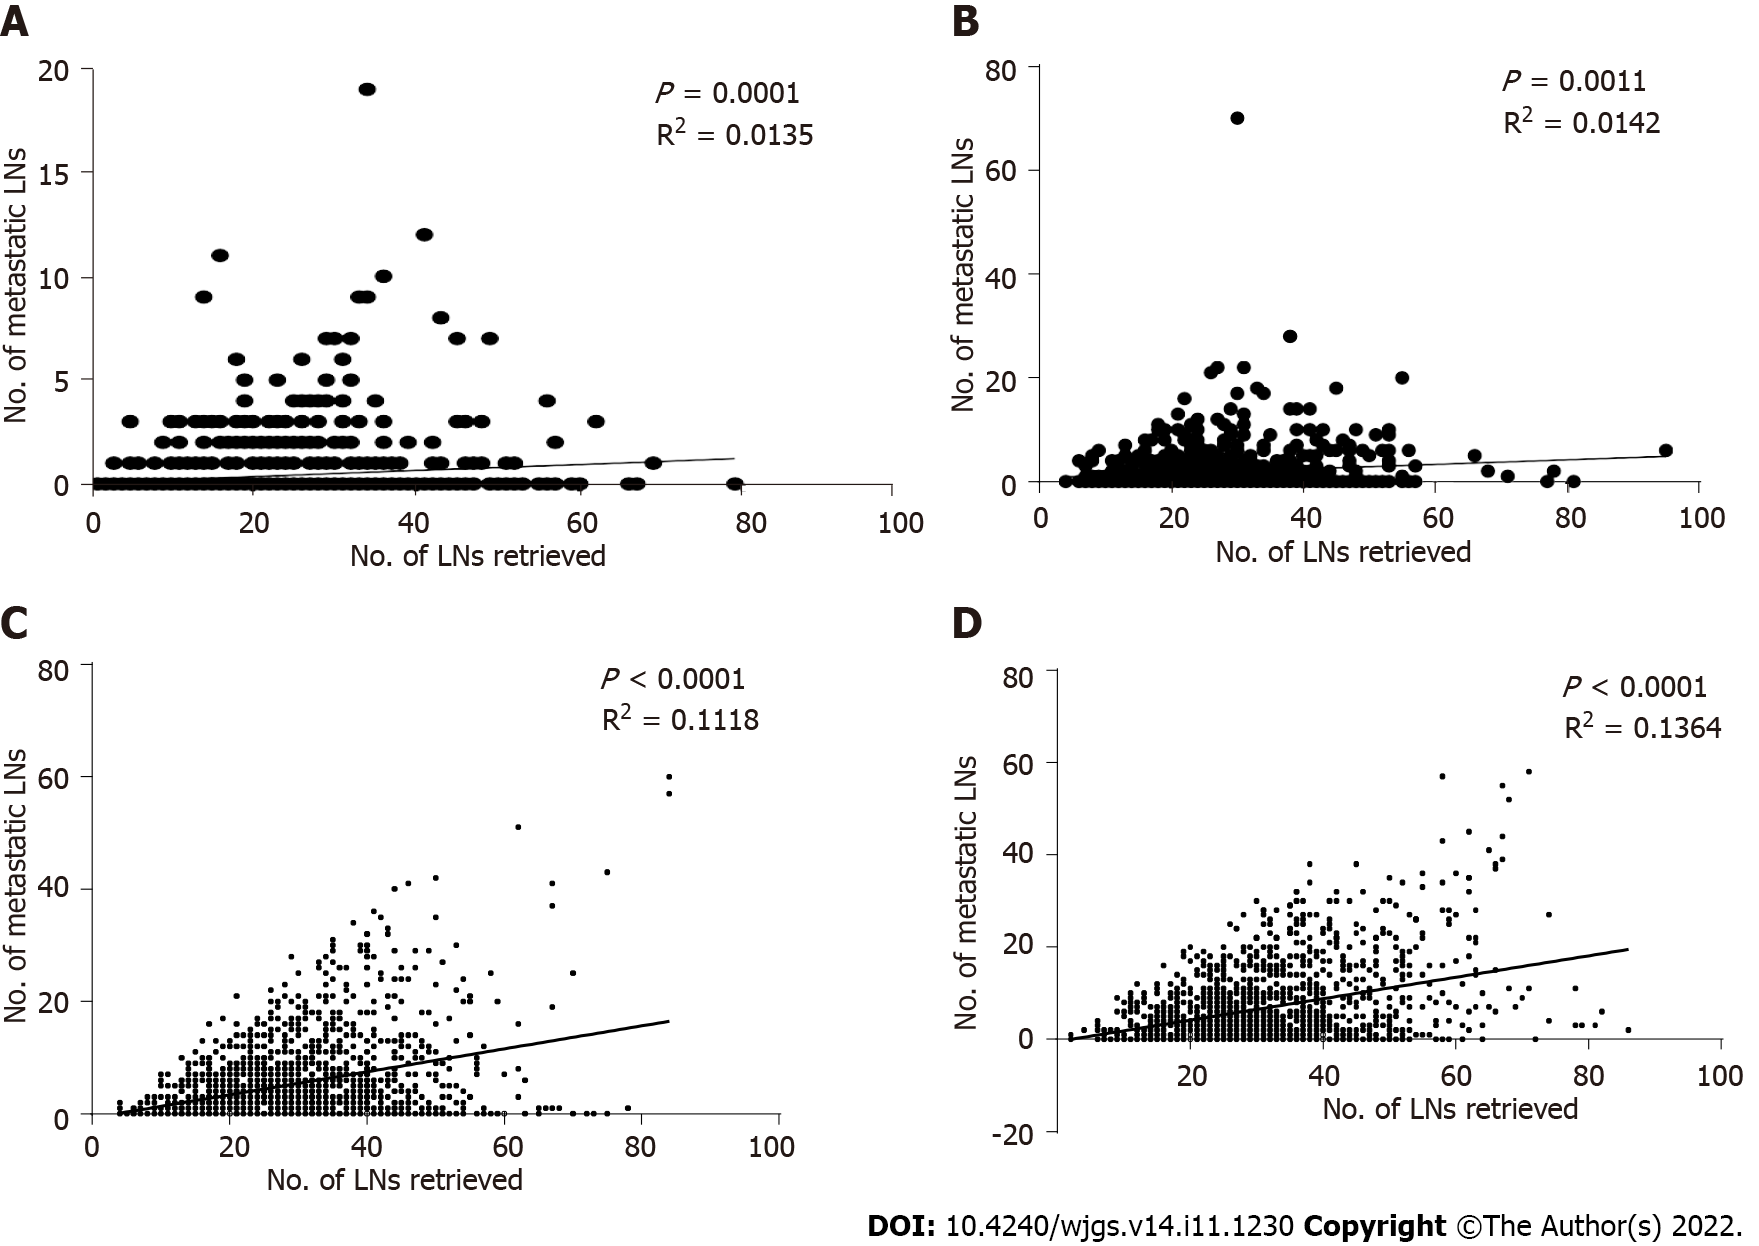
Figure 8 Scatter plot and linear regression analysis of the number of metastatic lymph nodes and the number of positive lymph nodes in the overall patient population.
A: pT1; B: pT2; C: pT3; D: pT4. LNs: Lymph nodes.
- Citation: Wang H, Yin X, Lou SH, Fang TY, Han BL, Gao JL, Wang YF, Zhang DX, Wang XB, Lu ZF, Wu JP, Zhang JQ, Wang YM, Zhang Y, Xue YW. Metastatic lymph nodes and prognosis assessed by the number of retrieved lymph nodes in gastric cancer. World J Gastrointest Surg 2022; 14(11): 1230-1249
- URL: https://www.wjgnet.com/1948-9366/full/v14/i11/1230.htm
- DOI: https://dx.doi.org/10.4240/wjgs.v14.i11.1230


