Copyright
©The Author(s) 2022.
World J Gastrointest Surg. Nov 27, 2022; 14(11): 1204-1218
Published online Nov 27, 2022. doi: 10.4240/wjgs.v14.i11.1204
Published online Nov 27, 2022. doi: 10.4240/wjgs.v14.i11.1204
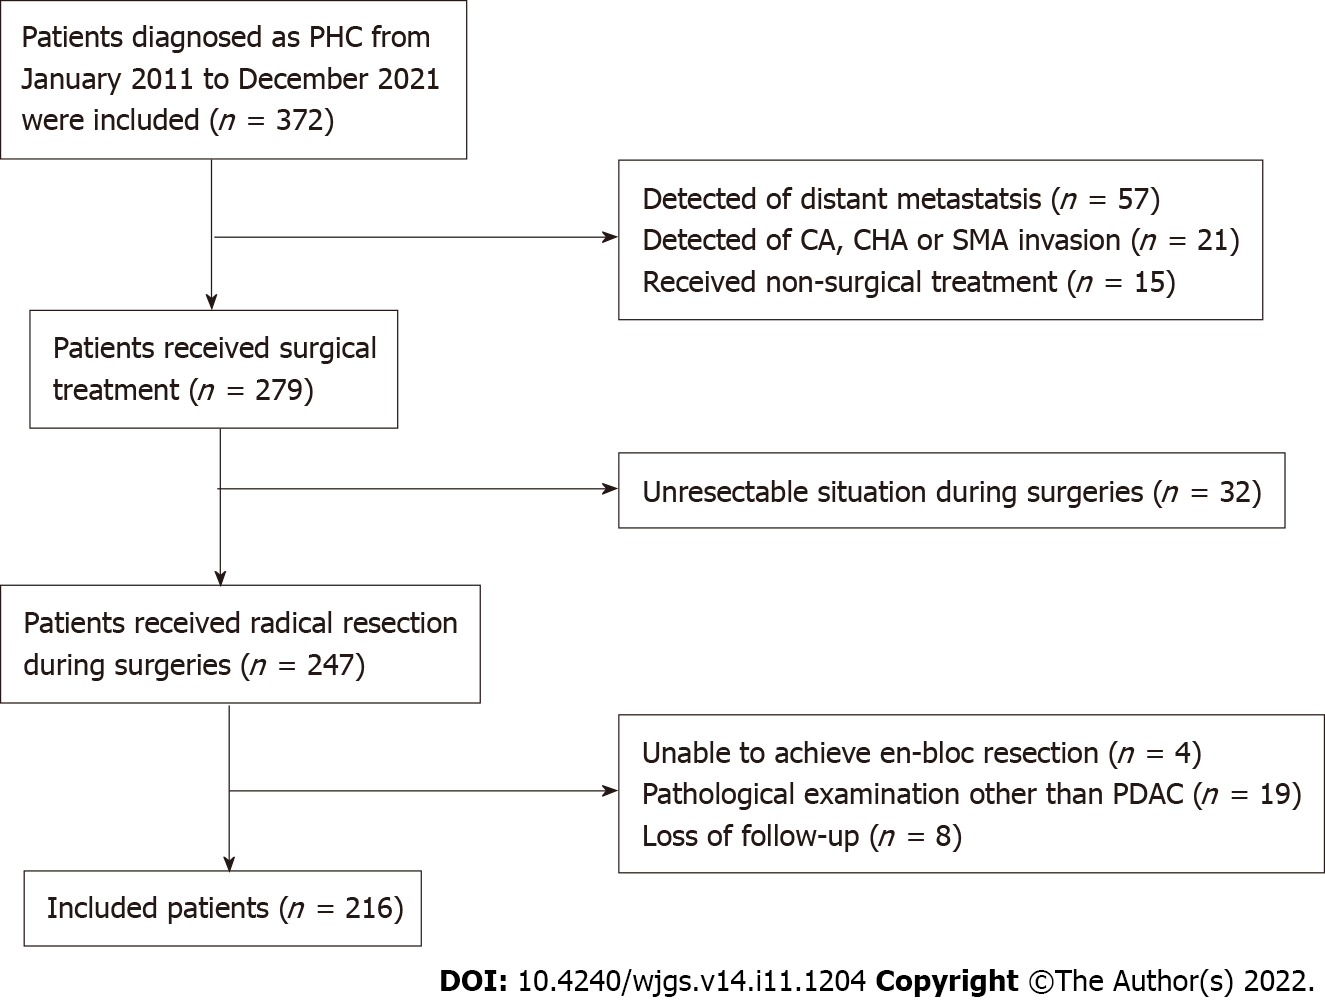
Figure 1 Flow of patient selection.
PHC: Pancreatic head carcinoma; CA: Celiac axis; CHA: Common hepatic artery; SMA: Superior mesenteric artery; PDAC: Pancreatic ductal adenocarcinoma.
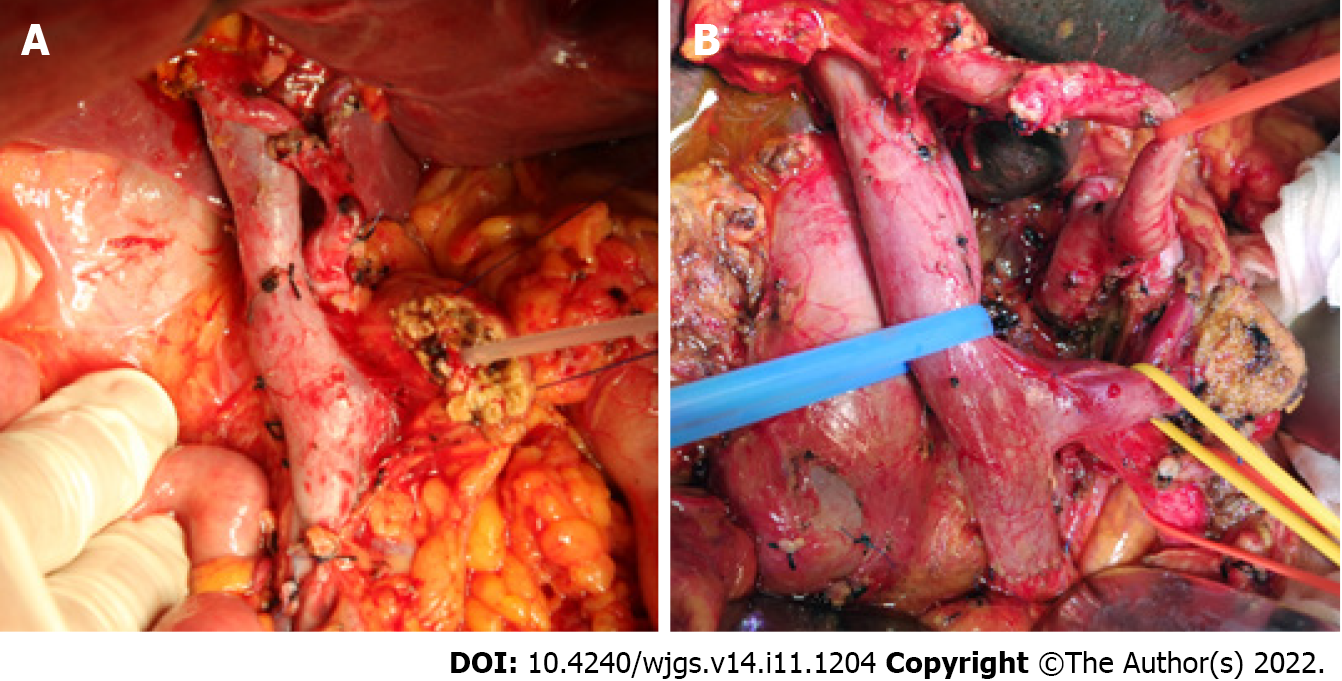
Figure 2 Extent of lymphadenectomy in different groups.
A: An intraoperative picture shows the extent of standard lymphadenectomy; B: An intraoperative picture shows the extent of extended lymphadenectomy.
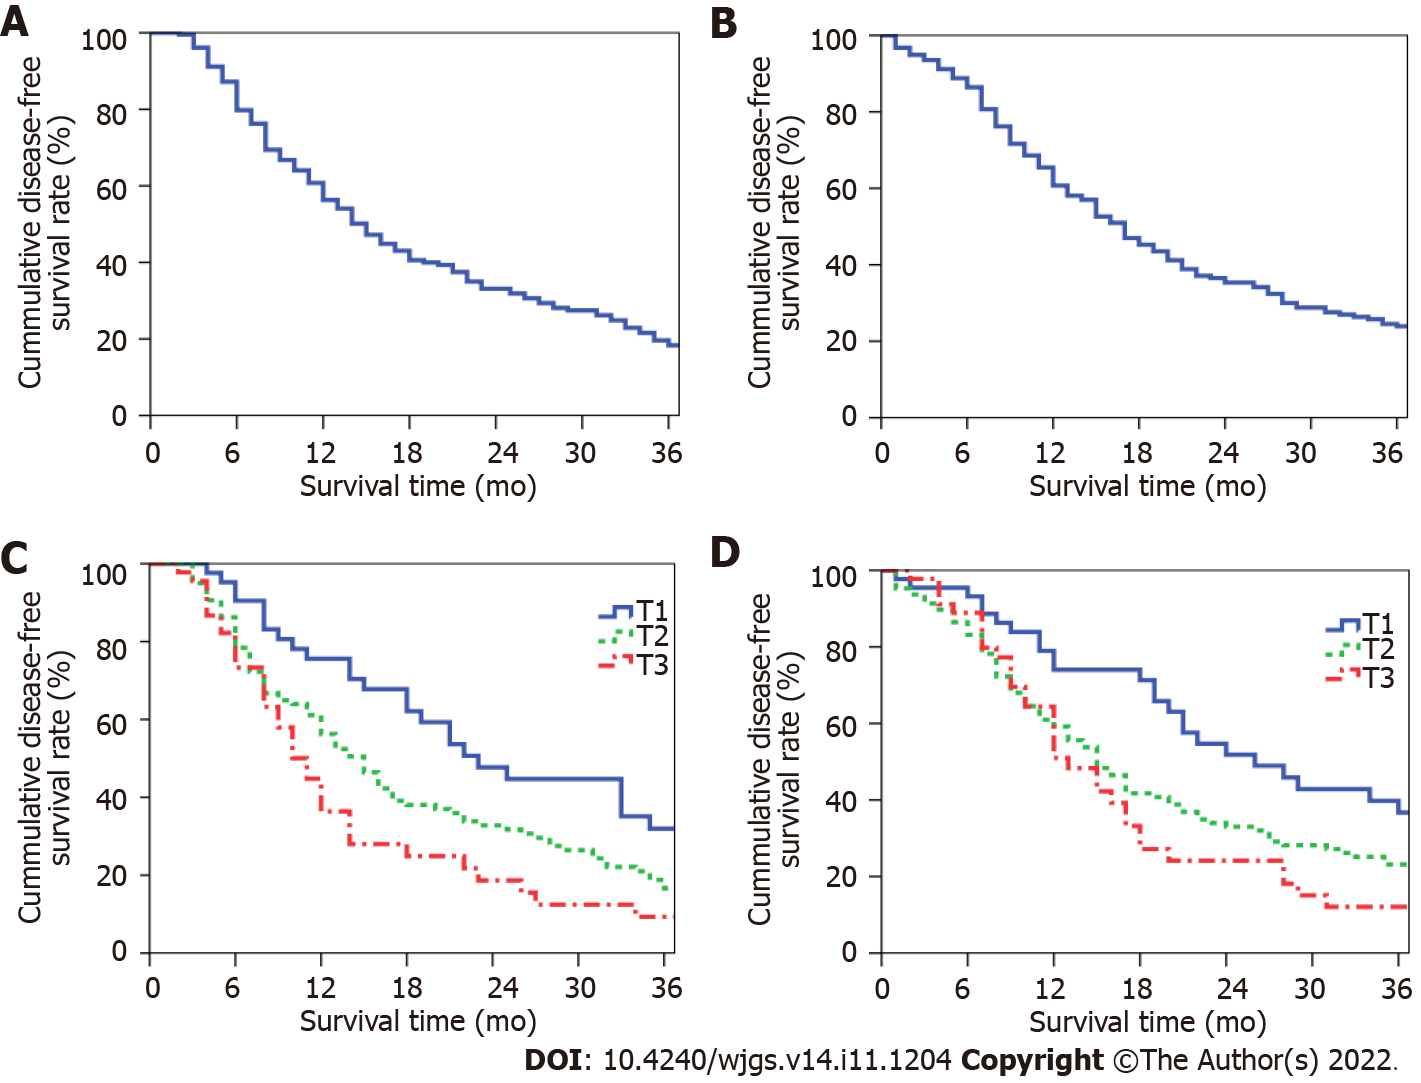
Figure 3 Long-term prognosis of patients.
A: The cumulative overall disease-free survival (DFS) curve of patients; B: The cumulative overall survival (OS) curve of patients; C: The cumulative DFS curves of patients at different T stages; D: The cumulative OS curves of patients at different T stages.
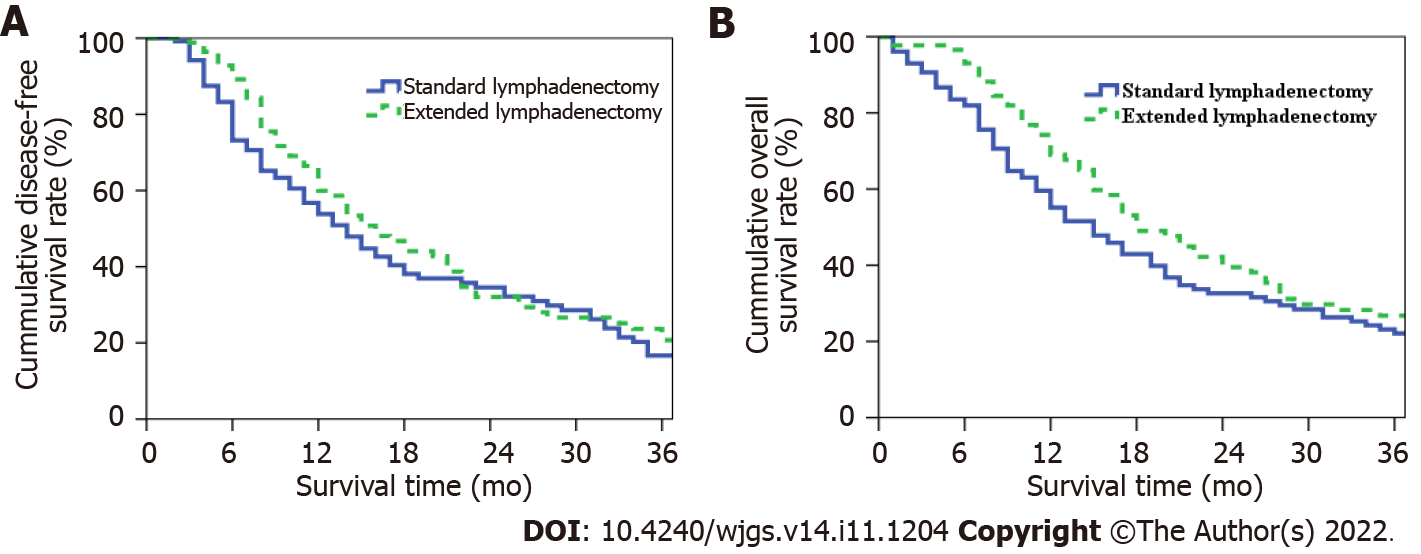
Figure 4 Long-term prognosis of patients in extended lymphadenectomy group and standard lymphadenectomy group.
A: The cumulative disease-free survival curve of patients in two groups; B: The cumulative overall survival curve of patients in two groups.
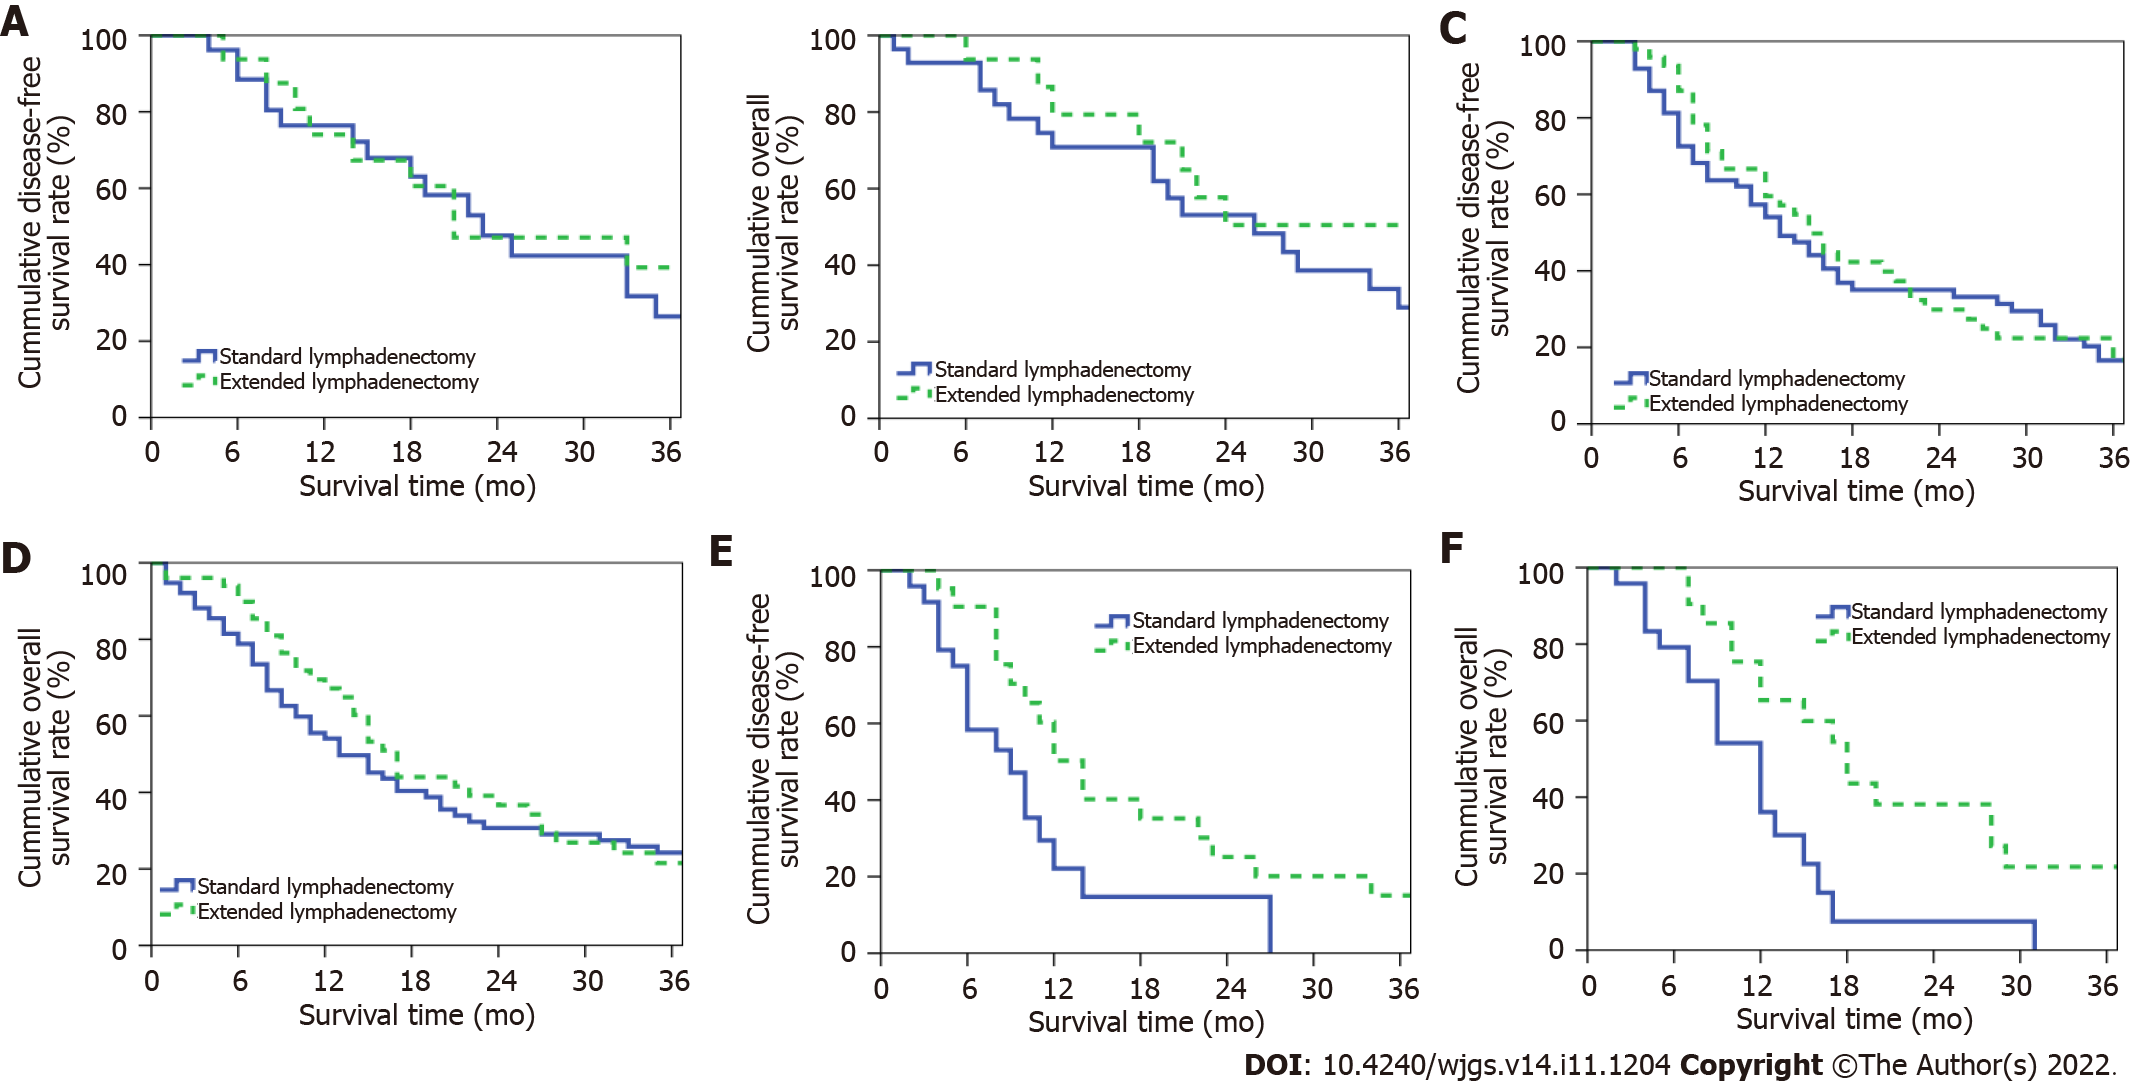
Figure 5 Long-term prognosis of patients at different T stages in extended lymphadenectomy group and standard lymphadenectomy group.
A: The cumulative disease-free survival (DFS) curve of patients at T1 stage in two groups; B: The cumulative overall survival (OS) curve of patients at T1 stage in two groups; C: The cumulative DFS curve of patients at T2 stage in two groups; D: The cumulative OS curve of patients at T2 stage in two groups; E: The cumulative DFS curve of patients at T3 stage in two groups; F: The cumulative OS curve of patients at T3 stage in two groups.
- Citation: Lyu SC, Wang HX, Liu ZP, Wang J, Huang JC, He Q, Lang R. Clinical value of extended lymphadenectomy in radical surgery for pancreatic head carcinoma at different T stages. World J Gastrointest Surg 2022; 14(11): 1204-1218
- URL: https://www.wjgnet.com/1948-9366/full/v14/i11/1204.htm
- DOI: https://dx.doi.org/10.4240/wjgs.v14.i11.1204


