Copyright
©The Author(s) 2021.
World J Gastrointest Surg. Sep 27, 2021; 13(9): 1079-1094
Published online Sep 27, 2021. doi: 10.4240/wjgs.v13.i9.1079
Published online Sep 27, 2021. doi: 10.4240/wjgs.v13.i9.1079
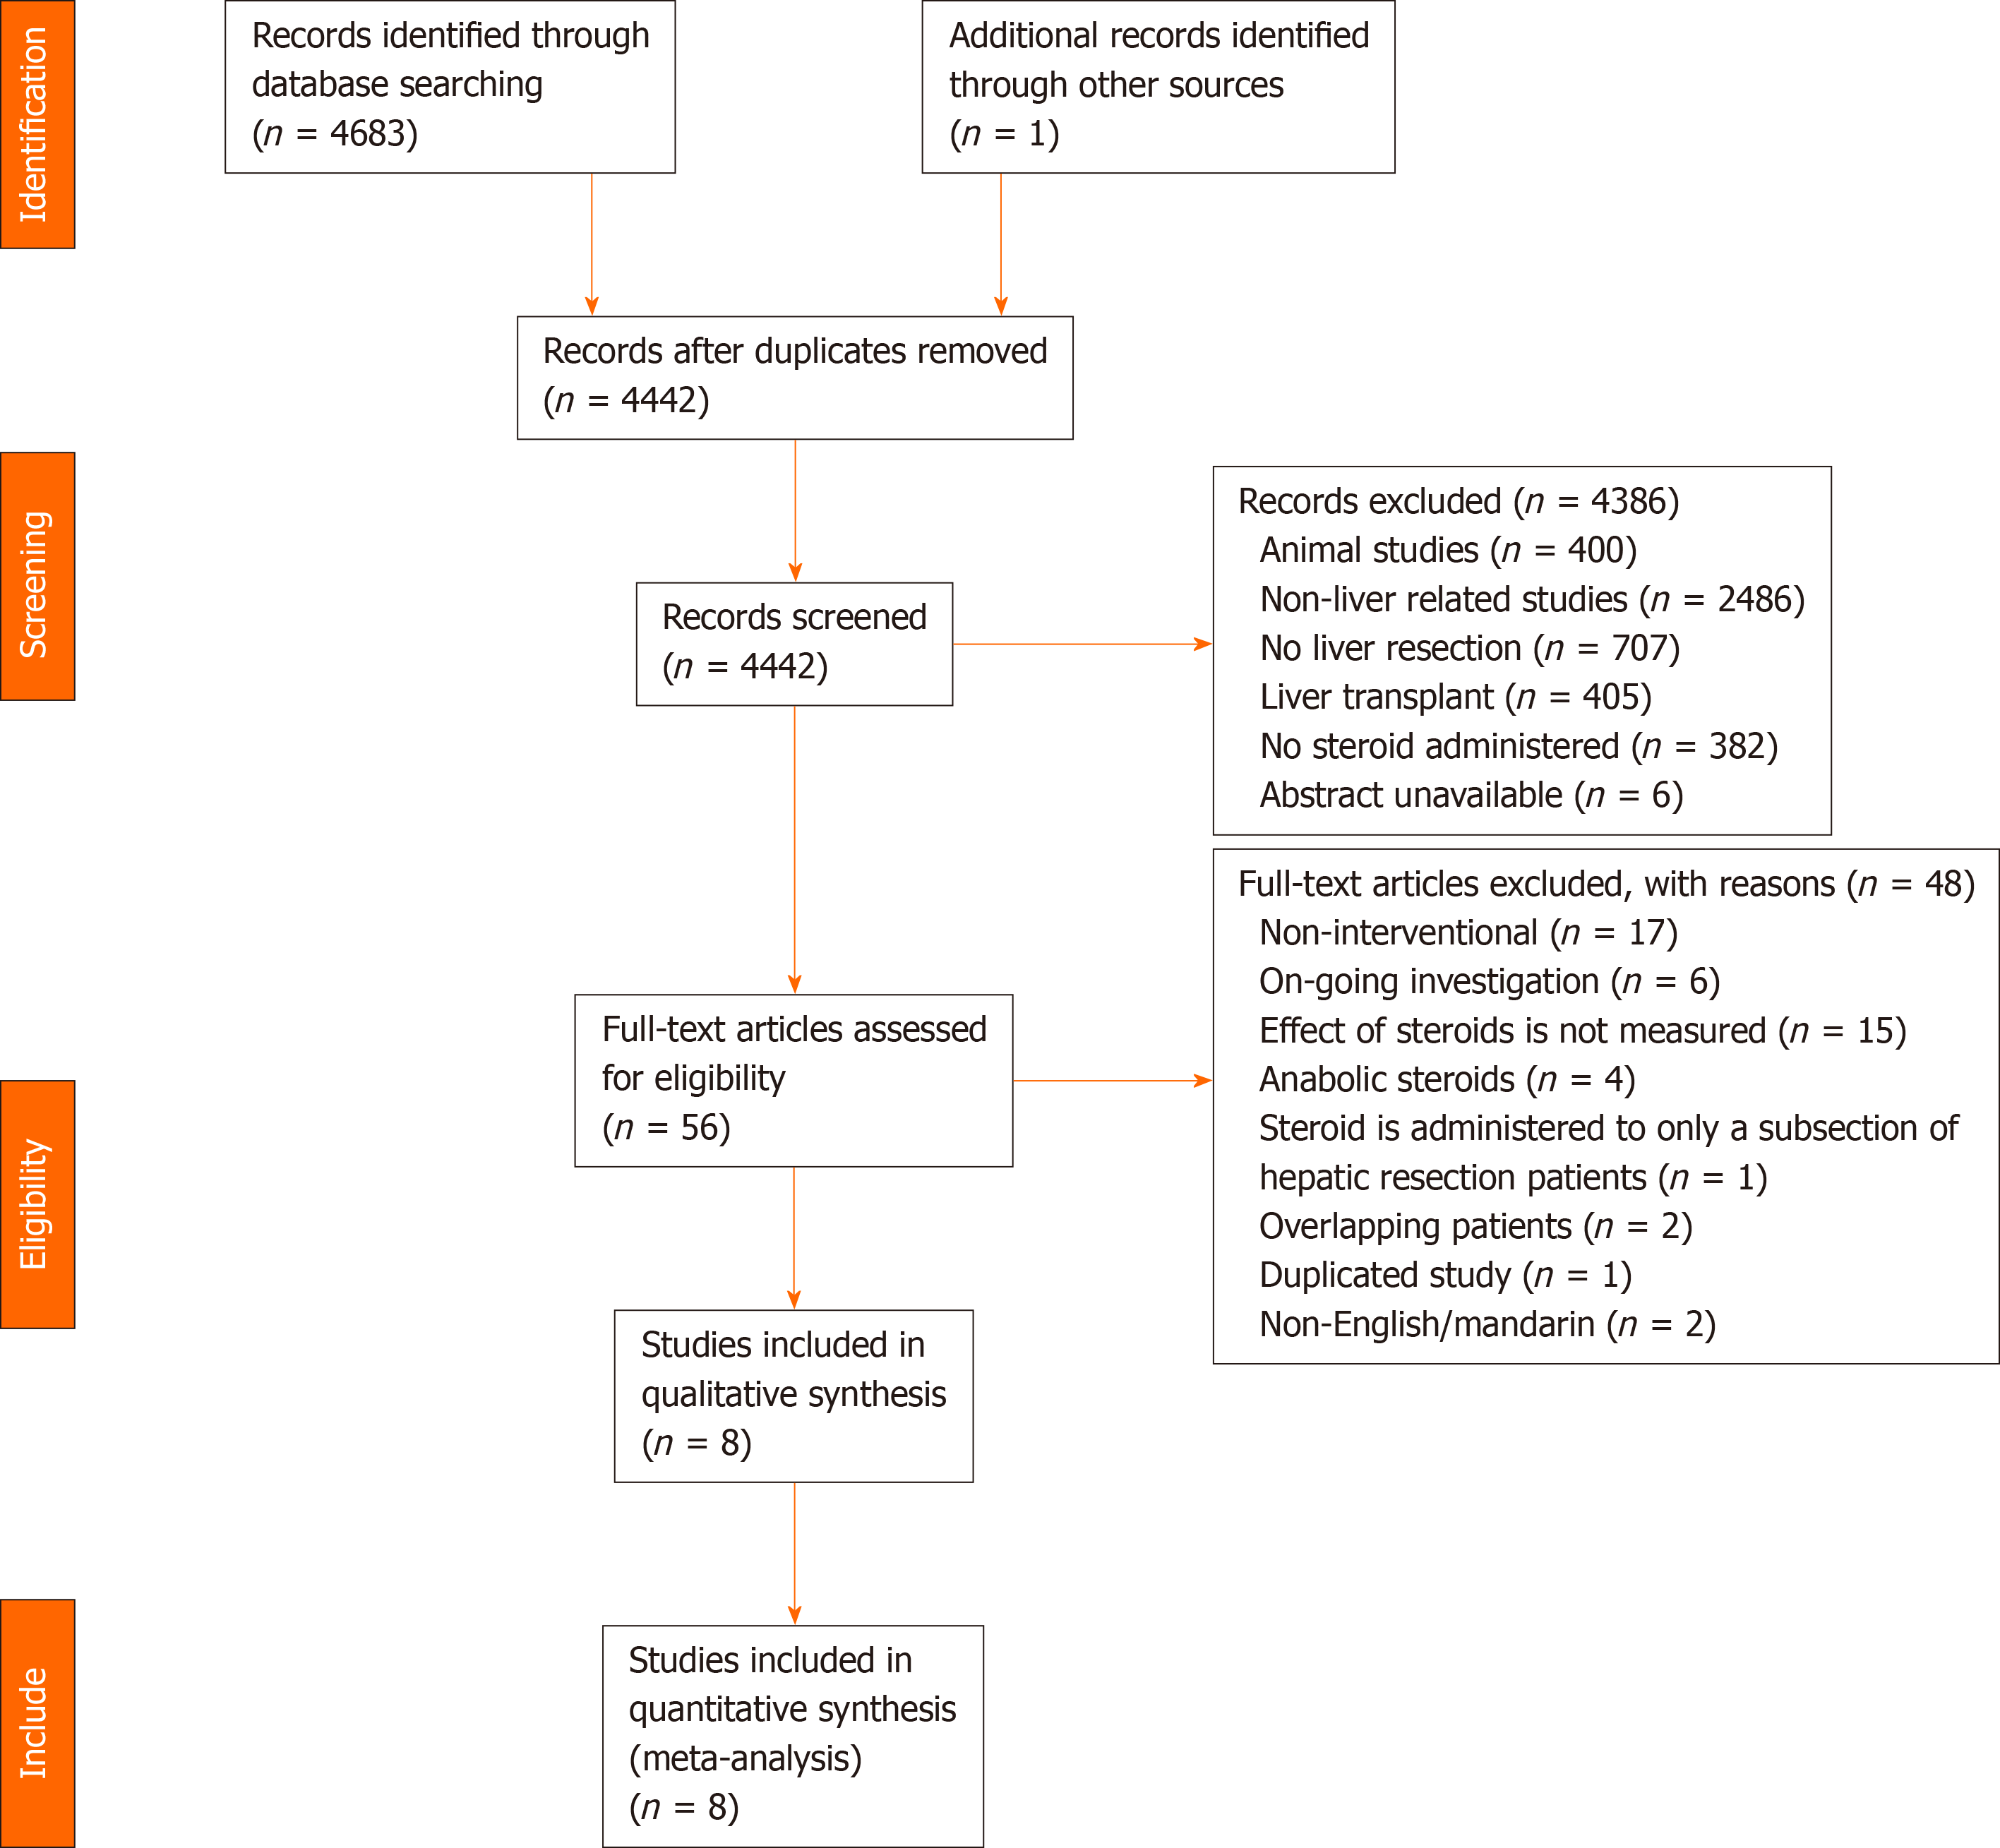
Figure 1 PRISMA flow diagram of preoperative administration of steroids in liver resection.
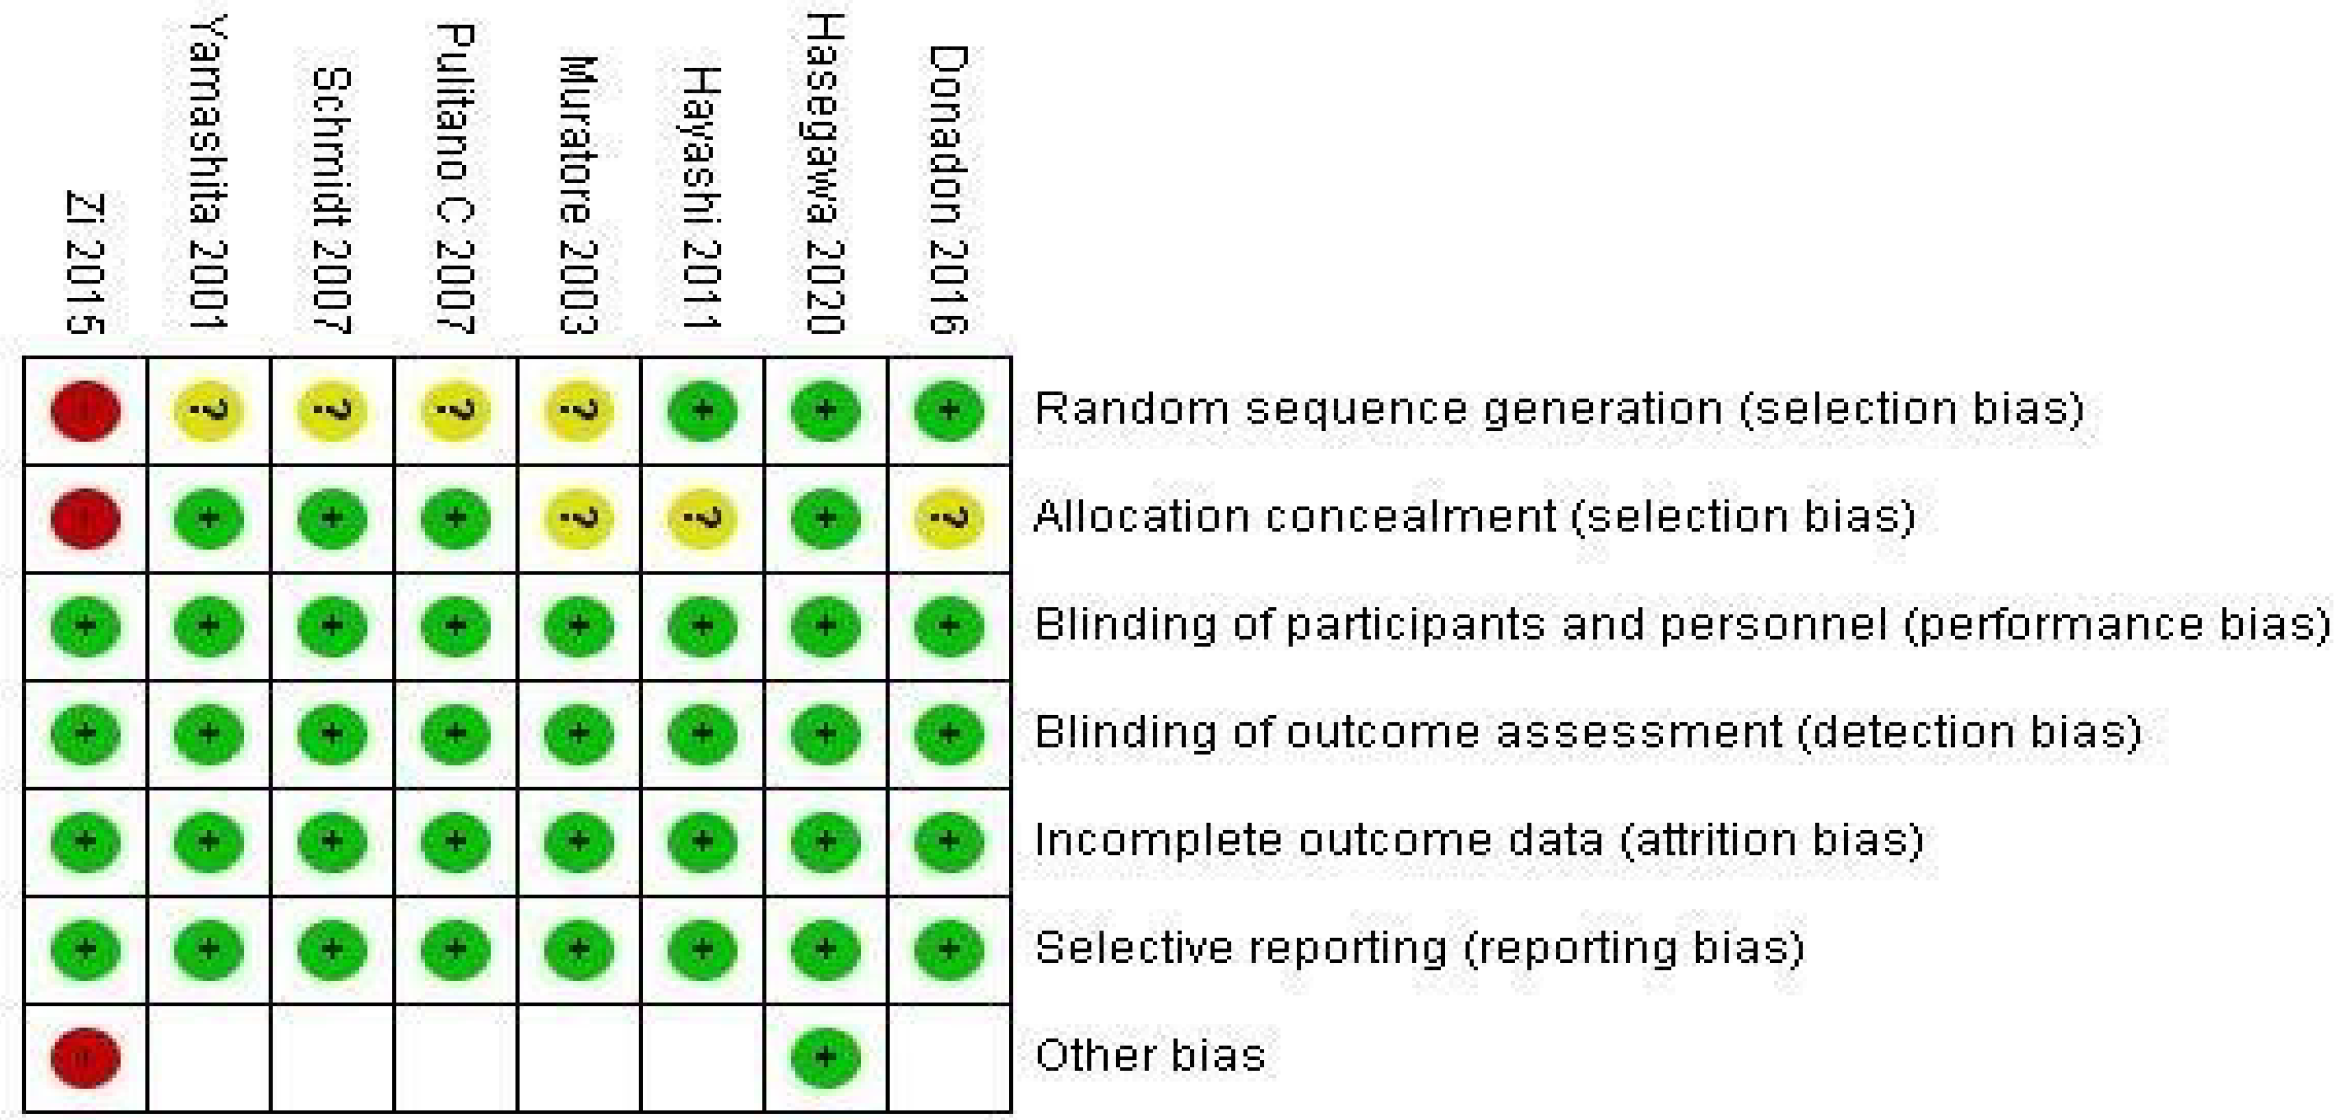
Figure 2 Risk of bias assessment using Cochrane collaboration’s risk of bias tool.
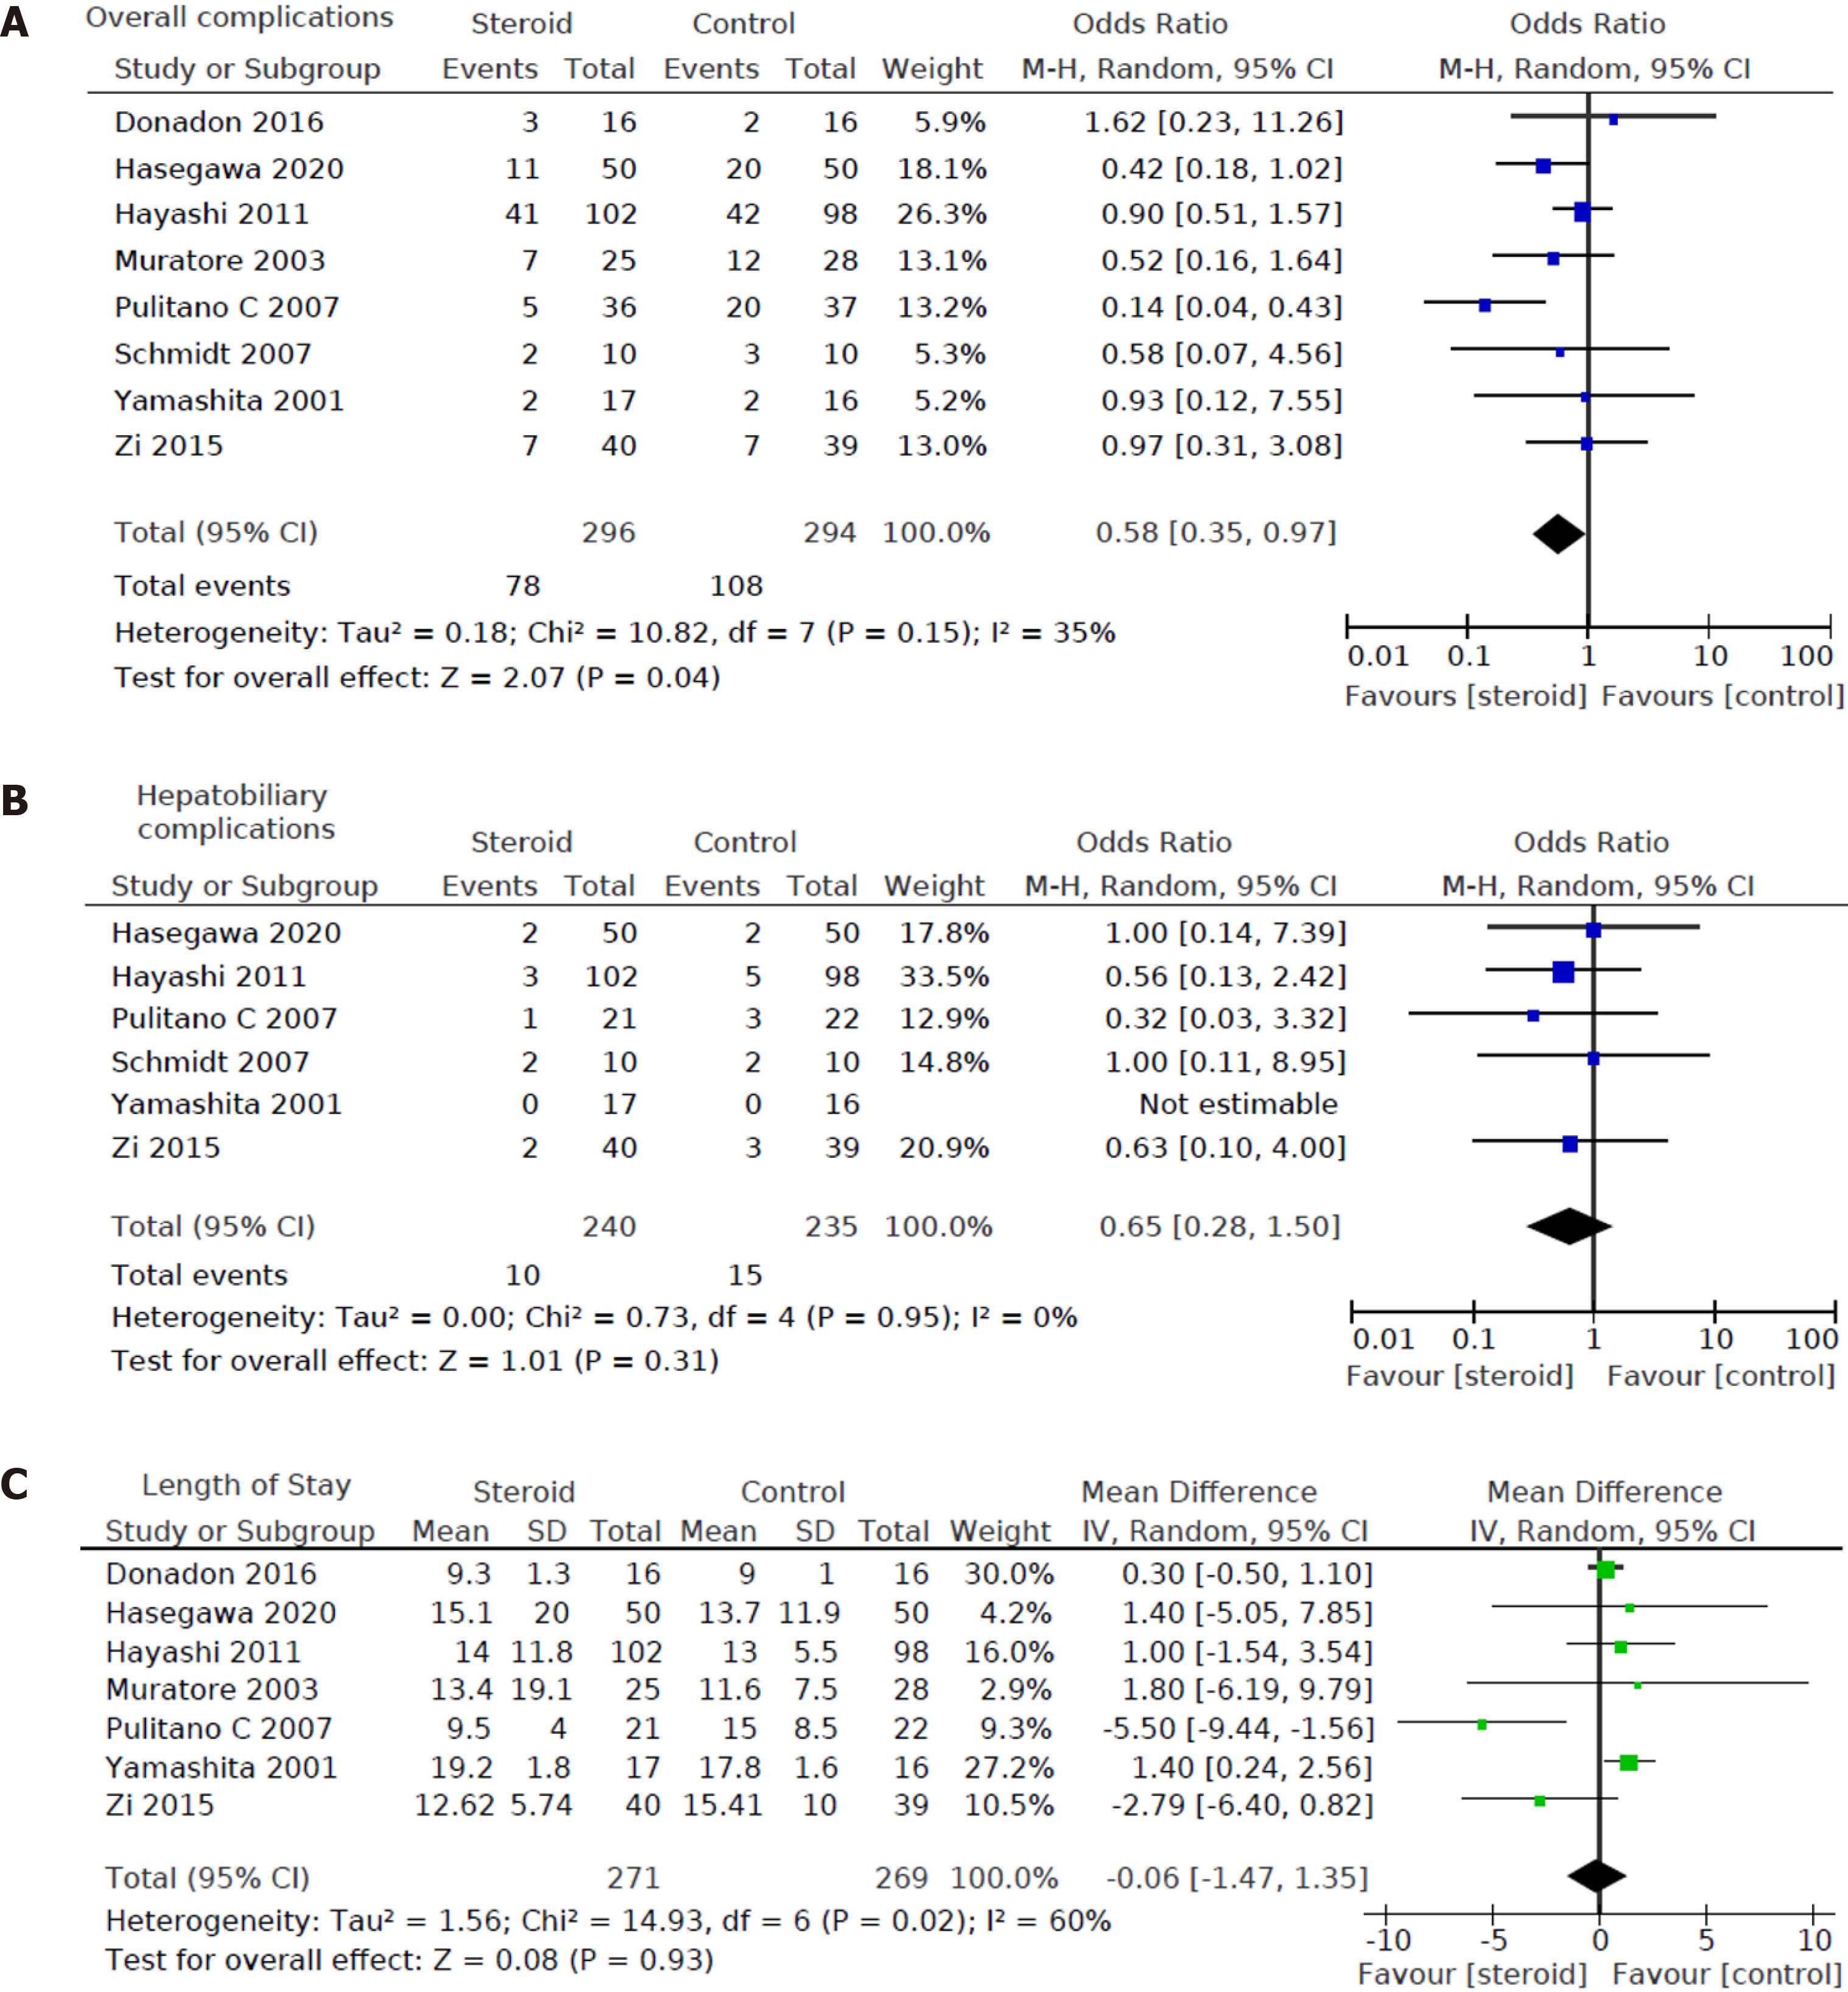
Figure 3 The pooled results comparing steroids group to the control group.
A: Overall complications; B: Hepatobiliary complications; C: Length of stay, illustrated by forest plots. Random effects model was used. M-H: Mantel-Haenszel; IV: Inverse variance; CI: Confidence interval.
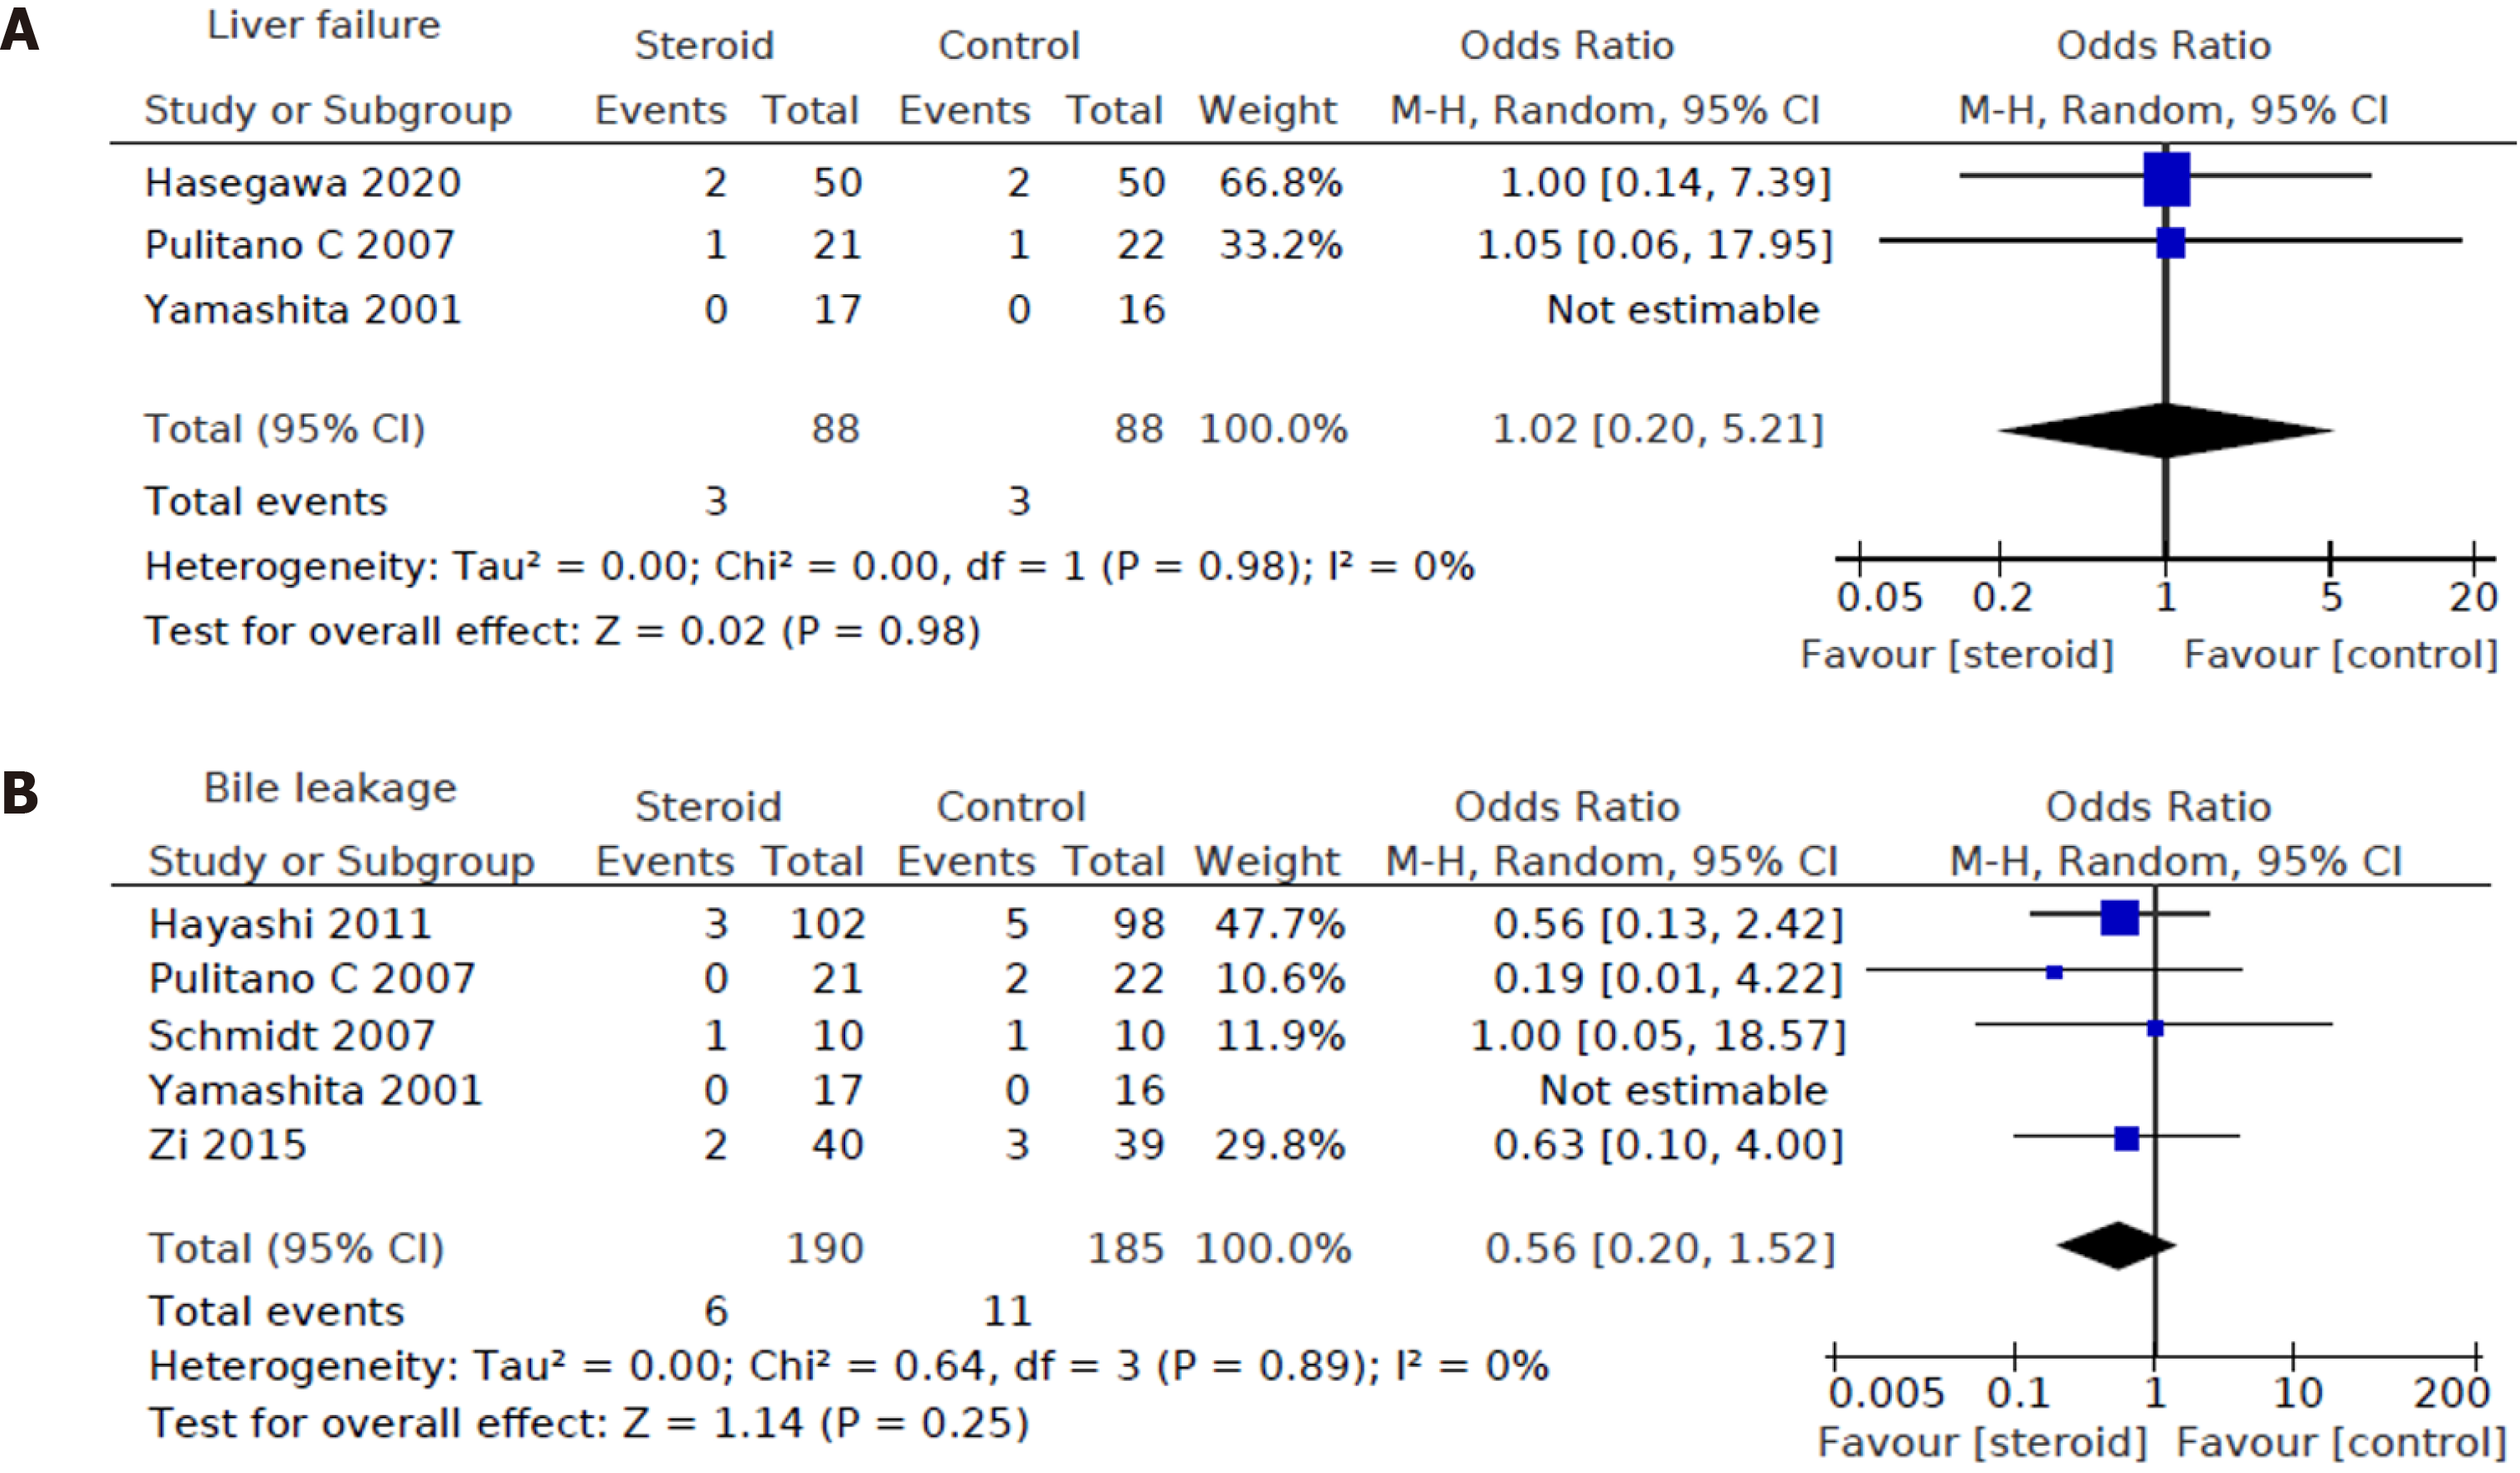
Figure 4 Pooled results comparing steroids group to the control group.
A: Liver failure; B: Bile leakage, illustrated by forest plots. Random effects model was used. M-H: Mantel-Haenszel; CI: Confidence interval.
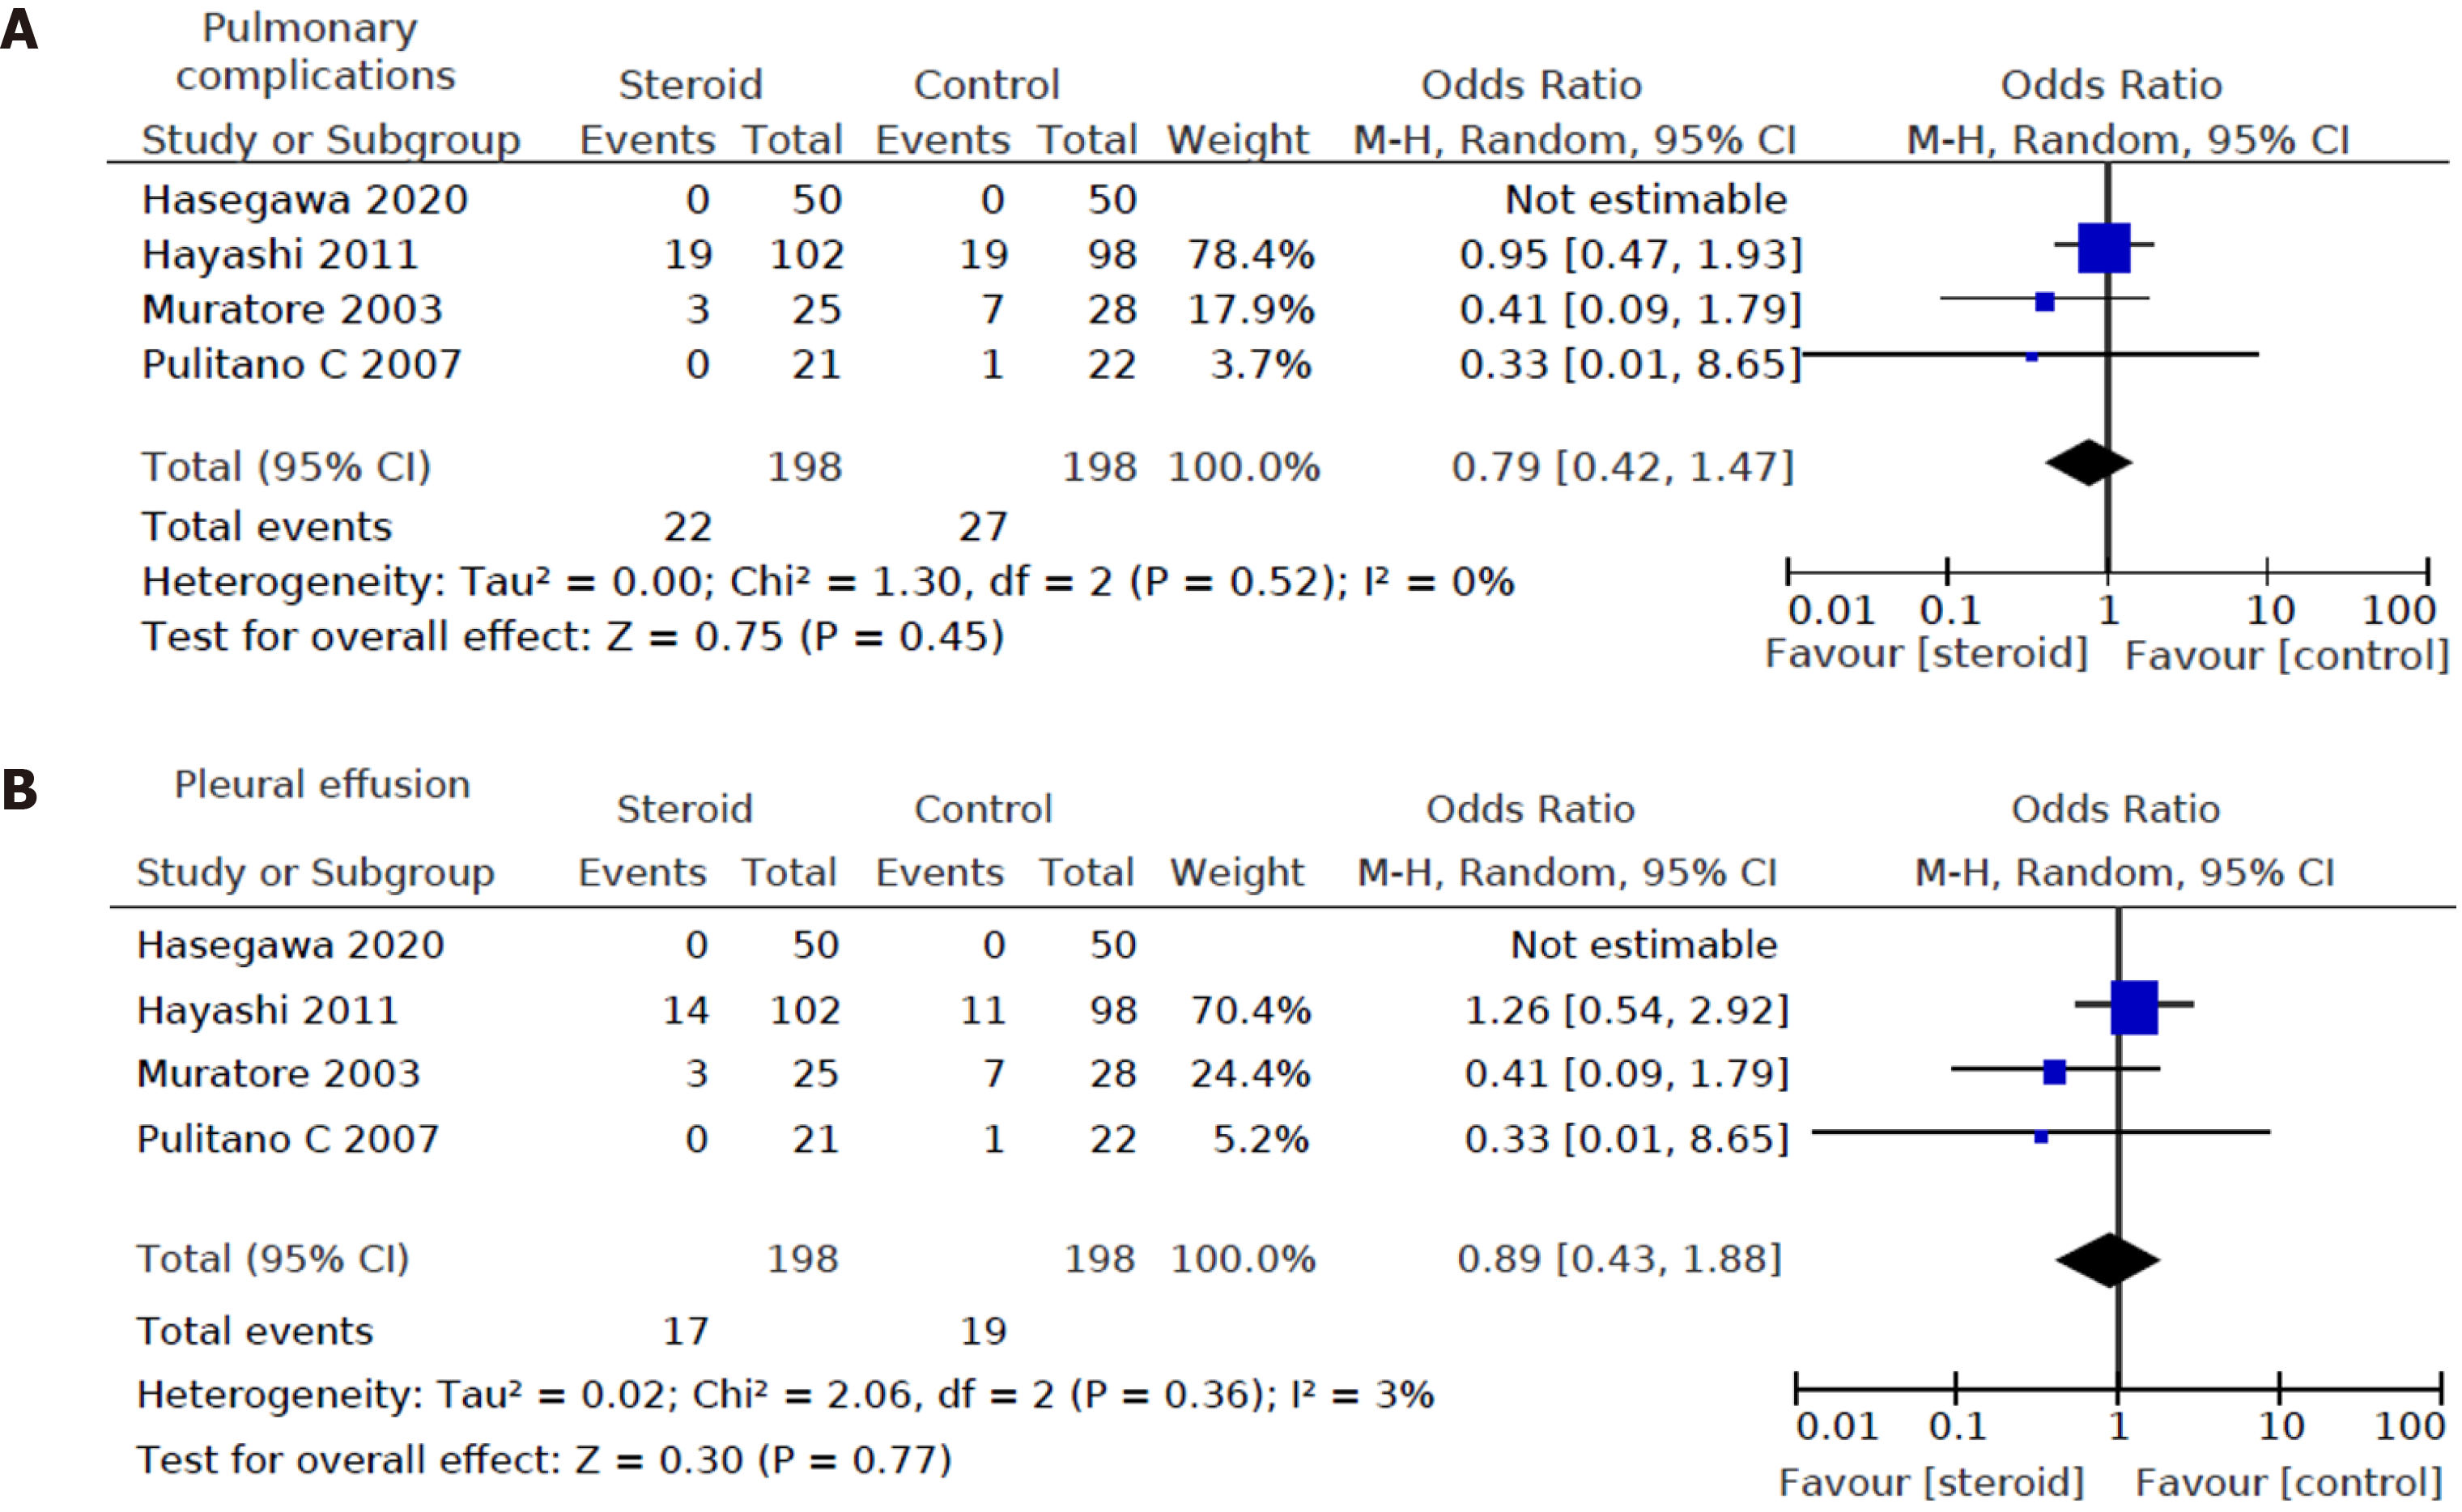
Figure 5 Pooled results comparing steroids group to the control group.
A: Pulmonary complications; B: Pleural effusion, illustrated by forest plots. Random effects model was used. M-H: Mantel-Haenszel; CI: Confidence interval.
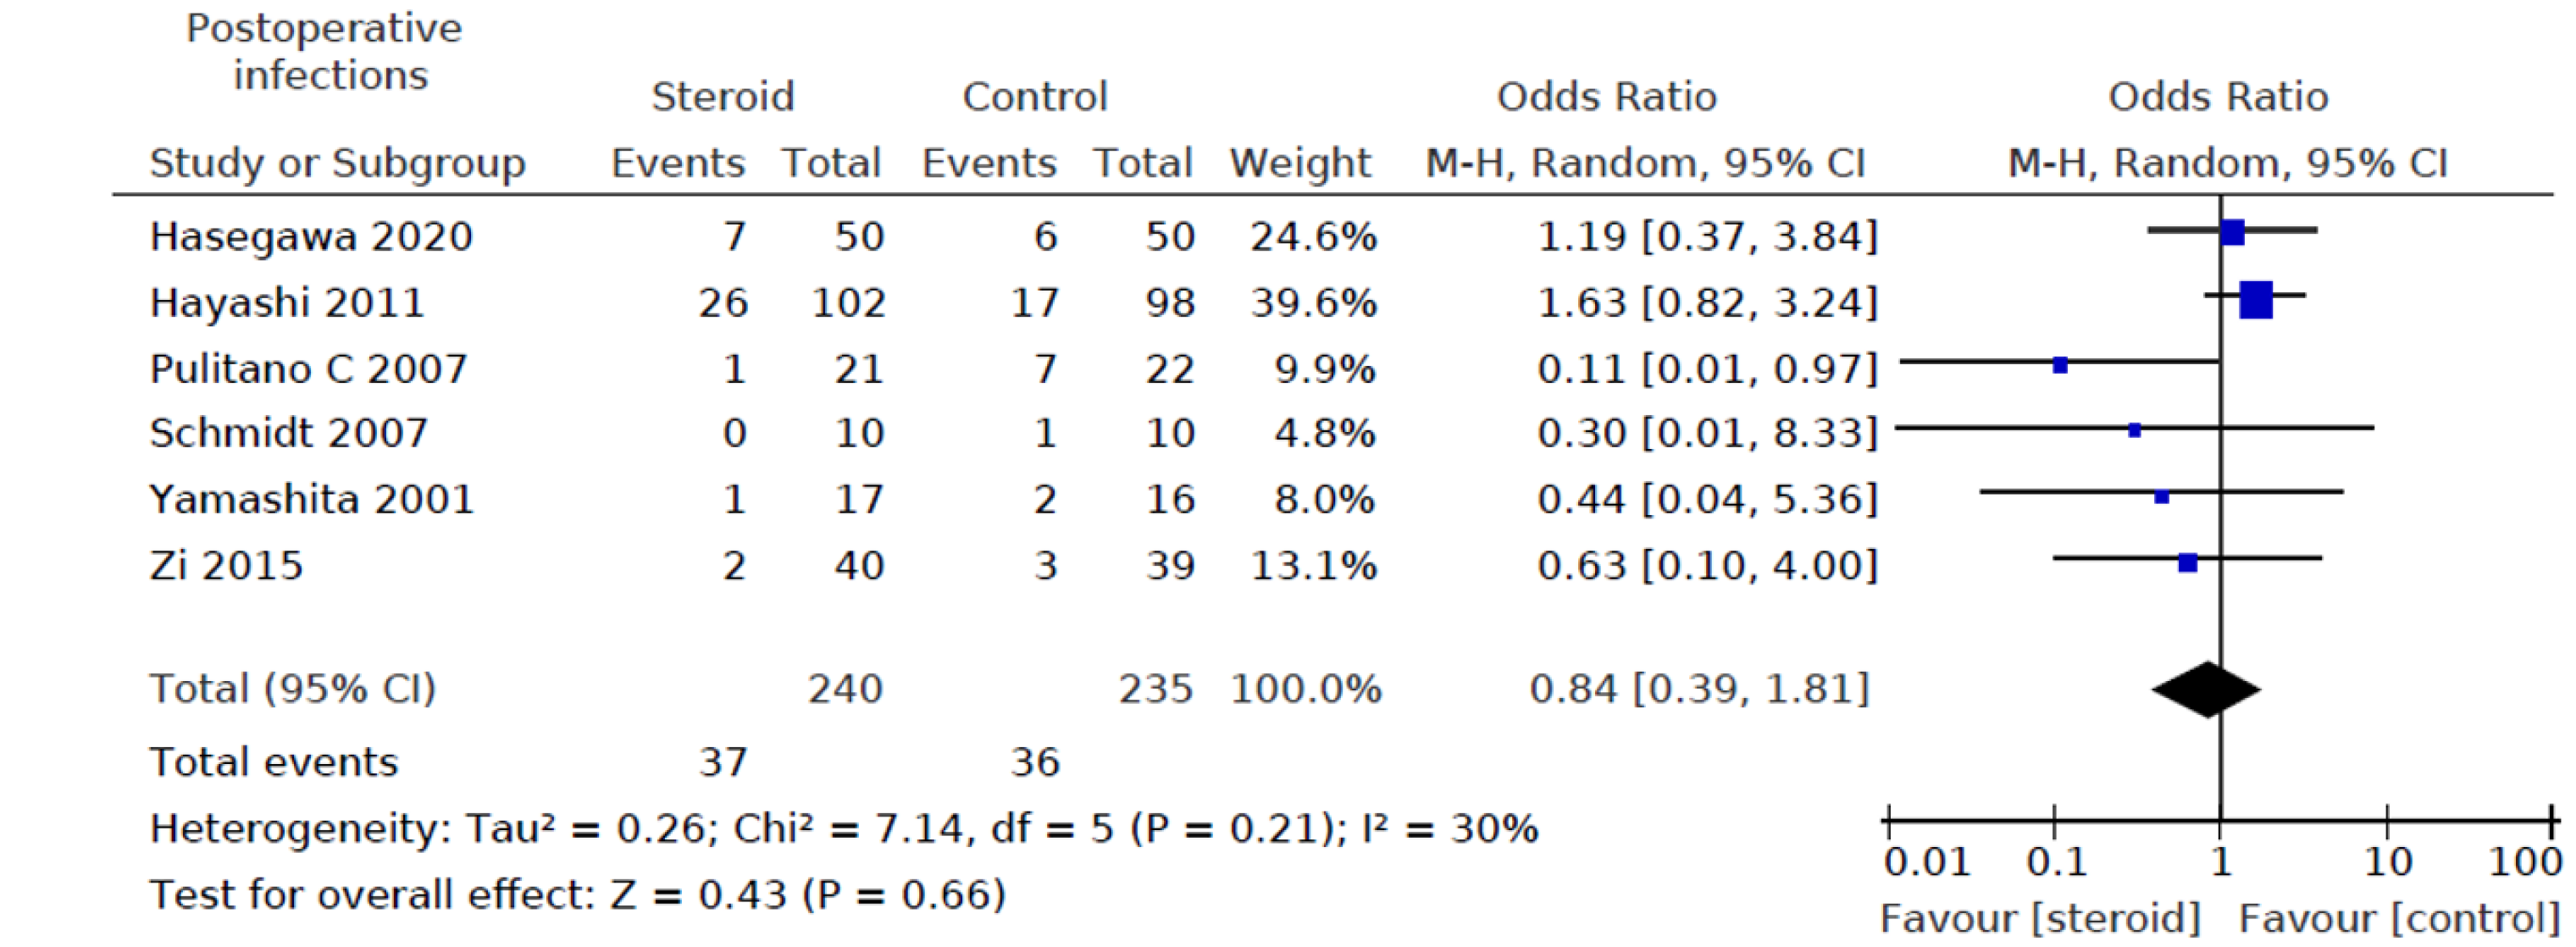
Figure 6 Pooled results comparing steroids group to the control group.
Postoperative infection rate illustrated by forest plots. The pooled results comparing steroids group to the control group regarding Postoperative infection rate illustrated by forest plots. Random effects model was used. M-H: Mantel-Haenszel; CI: Confidence interval.
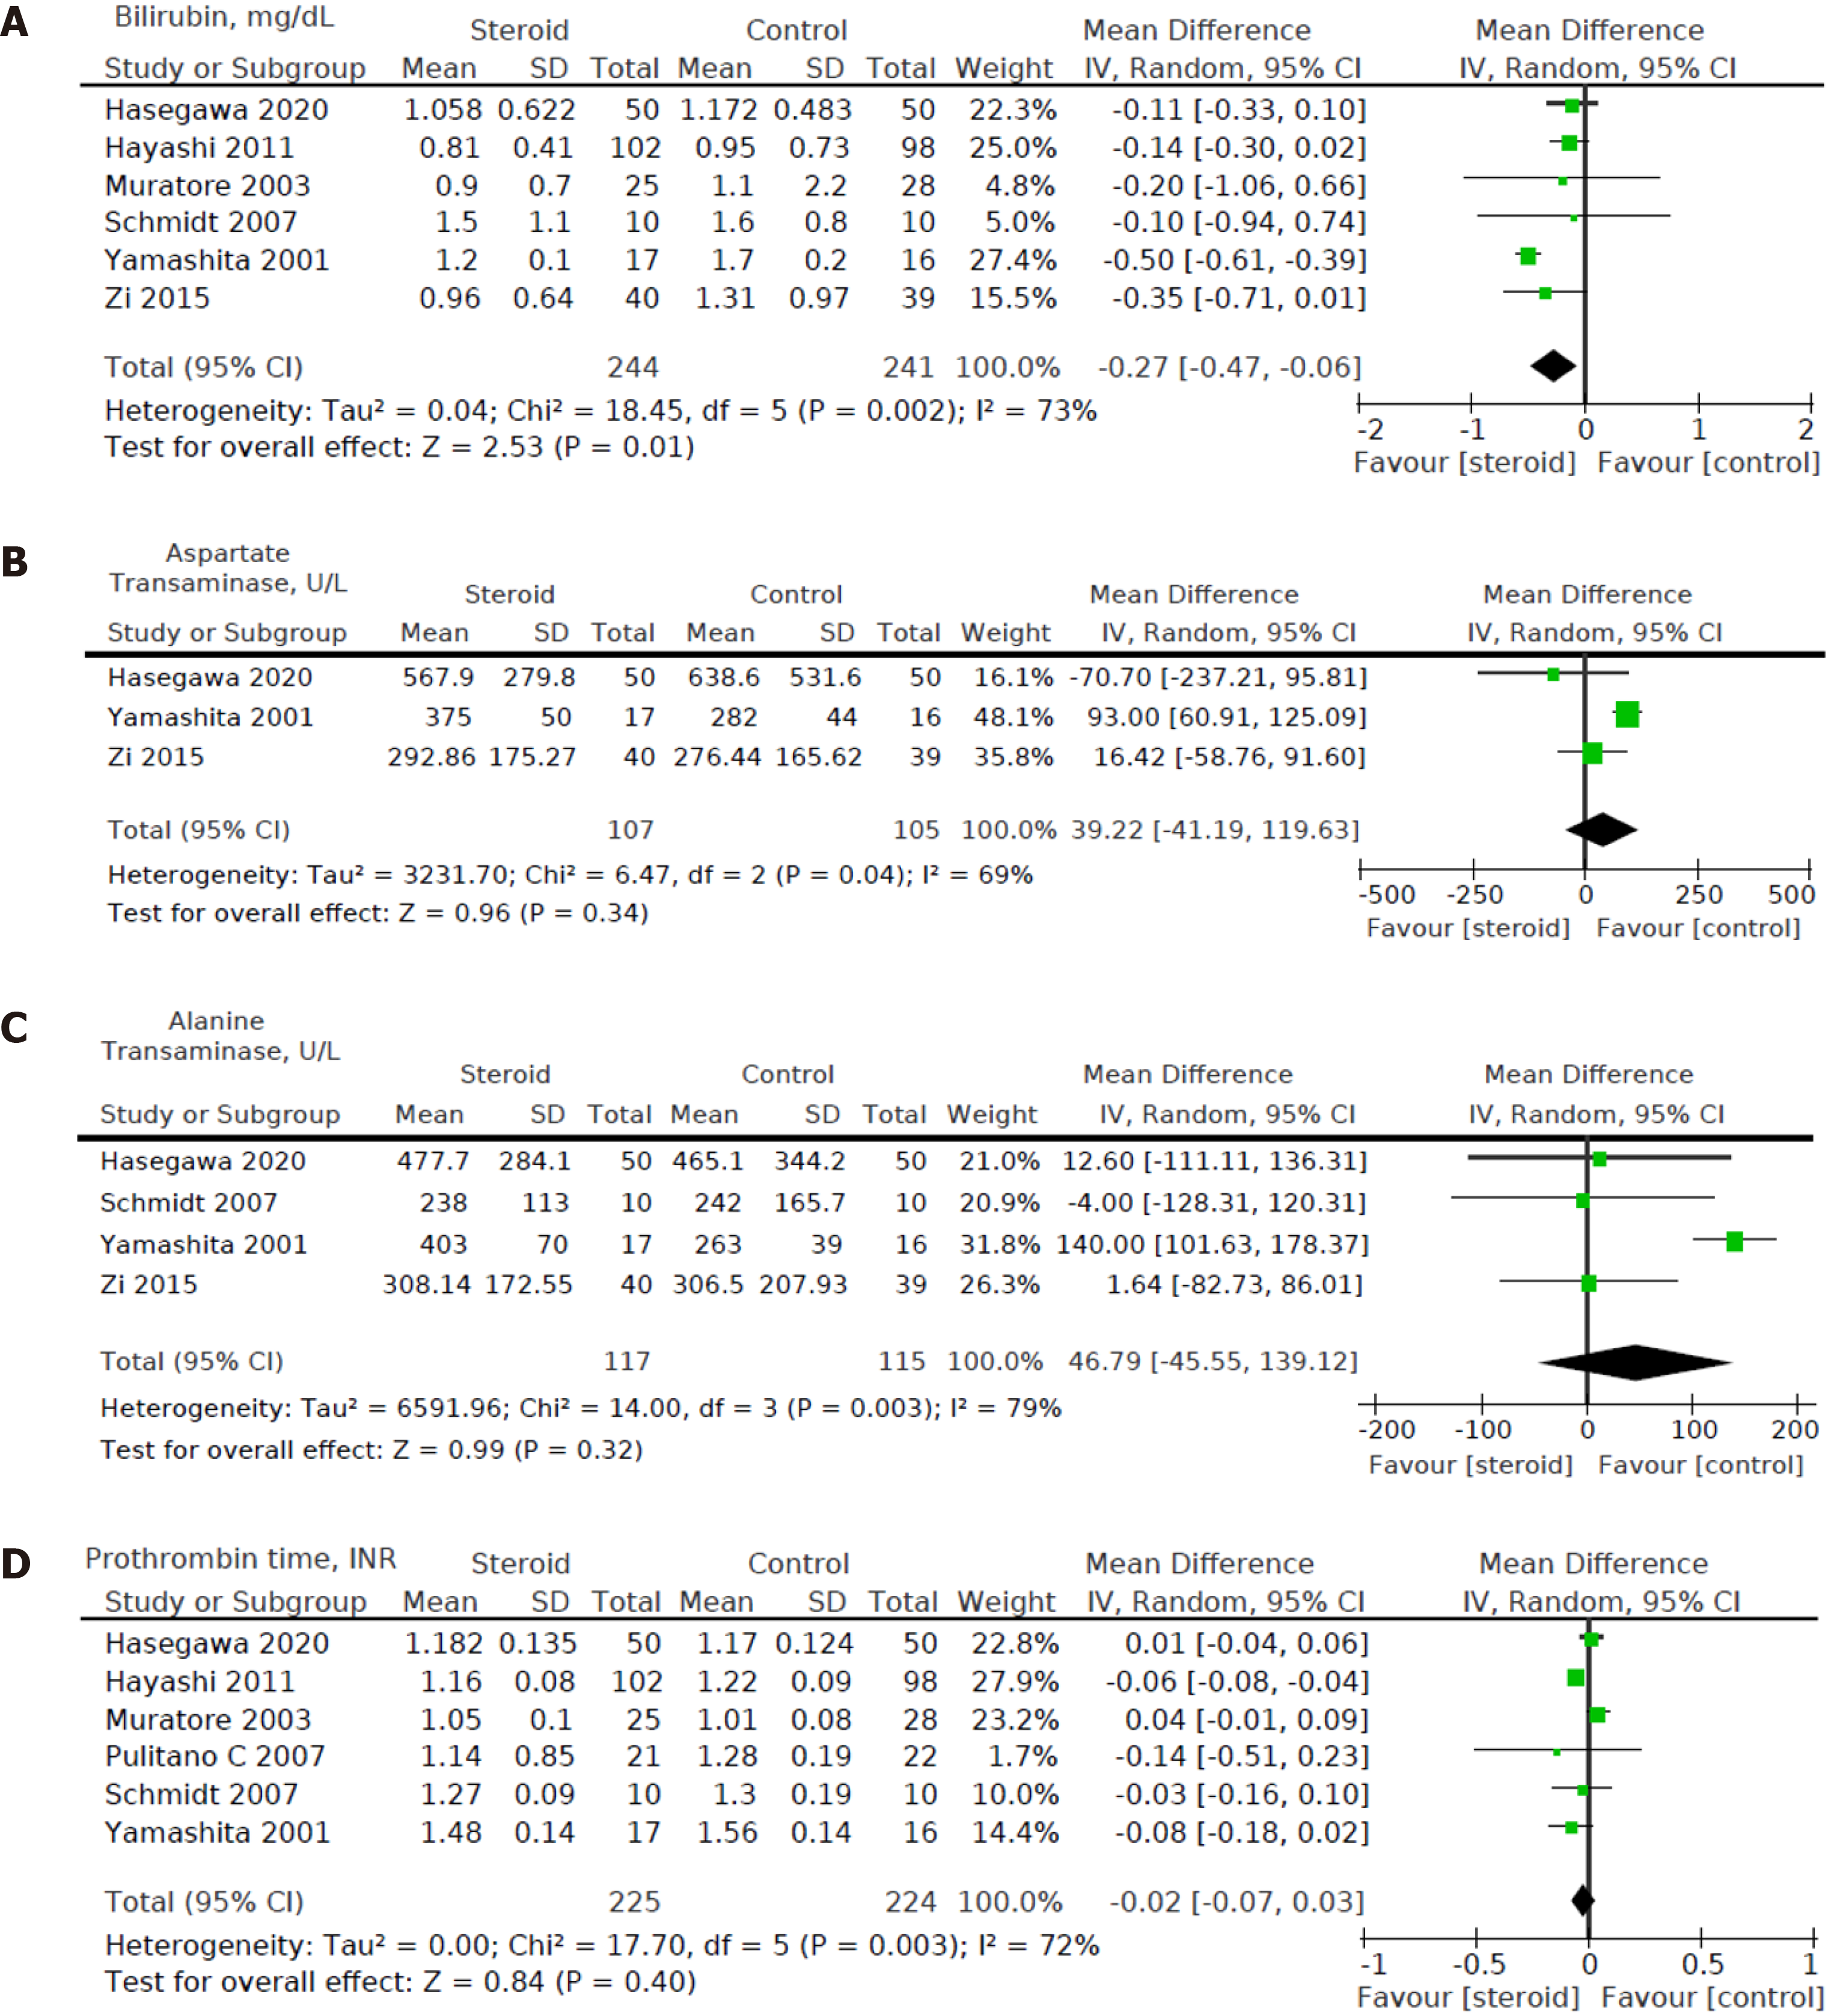
Figure 7 Pooled results comparing steroids group to the control group.
A: Postoperative day 1 bilirubin level, mg/dL; B: Postoperative day 1 aspartate transaminase level, U/L; C: Postoperative day 1 alanine transaminase level, U/L; D: Postoperative day 1 prothrombin time, international normalized ratio, illustrated by forest plots. Random effects model was used. IV: Inverse variance; CI: Confidence interval.
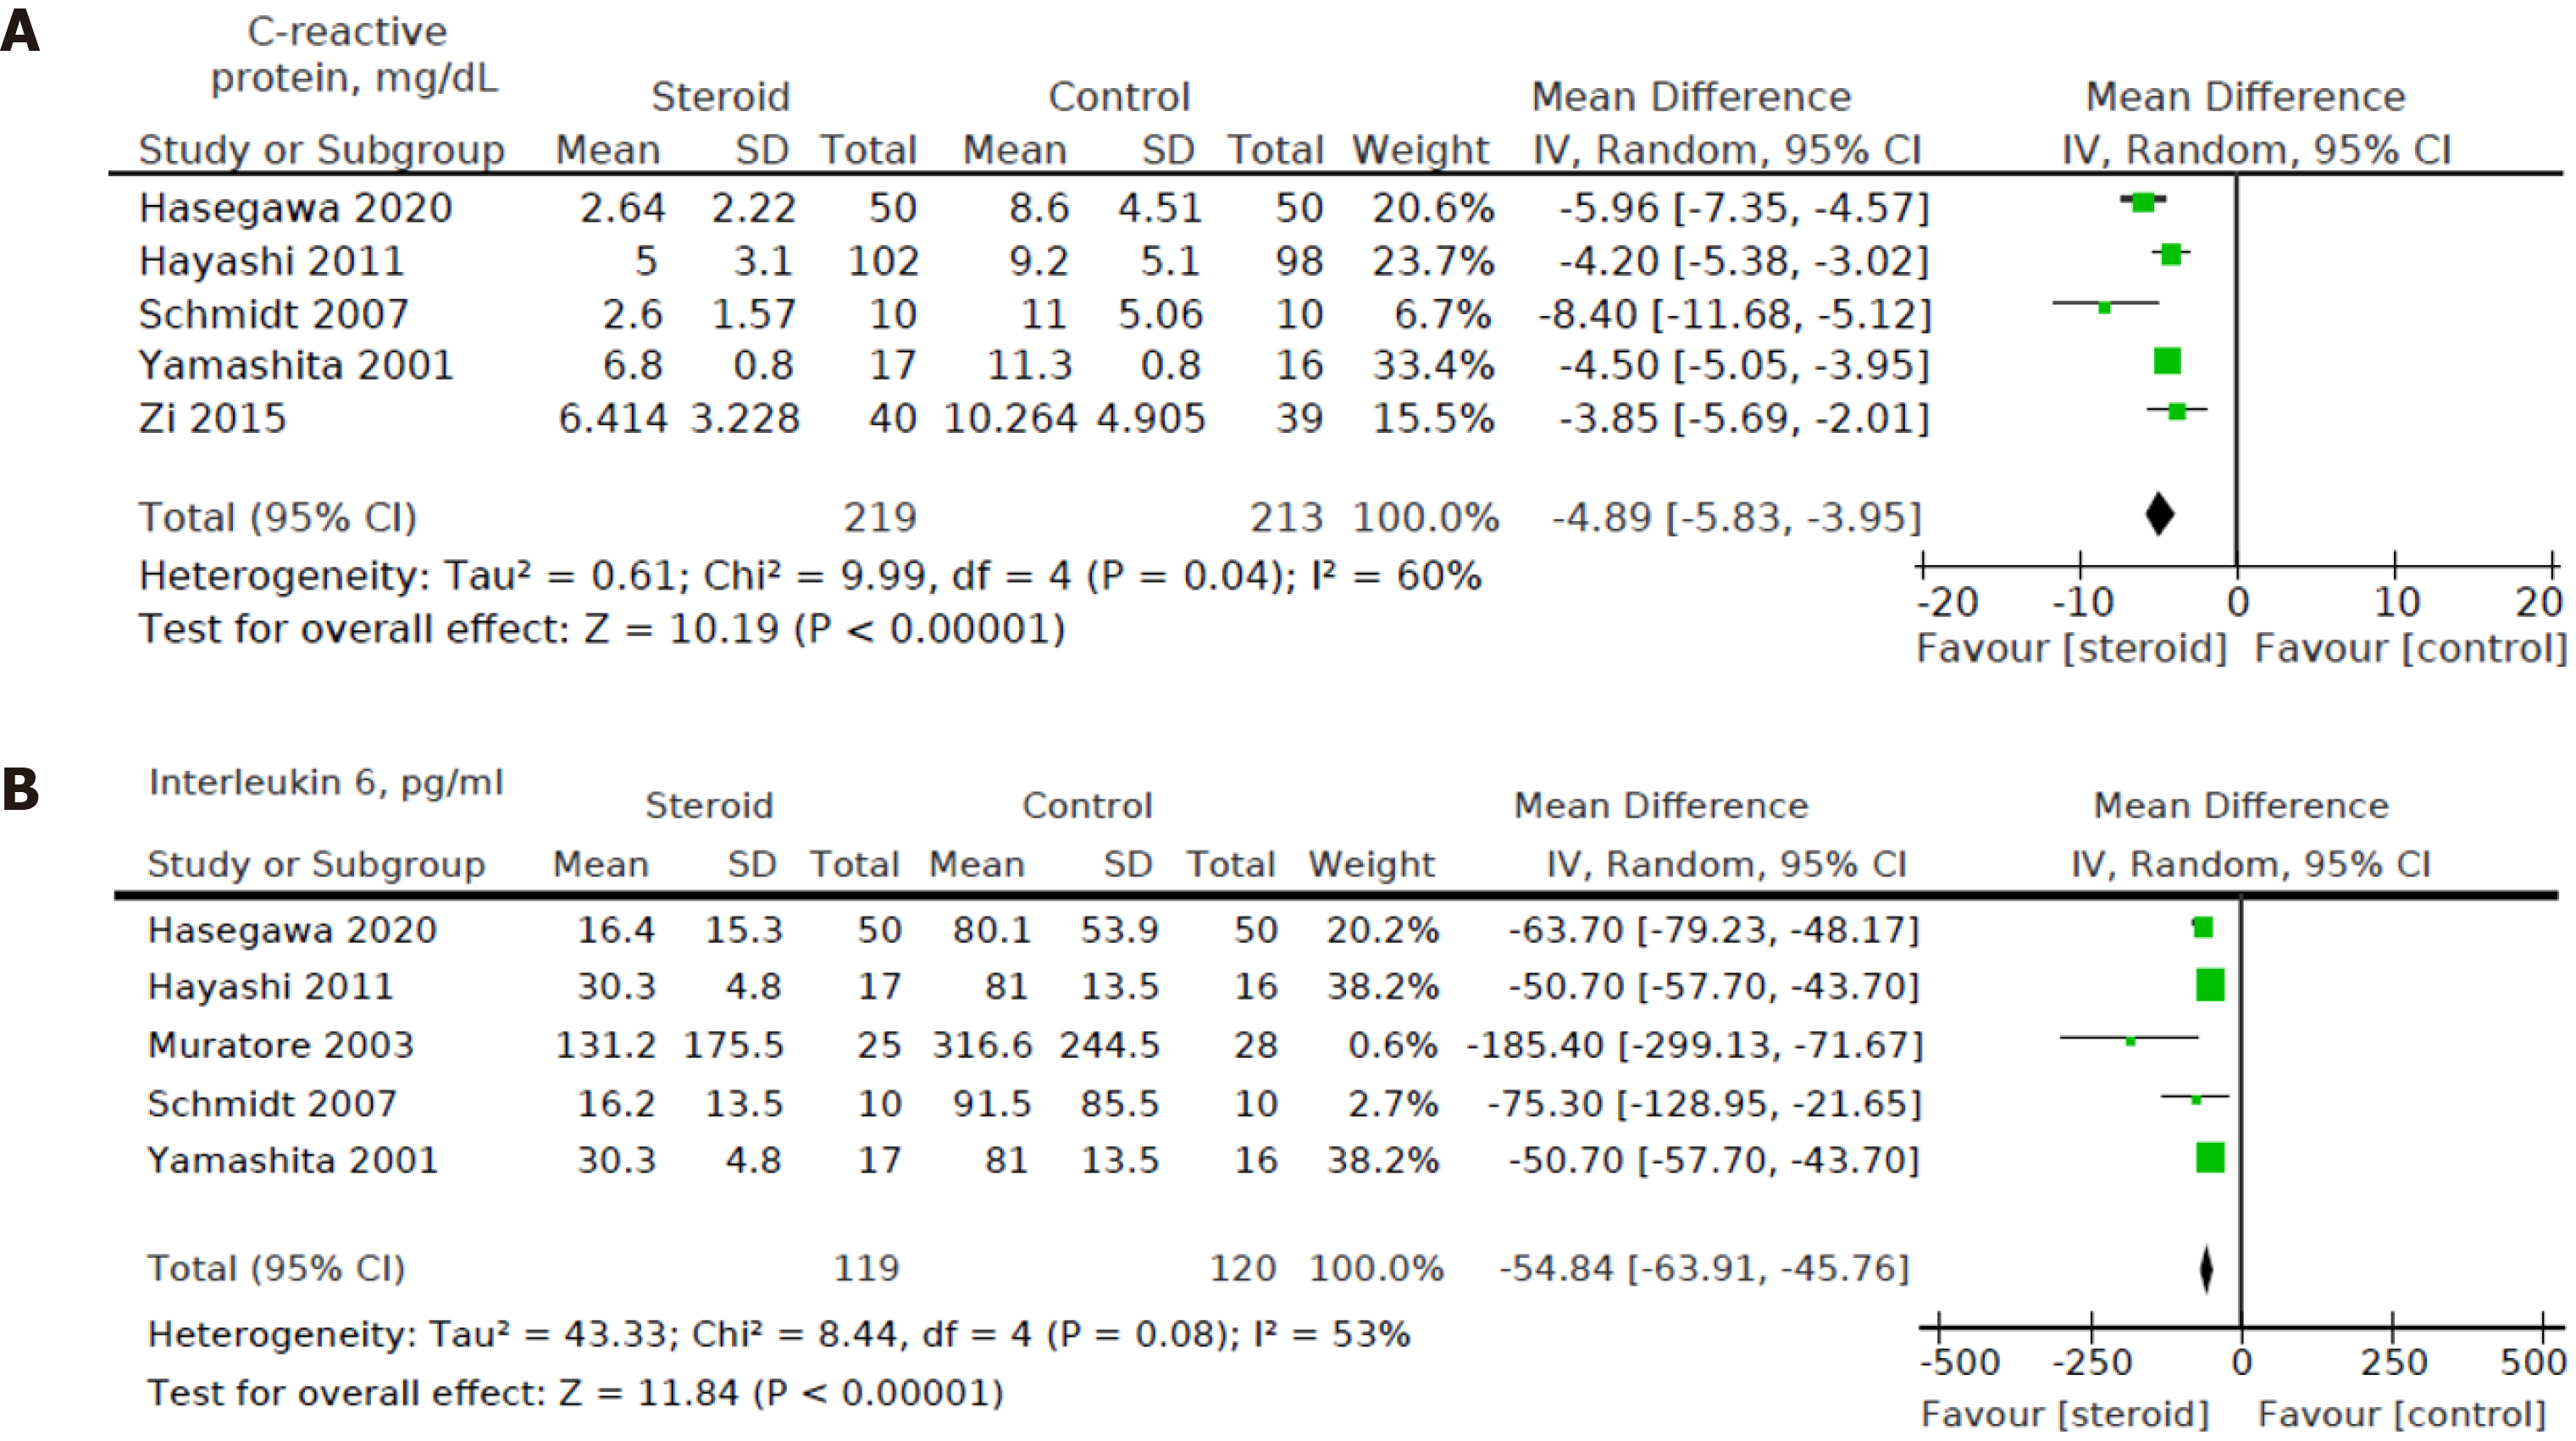
Figure 8 Pooled results comparing steroids group to the control group.
A: Postoperative day 3 C-reactive protein, mg/dL; B: Postoperative day 1 interleukin 6 levels, pg/mL illustrated by forest plots. Random effects model was used. IV: Inverse variance; CI: Confidence interval.
- Citation: Hai HH, Aw P, Teng TZJ, Shelat VG. Perioperative steroid administration reduces overall complications in patients undergoing liver resection: A meta-analysis. World J Gastrointest Surg 2021; 13(9): 1079-1094
- URL: https://www.wjgnet.com/1948-9366/full/v13/i9/1079.htm
- DOI: https://dx.doi.org/10.4240/wjgs.v13.i9.1079


