Copyright
©The Author(s) 2021.
World J Gastrointest Surg. Jul 27, 2021; 13(7): 717-733
Published online Jul 27, 2021. doi: 10.4240/wjgs.v13.i7.717
Published online Jul 27, 2021. doi: 10.4240/wjgs.v13.i7.717
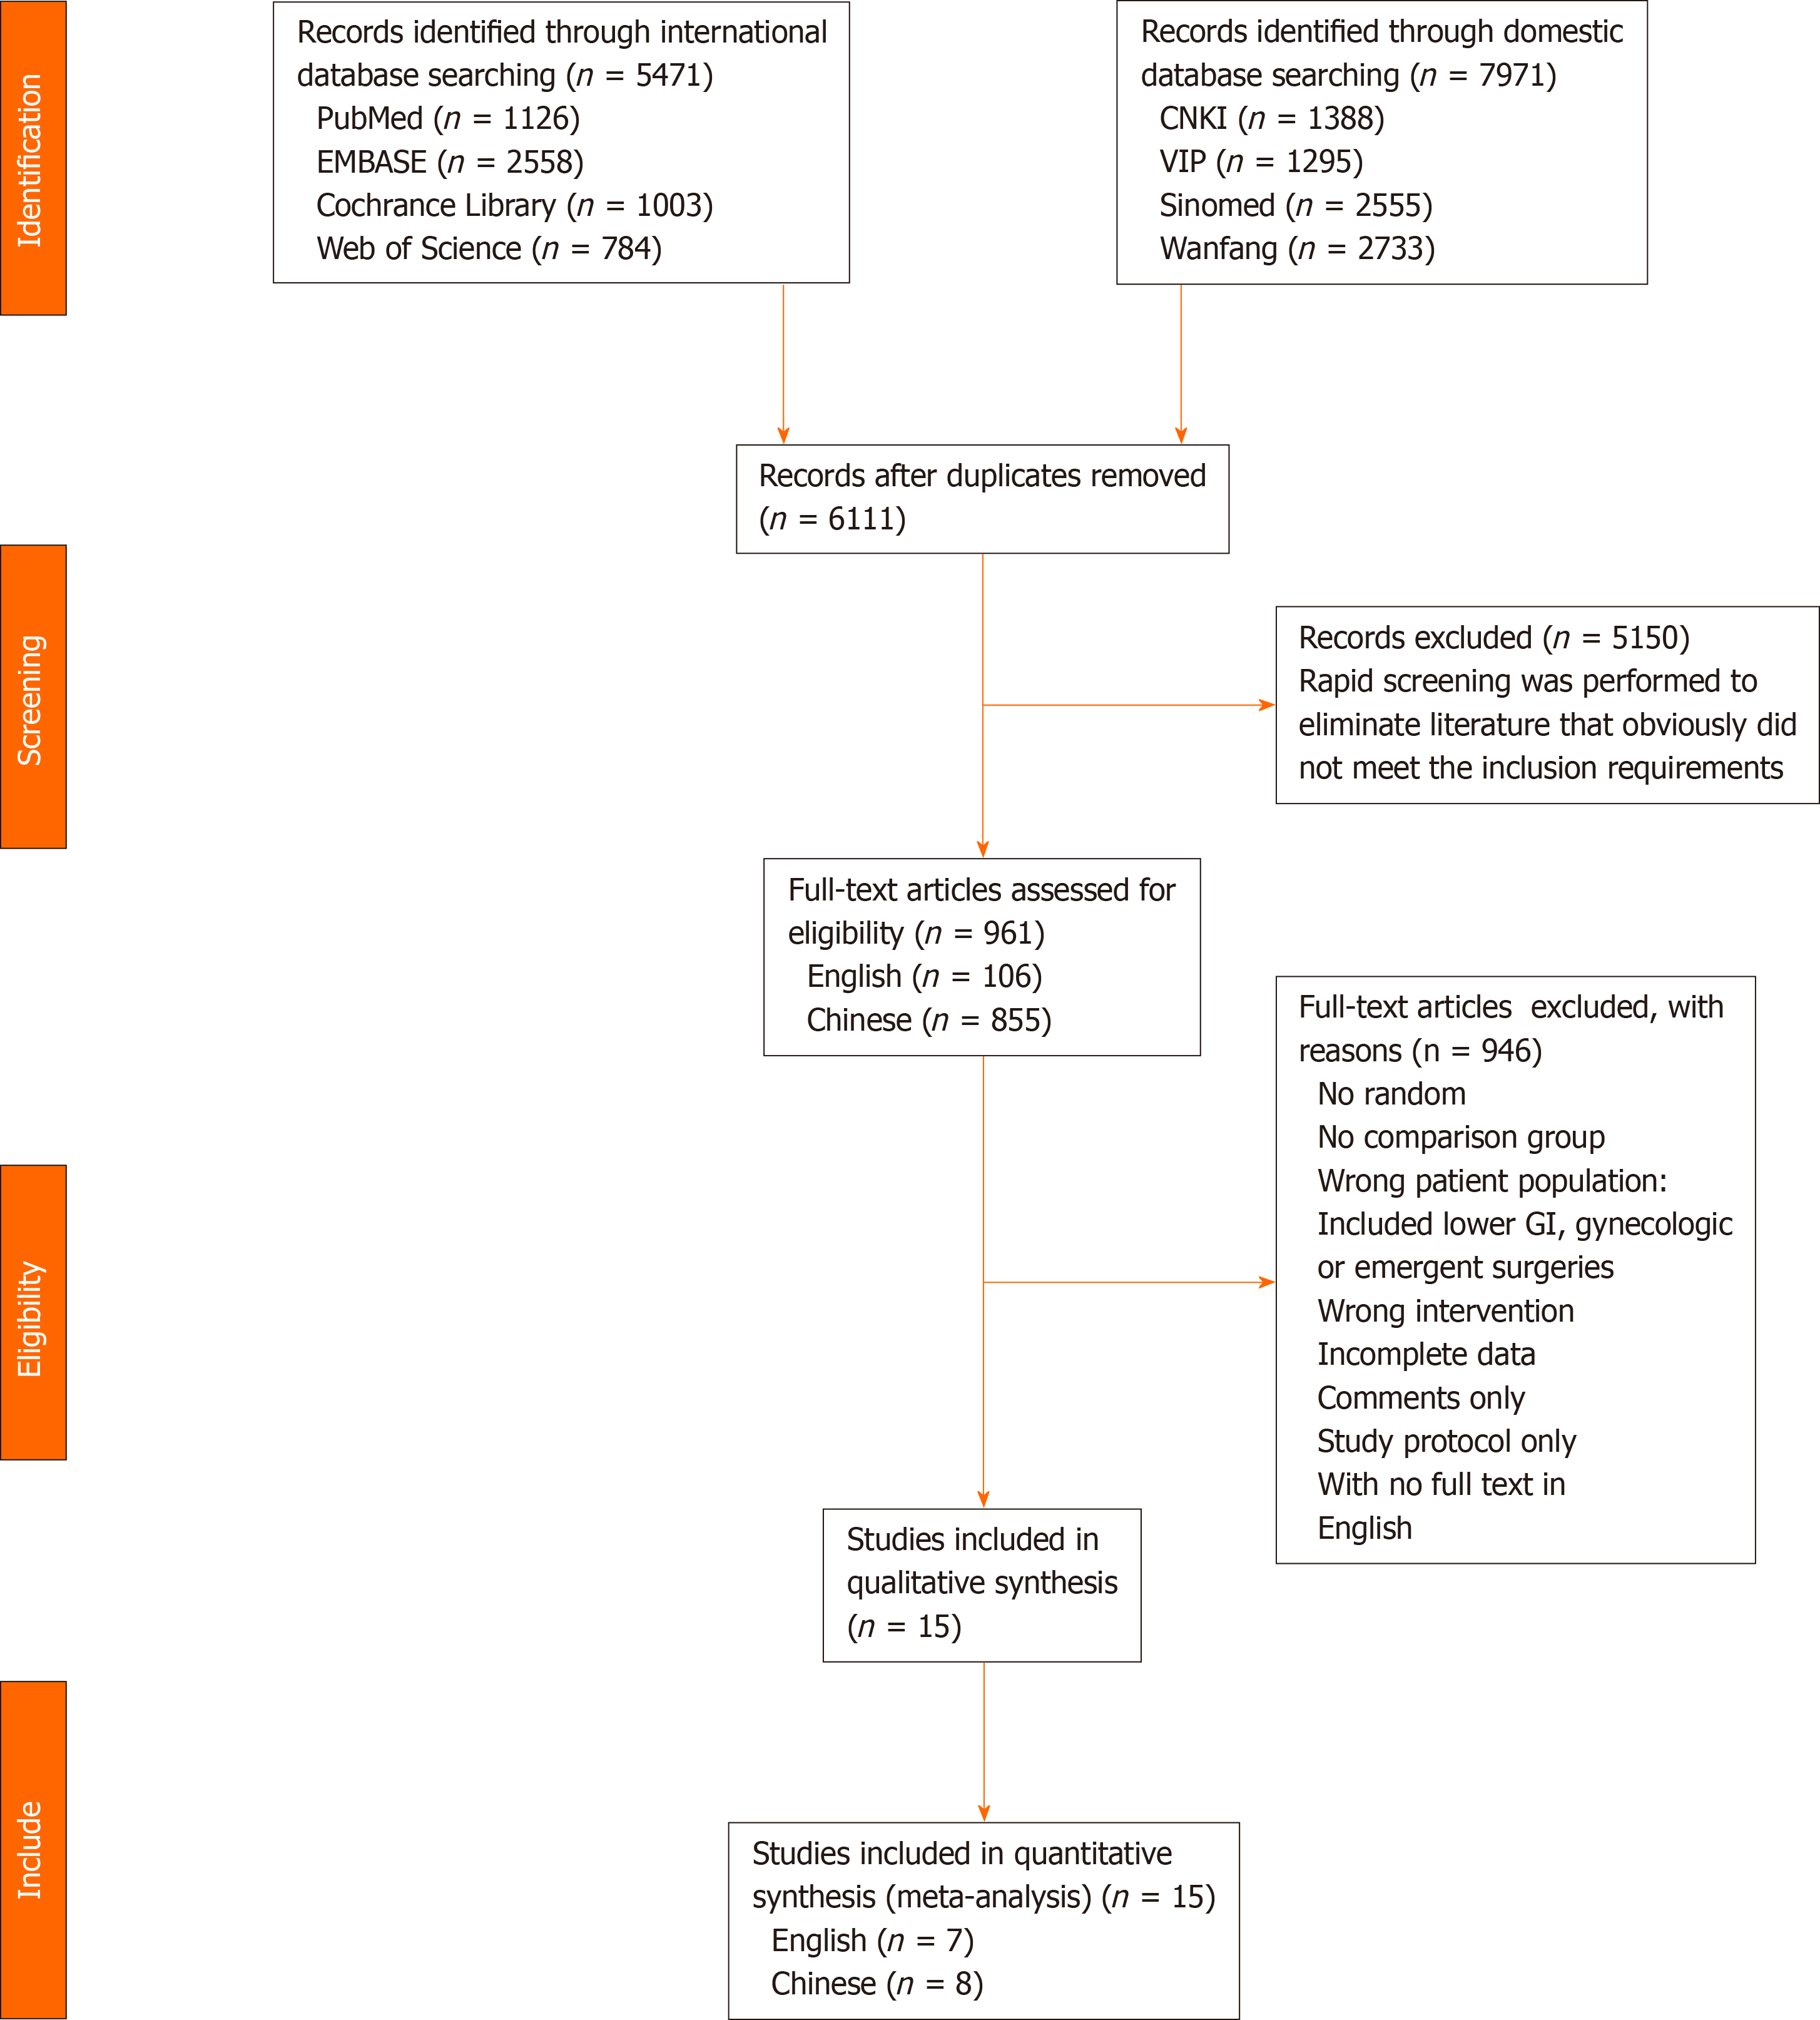
Figure 1 PRISMA flowchart of the study selection process.
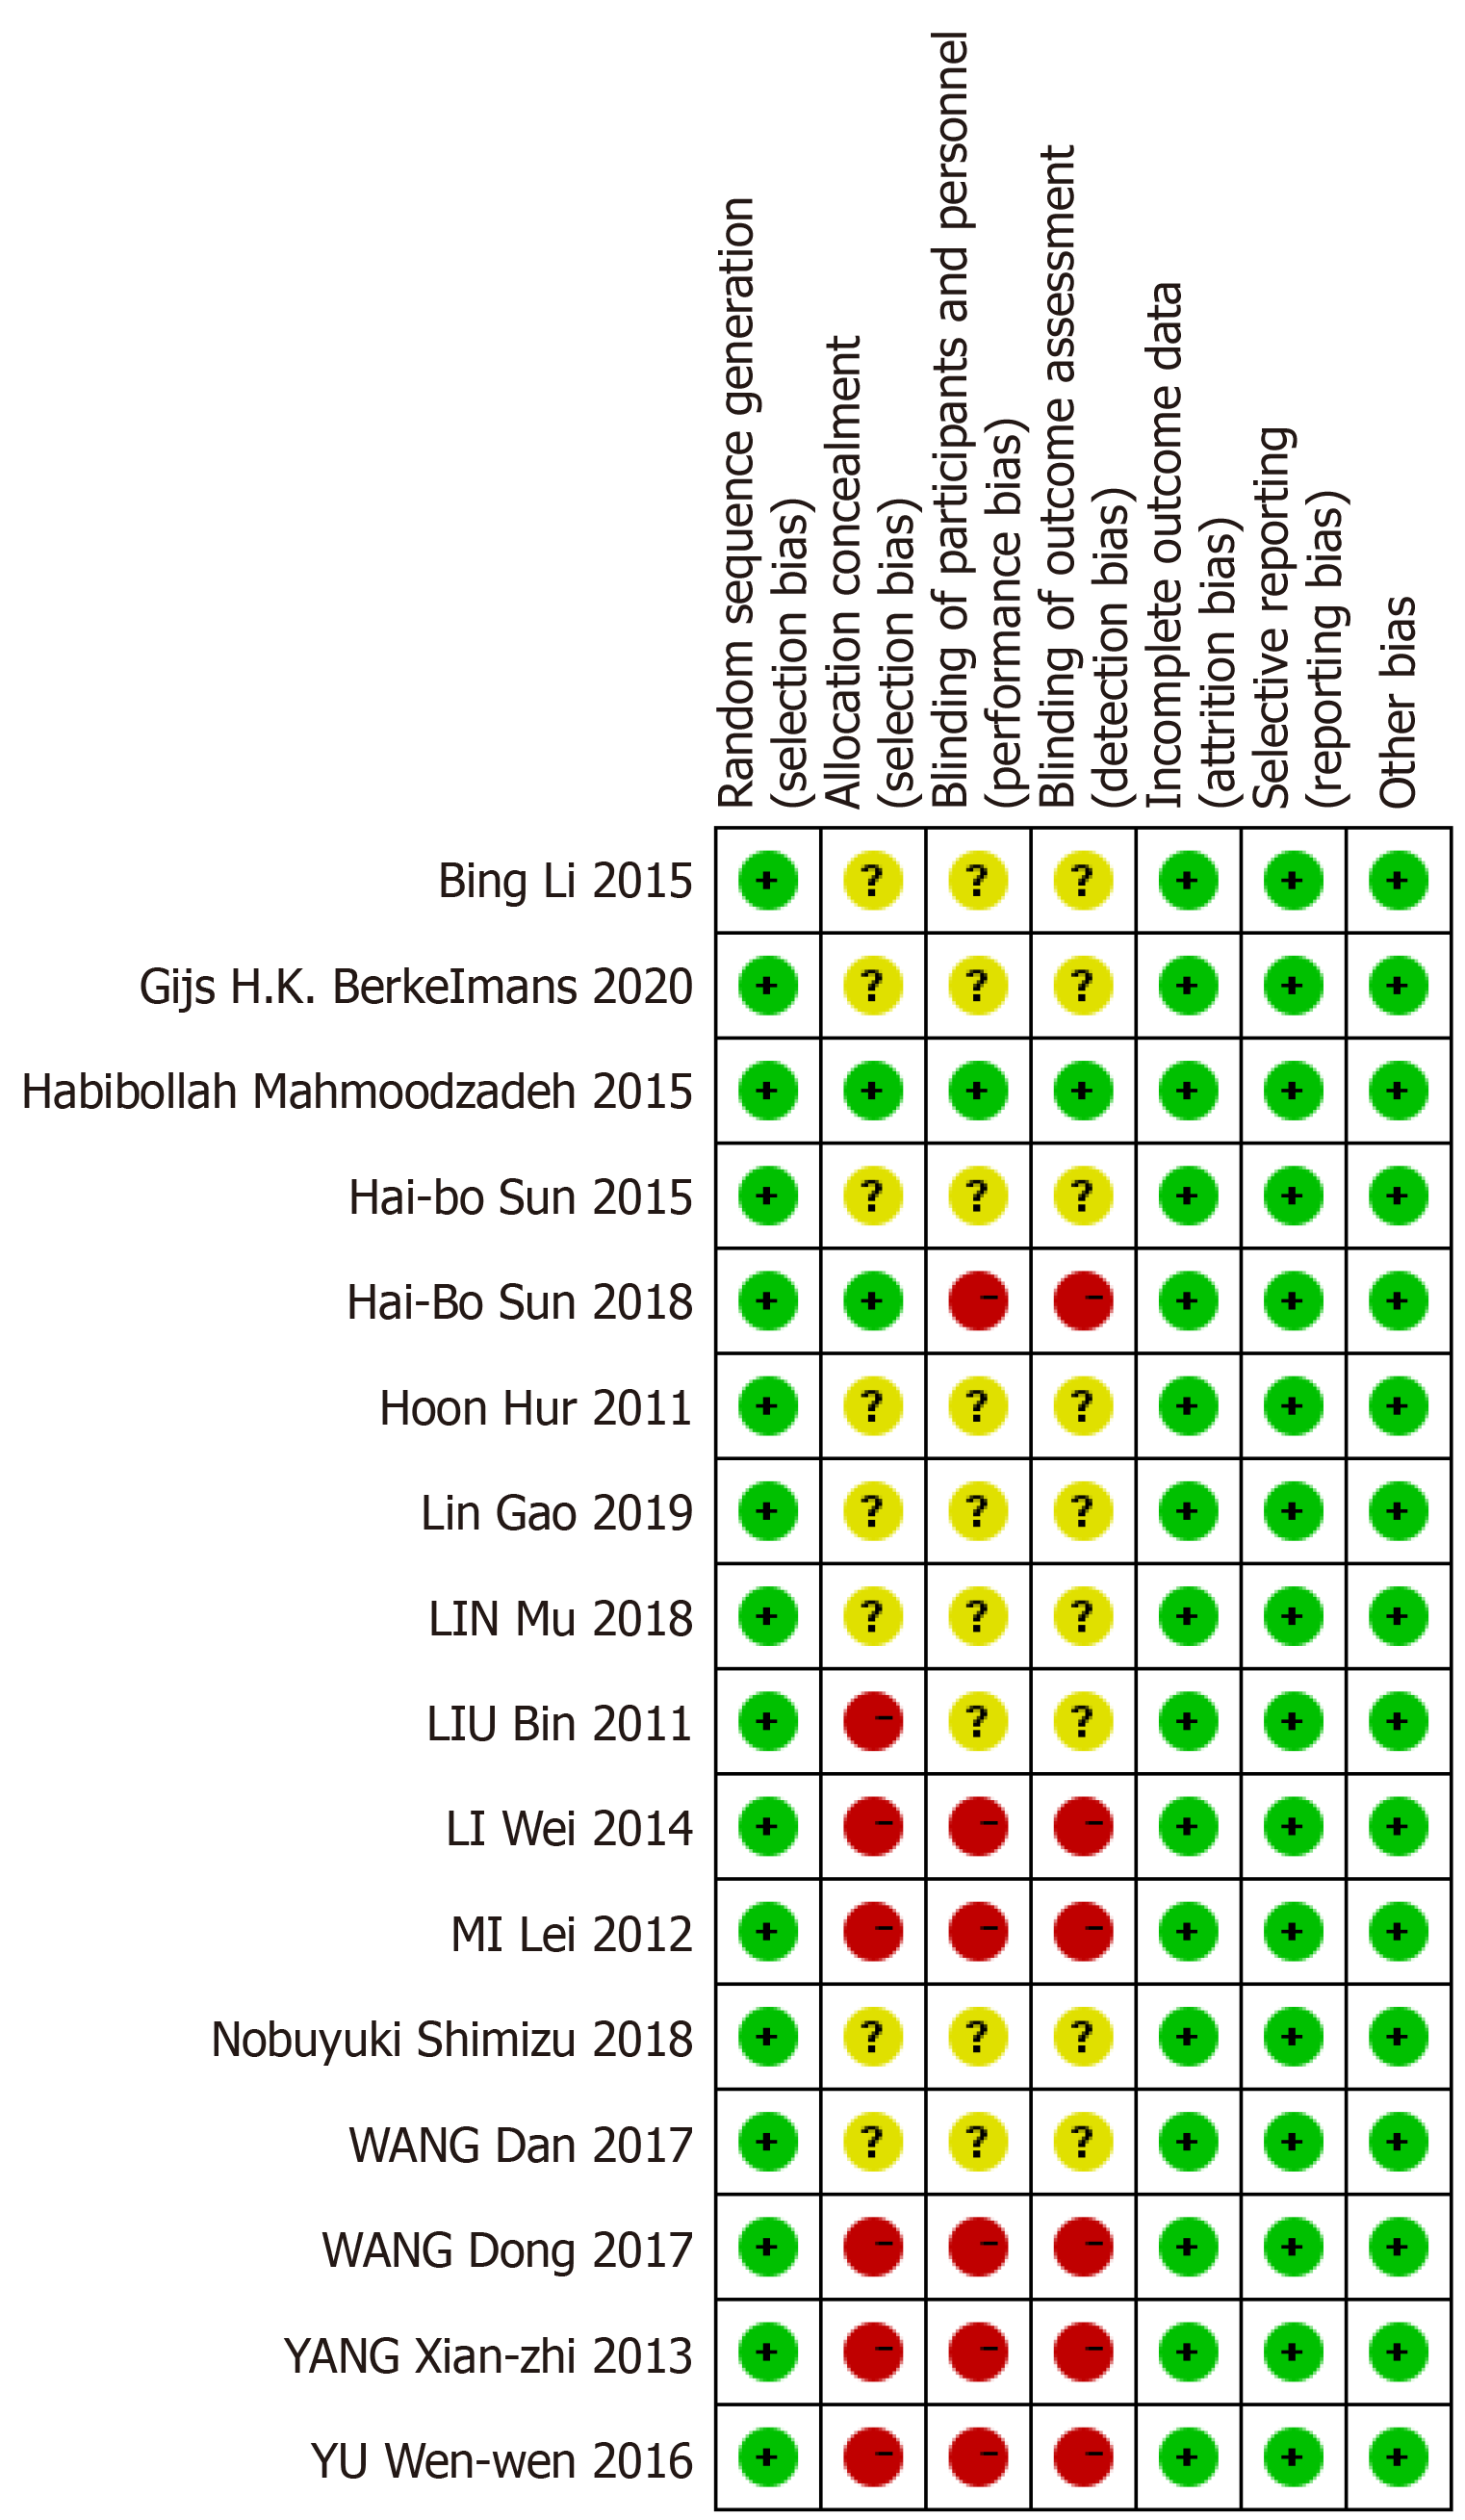
Figure 2 Risk of bias summary.
Review of authors' judgments concerning each risk-of-bias item for each included study.
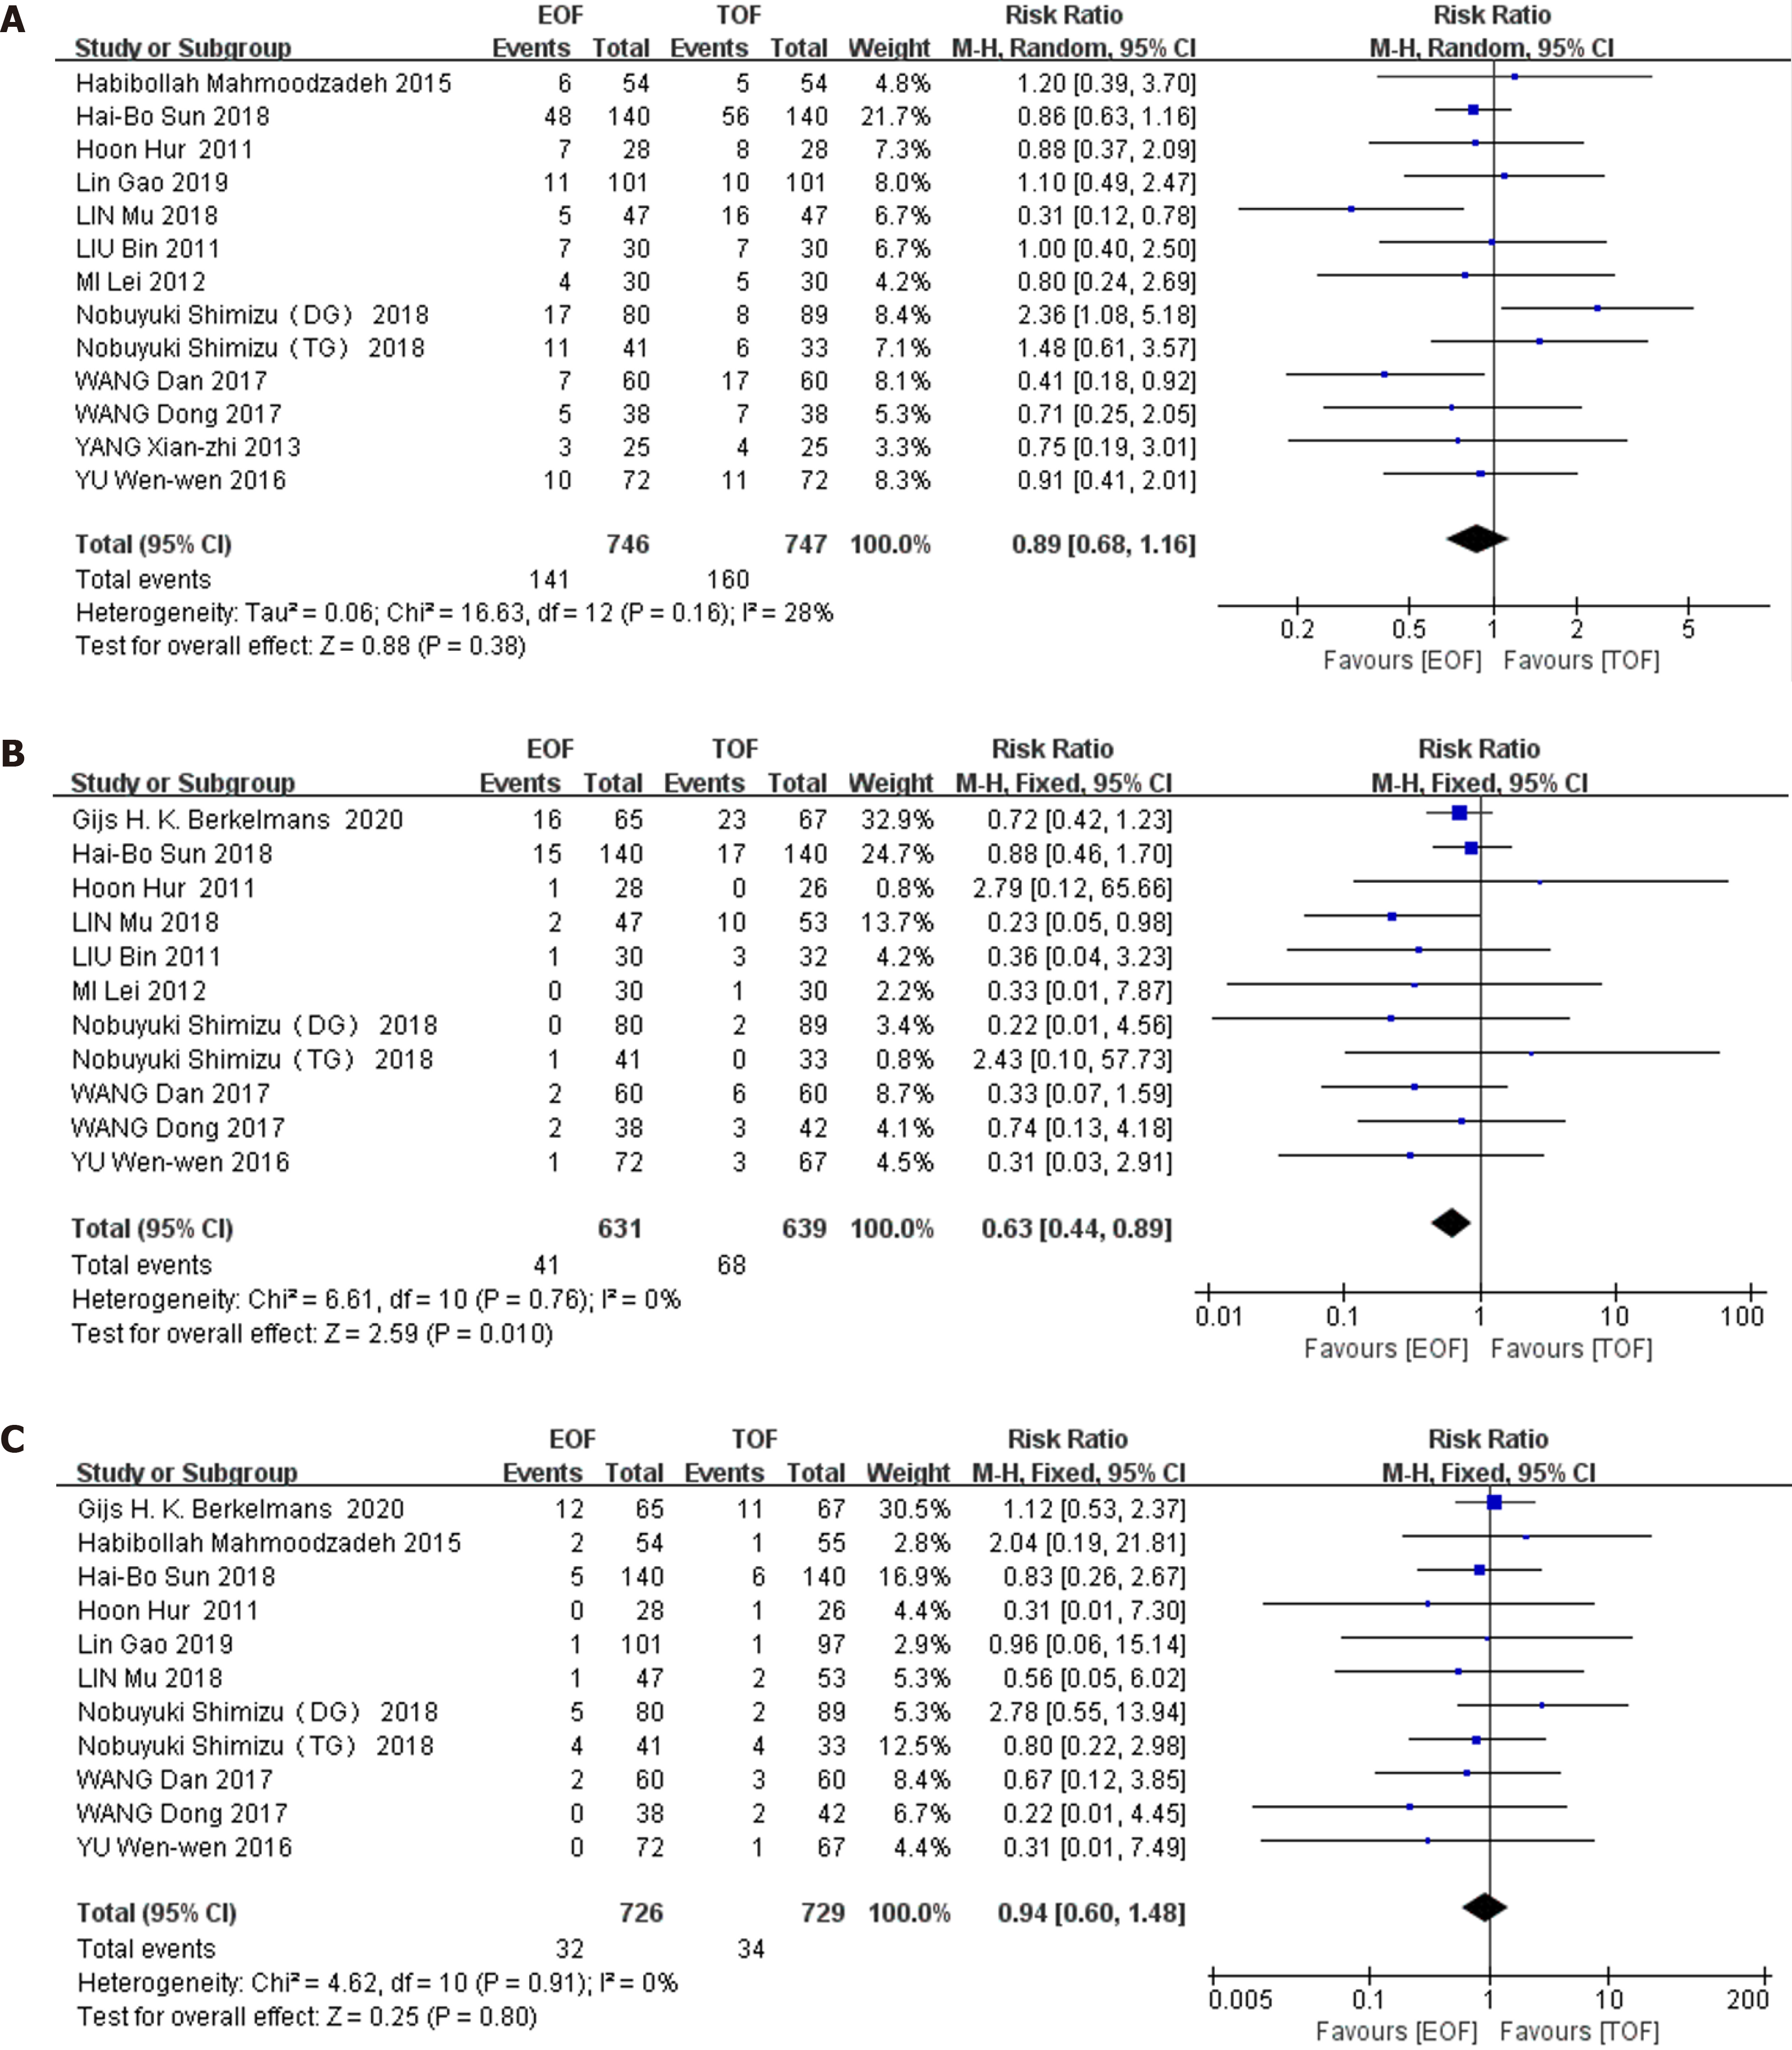
Figure 3 Forest plot evaluating the relative risk of postoperative complications.
A: total postoperative complications; B: Pneumonia; C: Anastomotic leakage. EOF vs TOF. EOF: Early oral feeding; TOF: Traditional oral feeding.
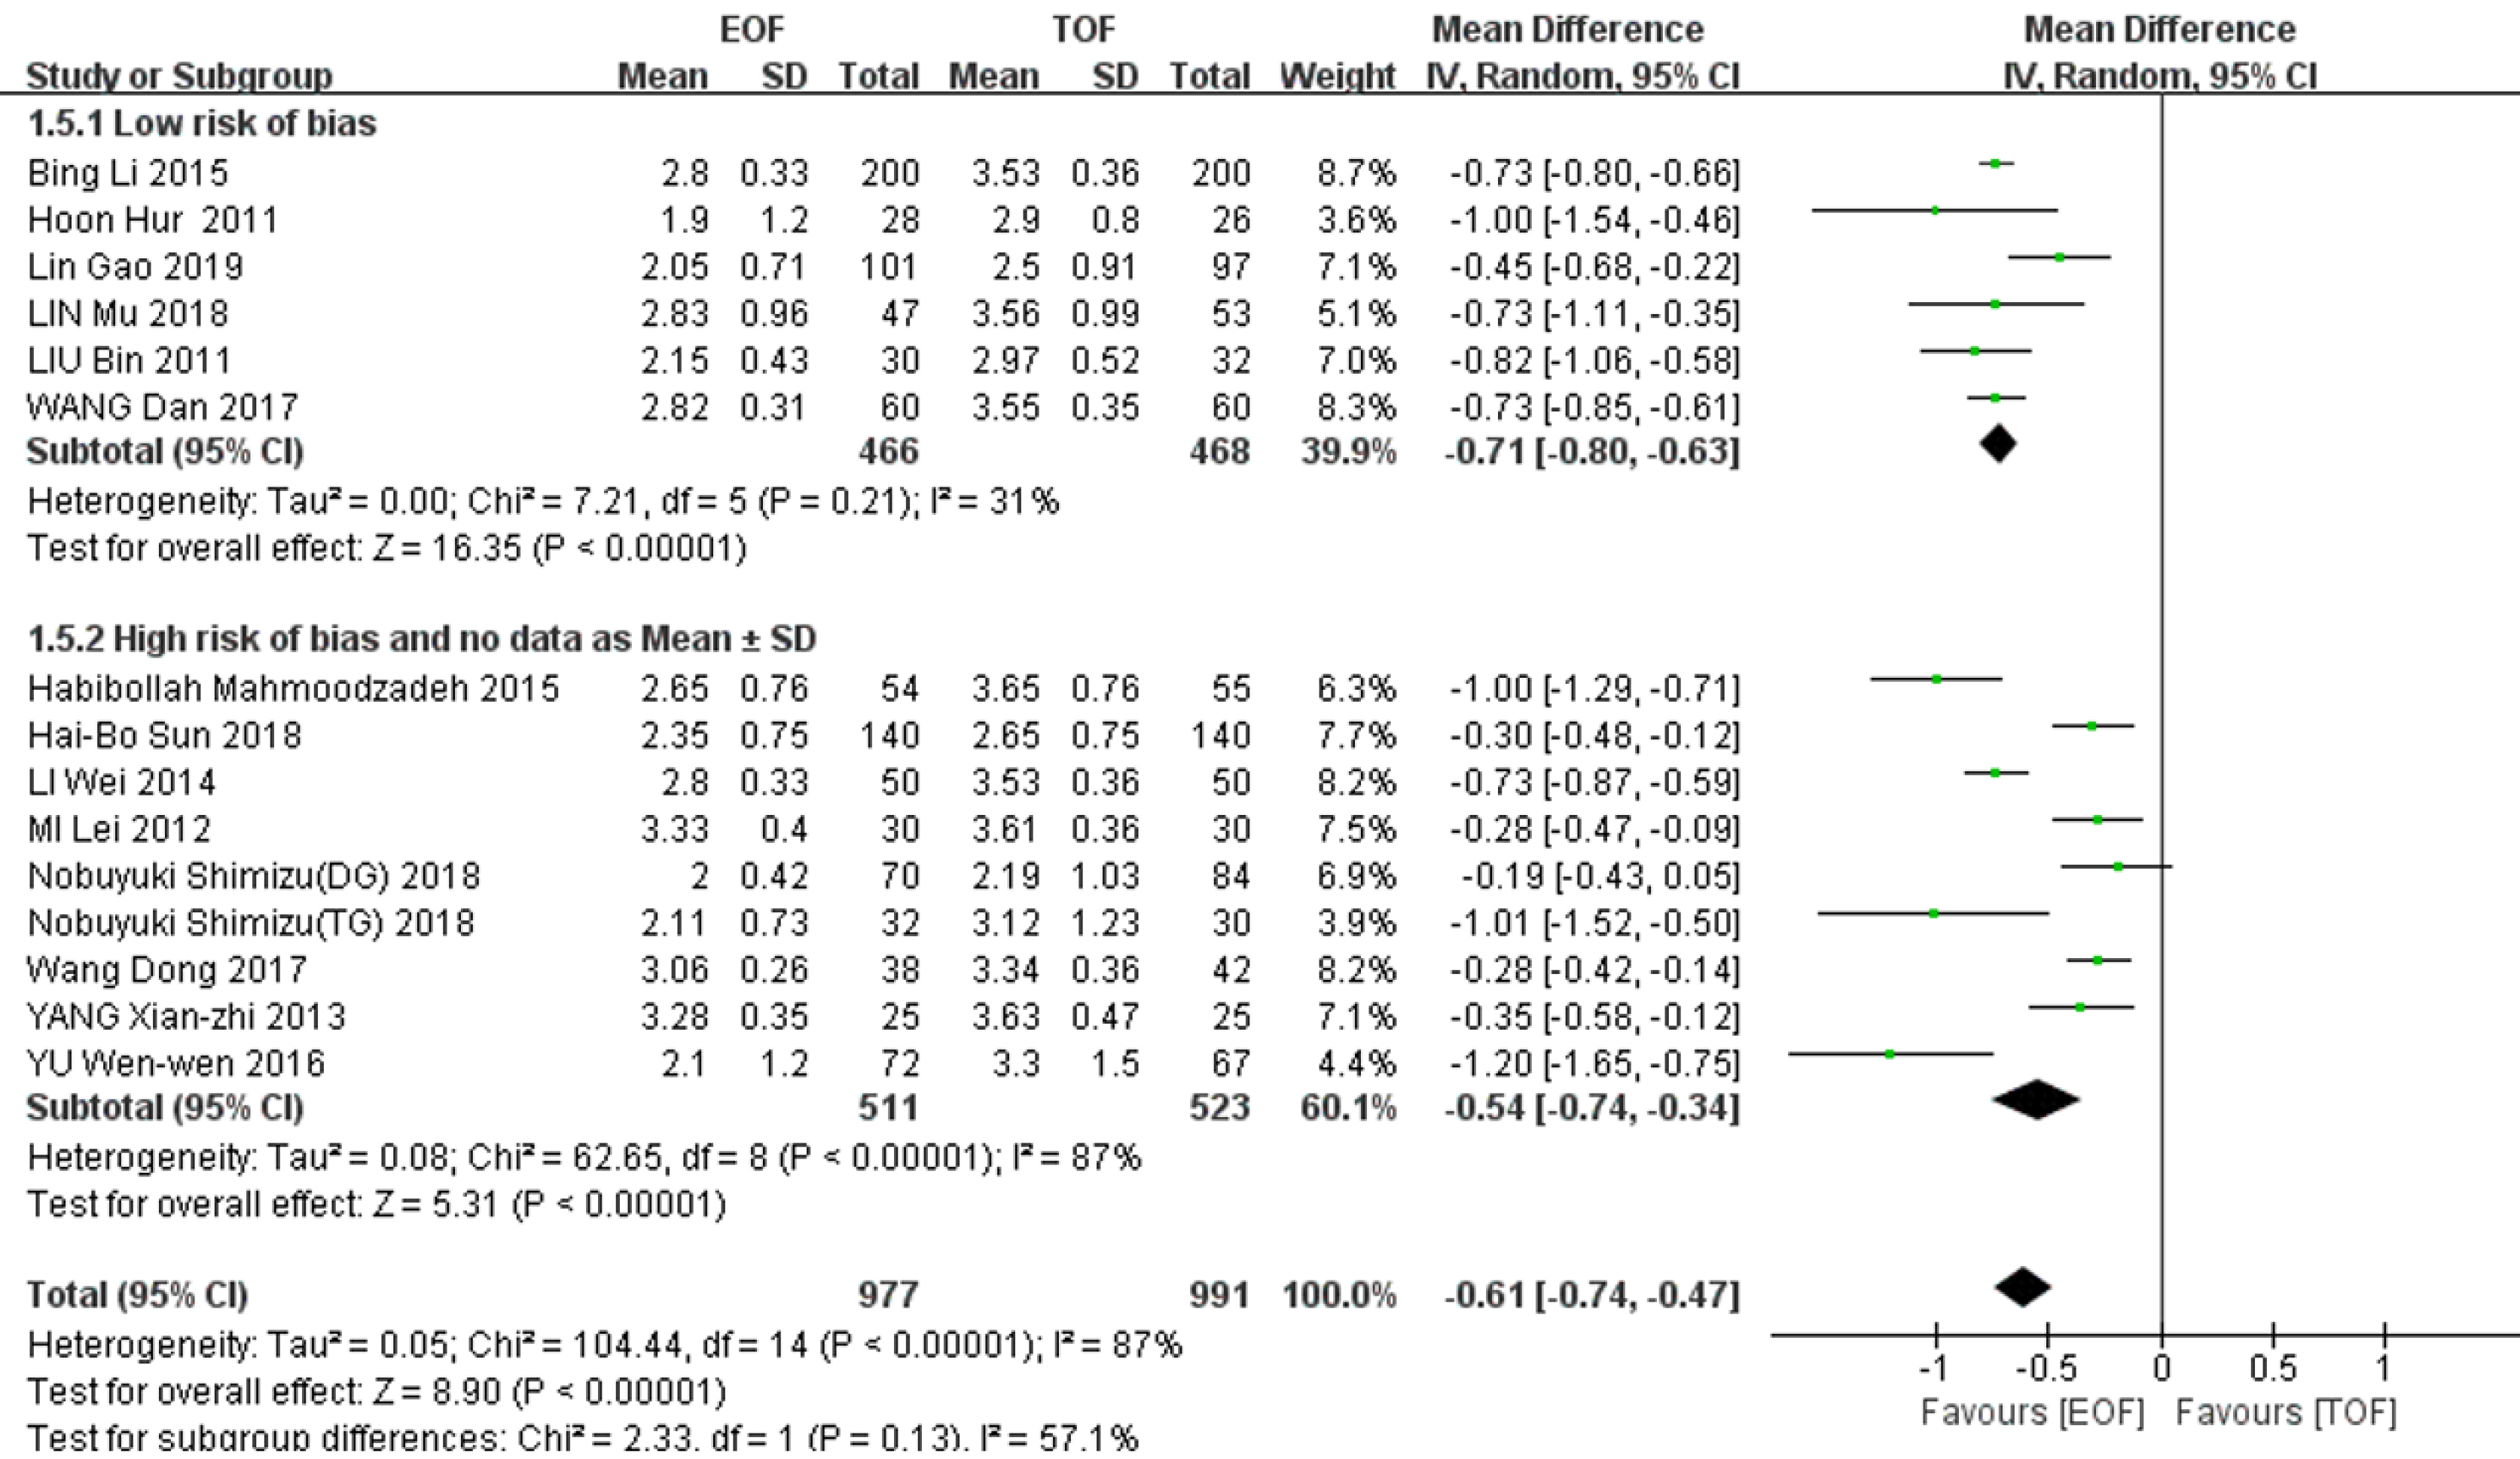
Figure 4 Forest plot evaluating the time of gas passage.
EOF: Early oral feeding; TOF: Traditional oral feeding.
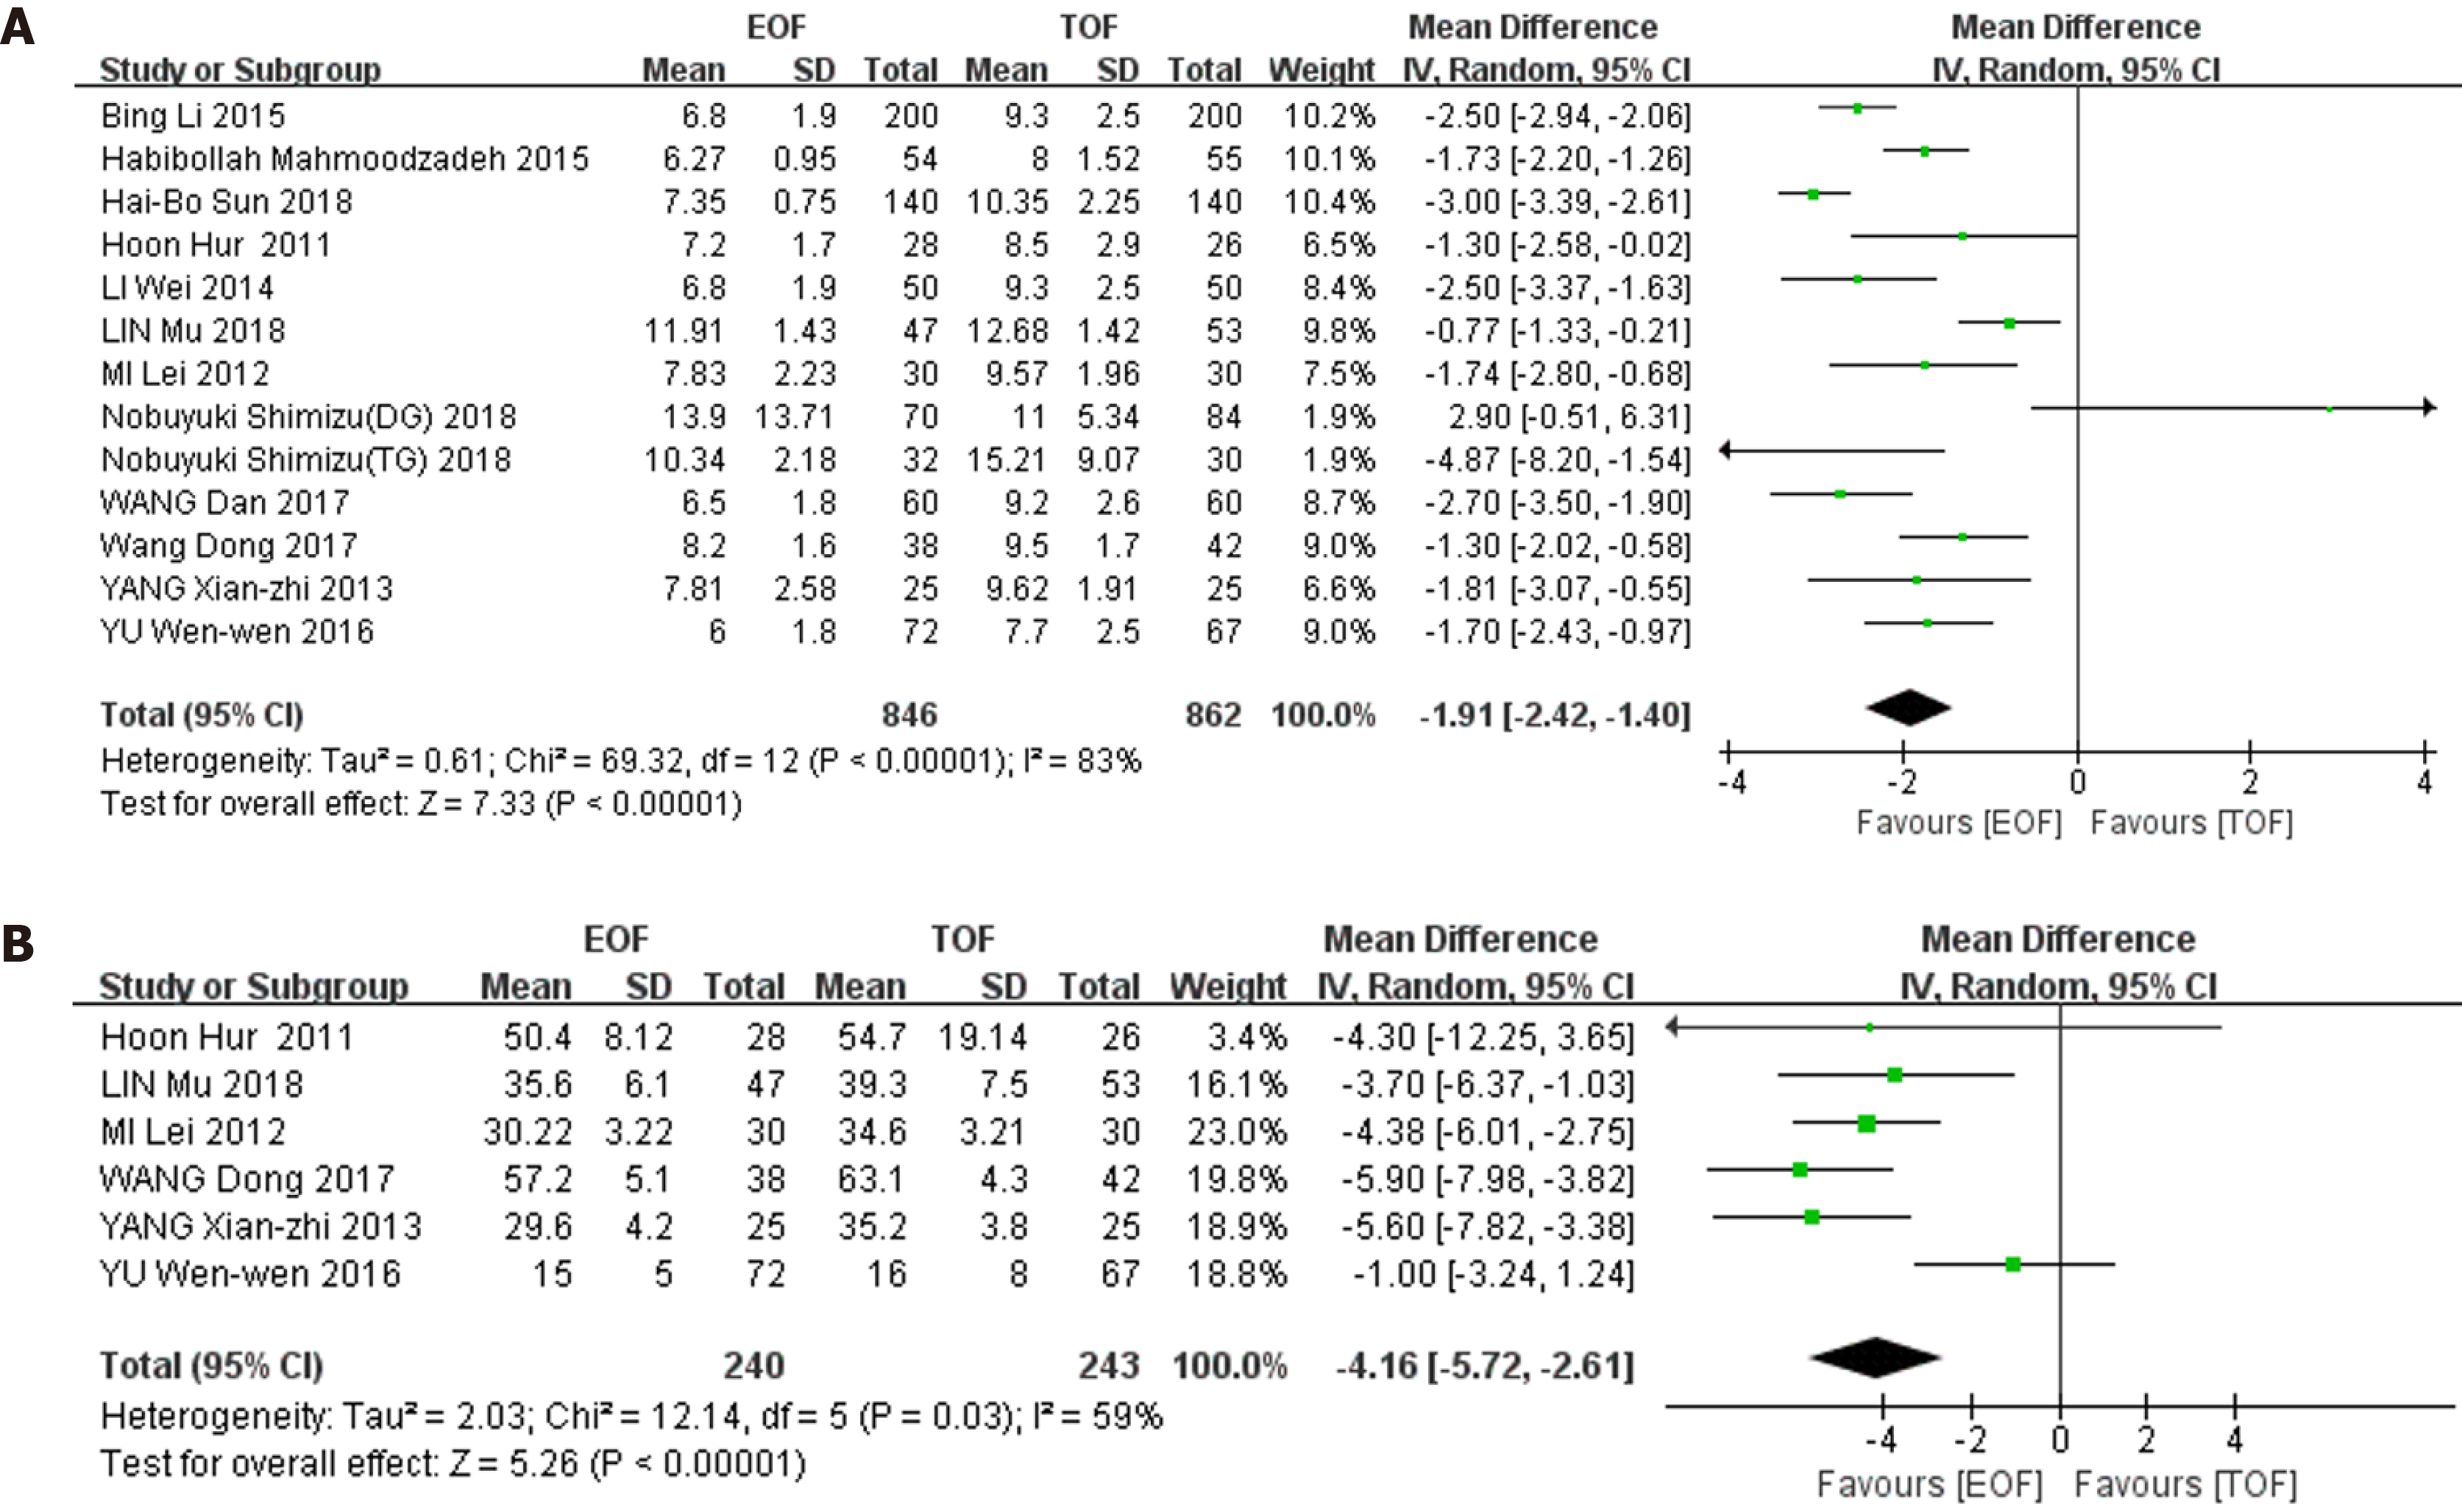
Figure 5 Forest plot evaluating length of stay (A) and cost of hospitalization (B).
EOF: Early oral feeding; TOF: Traditional oral feeding.
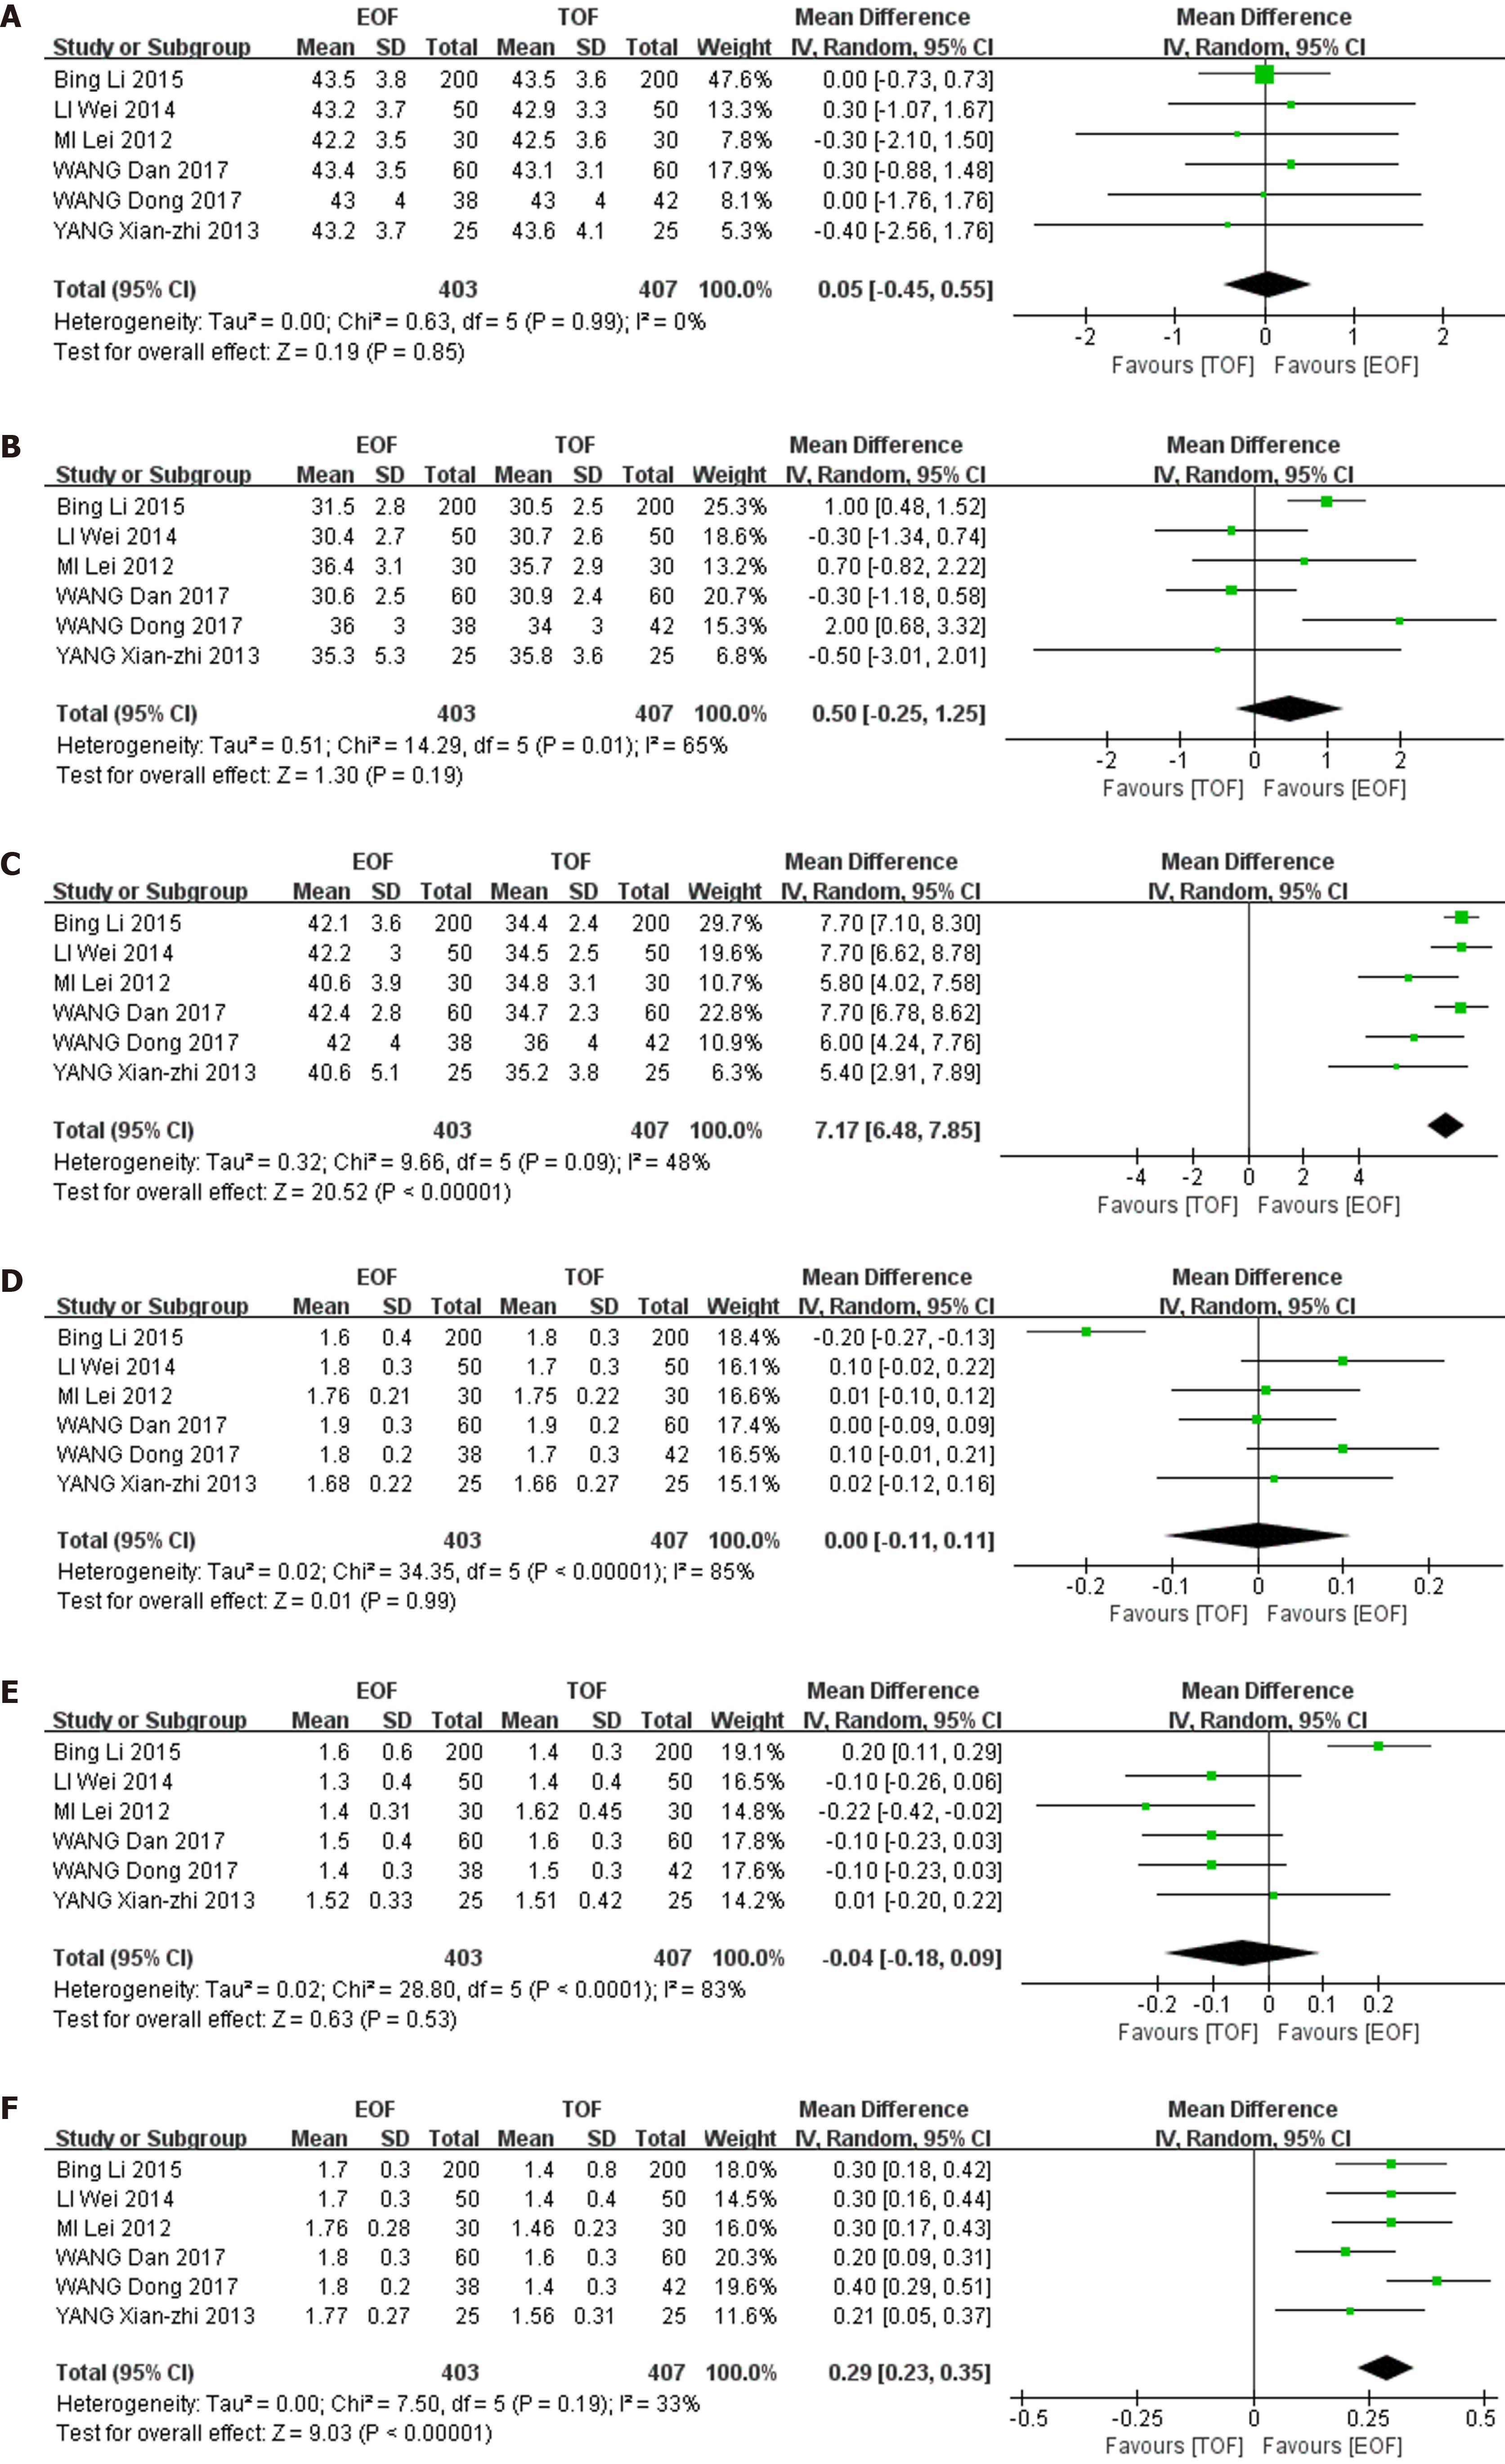
Figure 6 Forest plot evaluating CD4 cell count and CD4/CD8 cell ratio.
A: CD4 preoperative day 1; B: CD4 POD1; C: CD4 POD7; D: CD4/CD8 preoperative day 1; E: CD4/CD8 POD1; F: CD4/CD8 POD7. EOF: Early oral feeding; POD: Postoperative day; TOF: Traditional oral feeding.
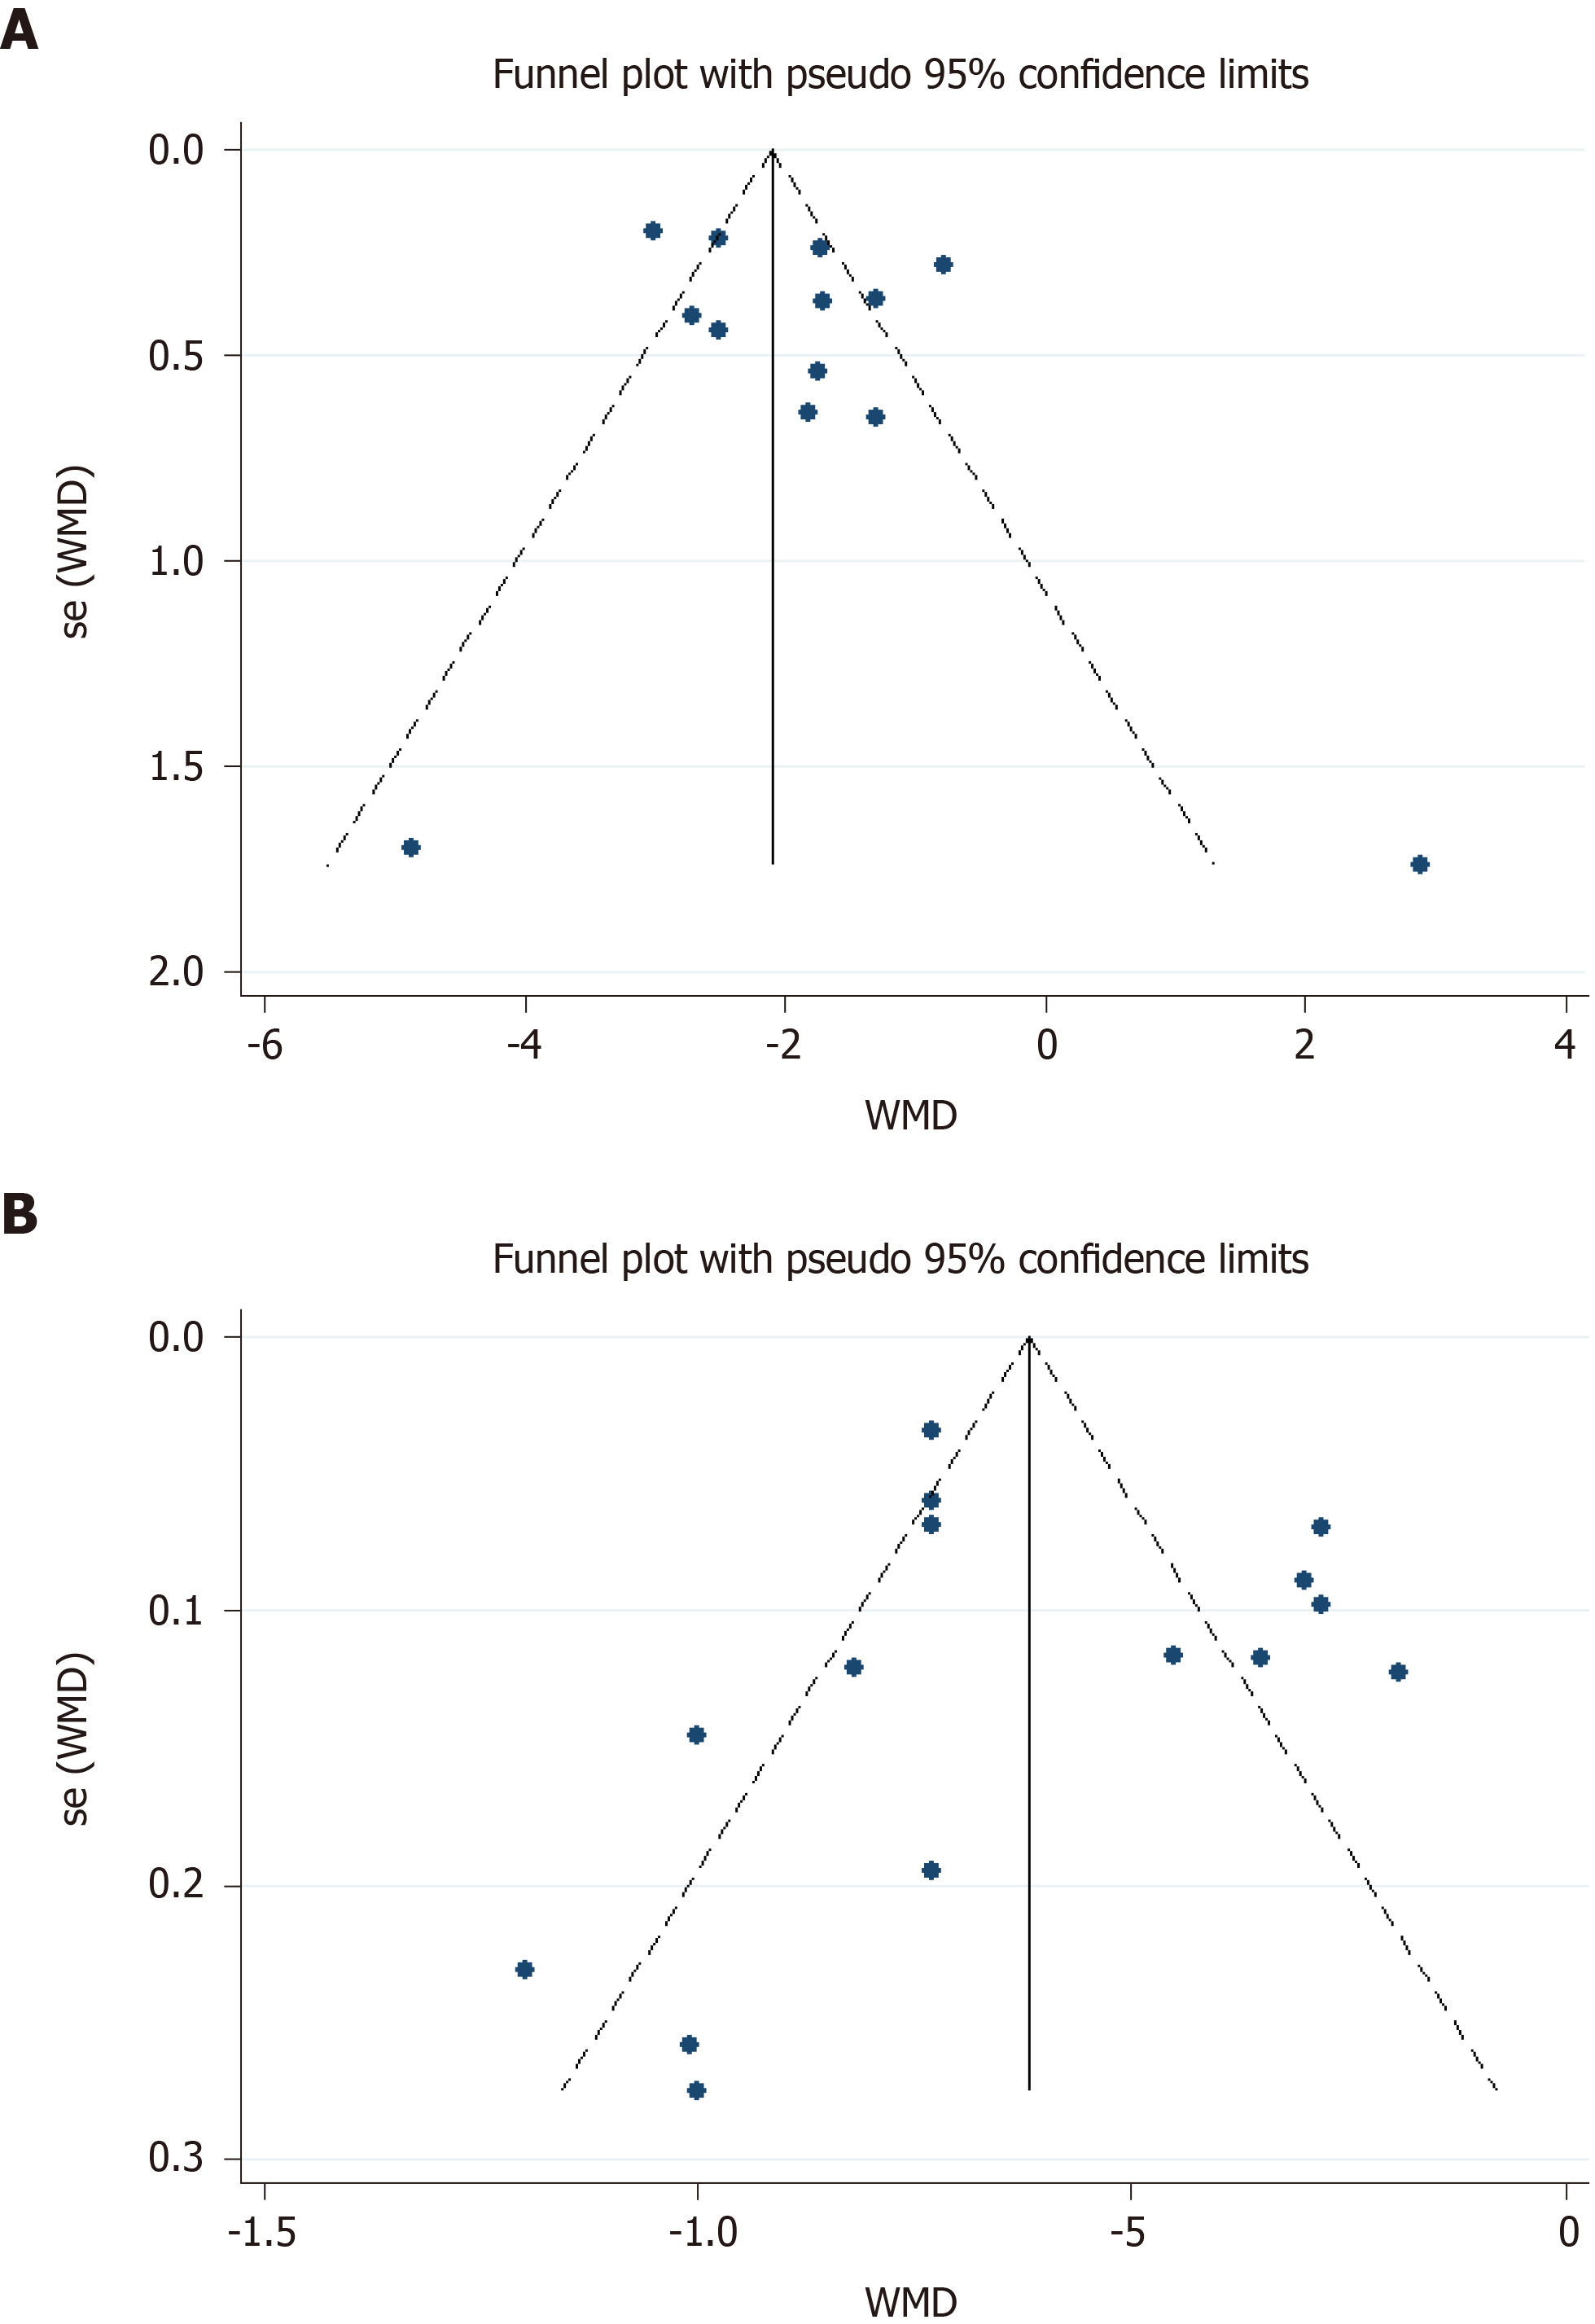
Figure 7 Funnel plot of length of hospital stay (A) and postoperative exhaust time (B) in all included studies.
Egger's test: LOS, P > 0.290; exhaust time, P > 0.725.
- Citation: Hao T, Liu Q, Lv X, Qiu J, Zhang HR, Jiang HP. Efficacy and safety of early oral feeding in postoperative patients with upper gastrointestinal tumor: A systematic review and meta-analysis. World J Gastrointest Surg 2021; 13(7): 717-733
- URL: https://www.wjgnet.com/1948-9366/full/v13/i7/717.htm
- DOI: https://dx.doi.org/10.4240/wjgs.v13.i7.717


