Copyright
©The Author(s) 2021.
World J Gastrointest Surg. Nov 27, 2021; 13(11): 1463-1483
Published online Nov 27, 2021. doi: 10.4240/wjgs.v13.i11.1463
Published online Nov 27, 2021. doi: 10.4240/wjgs.v13.i11.1463
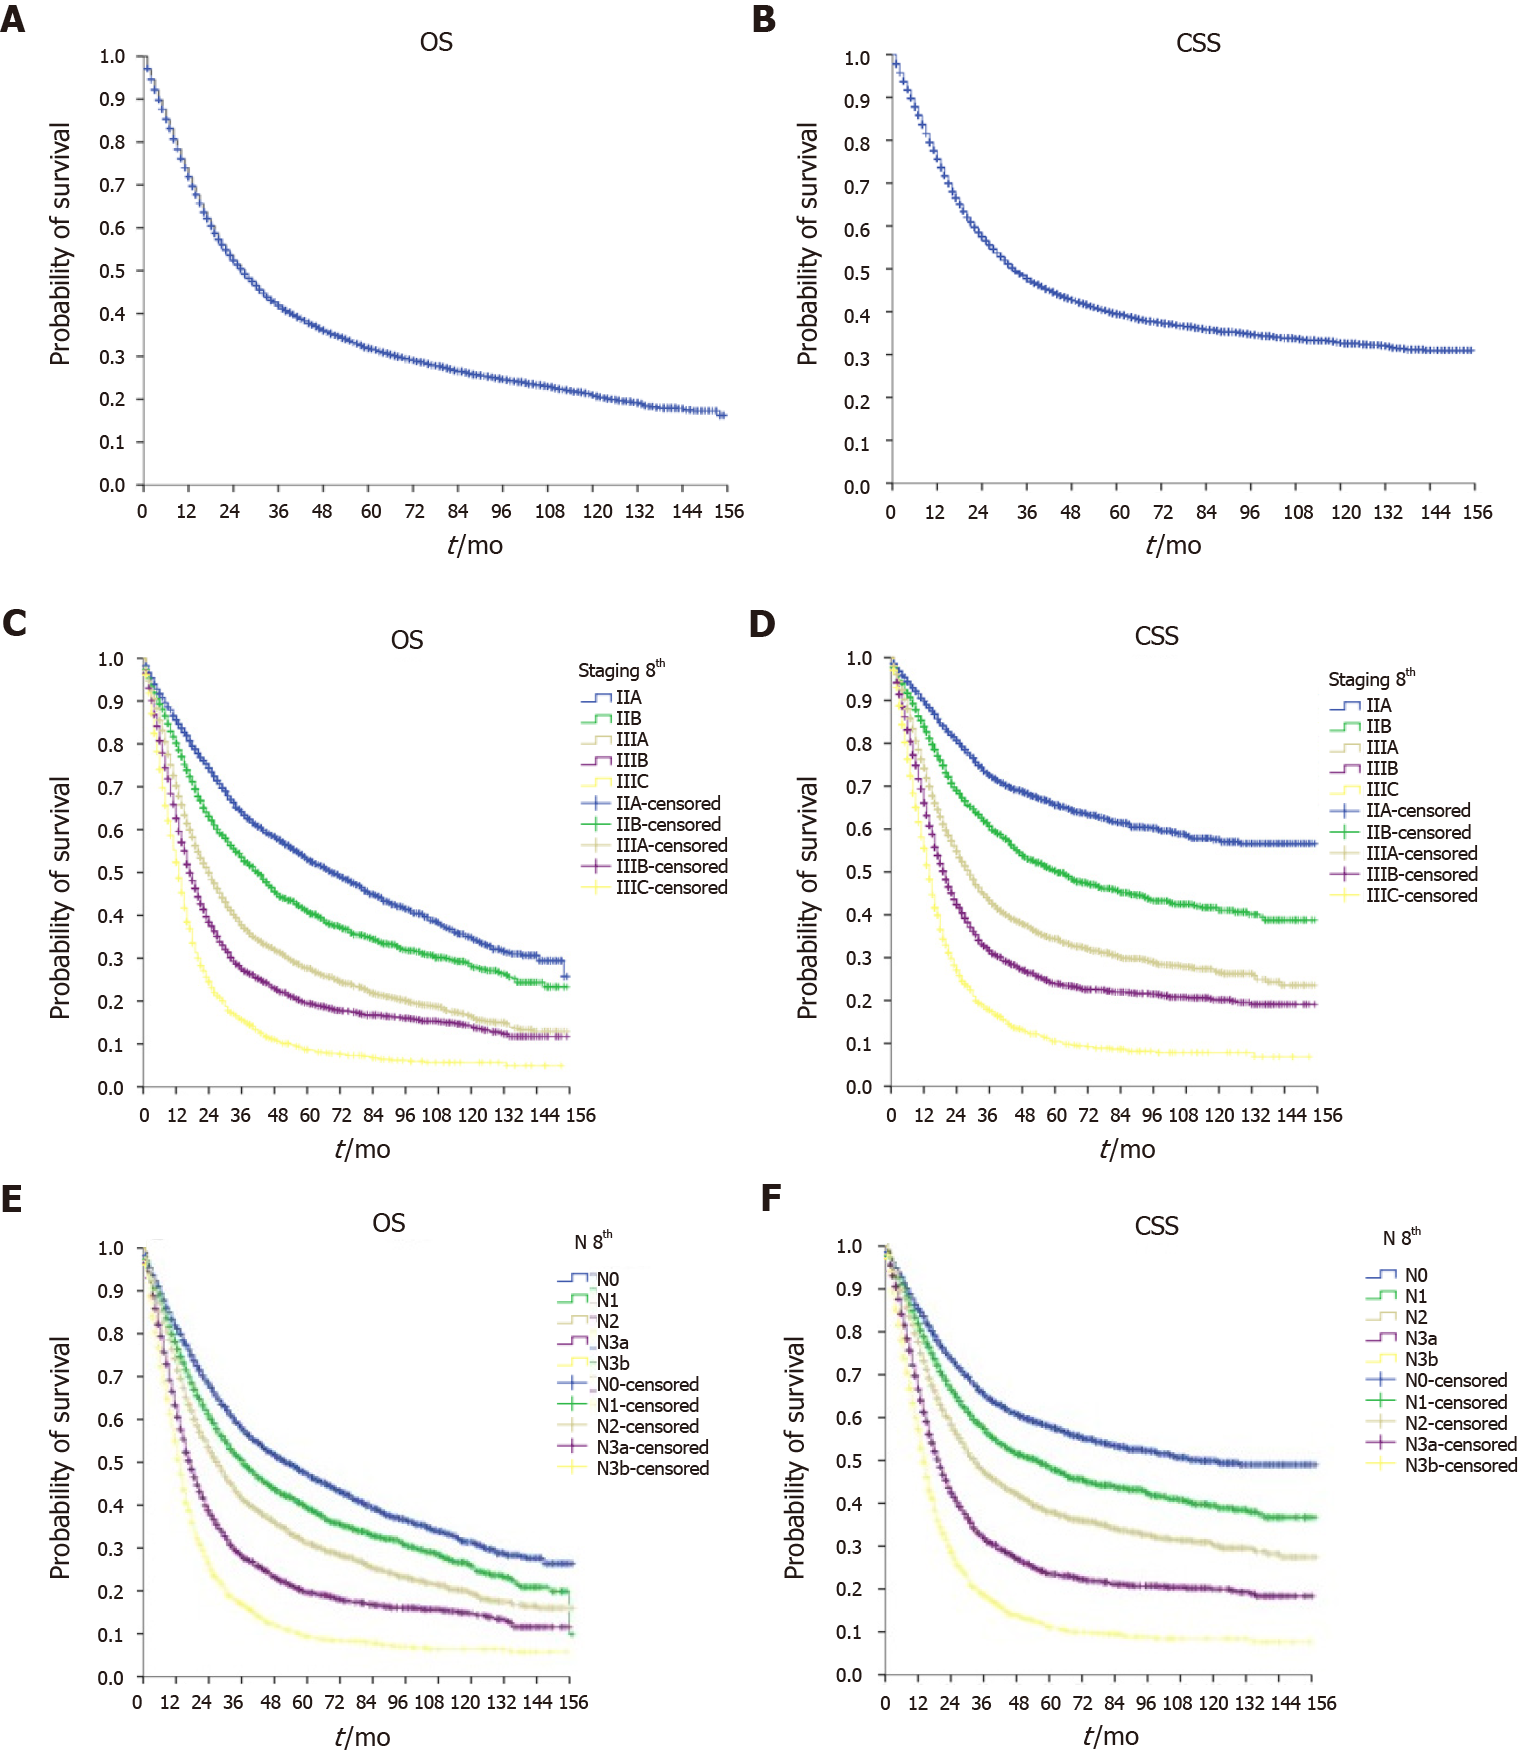
Figure 1 Survival analysis of the entire sample.
A and B: Kaplan-Meier curves of overall survival (OS) (A) and cancer-specific survival (CSS) (B); C and D: Kaplan-Meier curves of OS (C) and CSS (D) of different stages; E and F: Kaplan-Meier curves of OS (E) and CSS (F) based of different N categories.
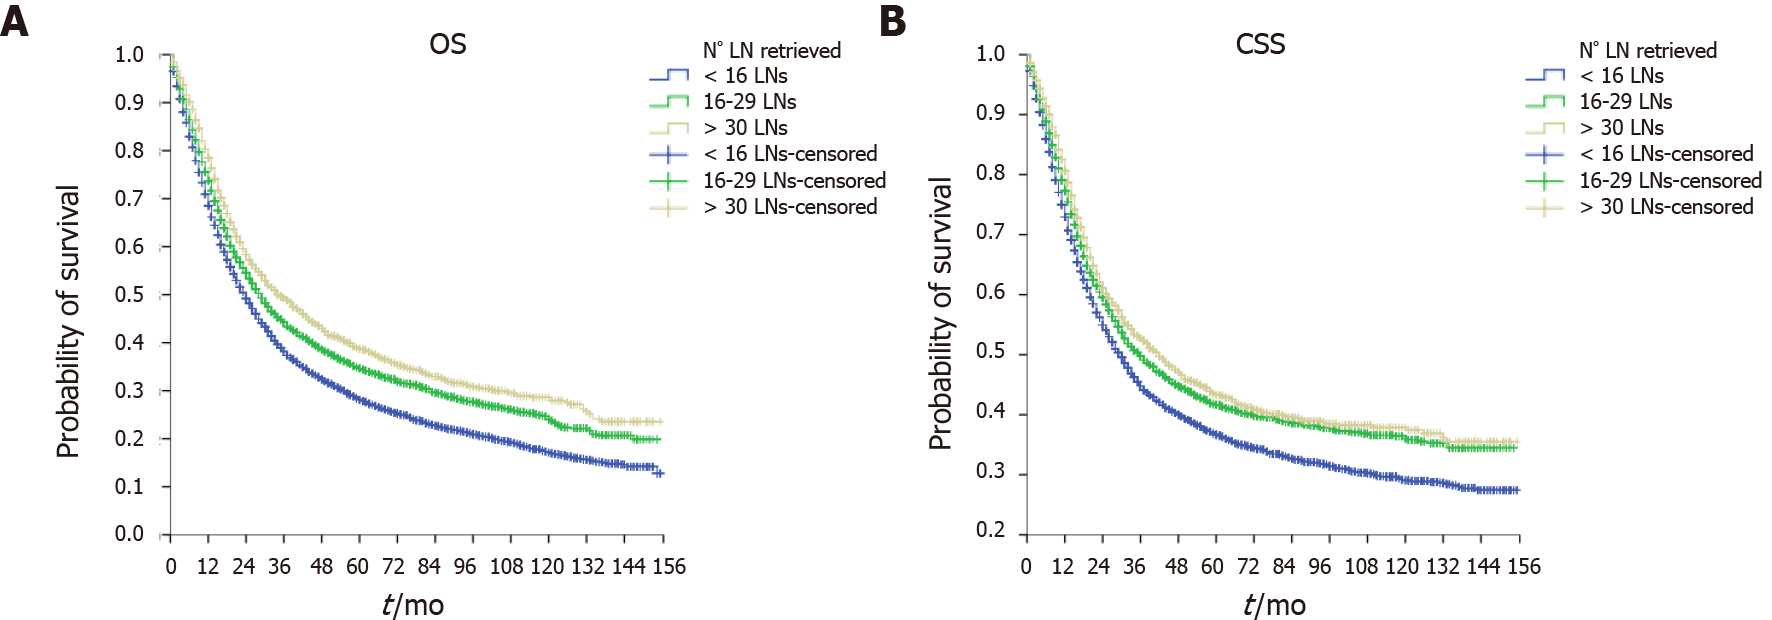
Figure 2 Comparison of the survival of patients with inadequate (< 16), adequate (16-29), and optimal (> 30) lymph node assessment.
Kaplan-Meier curves of A: Overall survival; B: Cancer-specific survival.
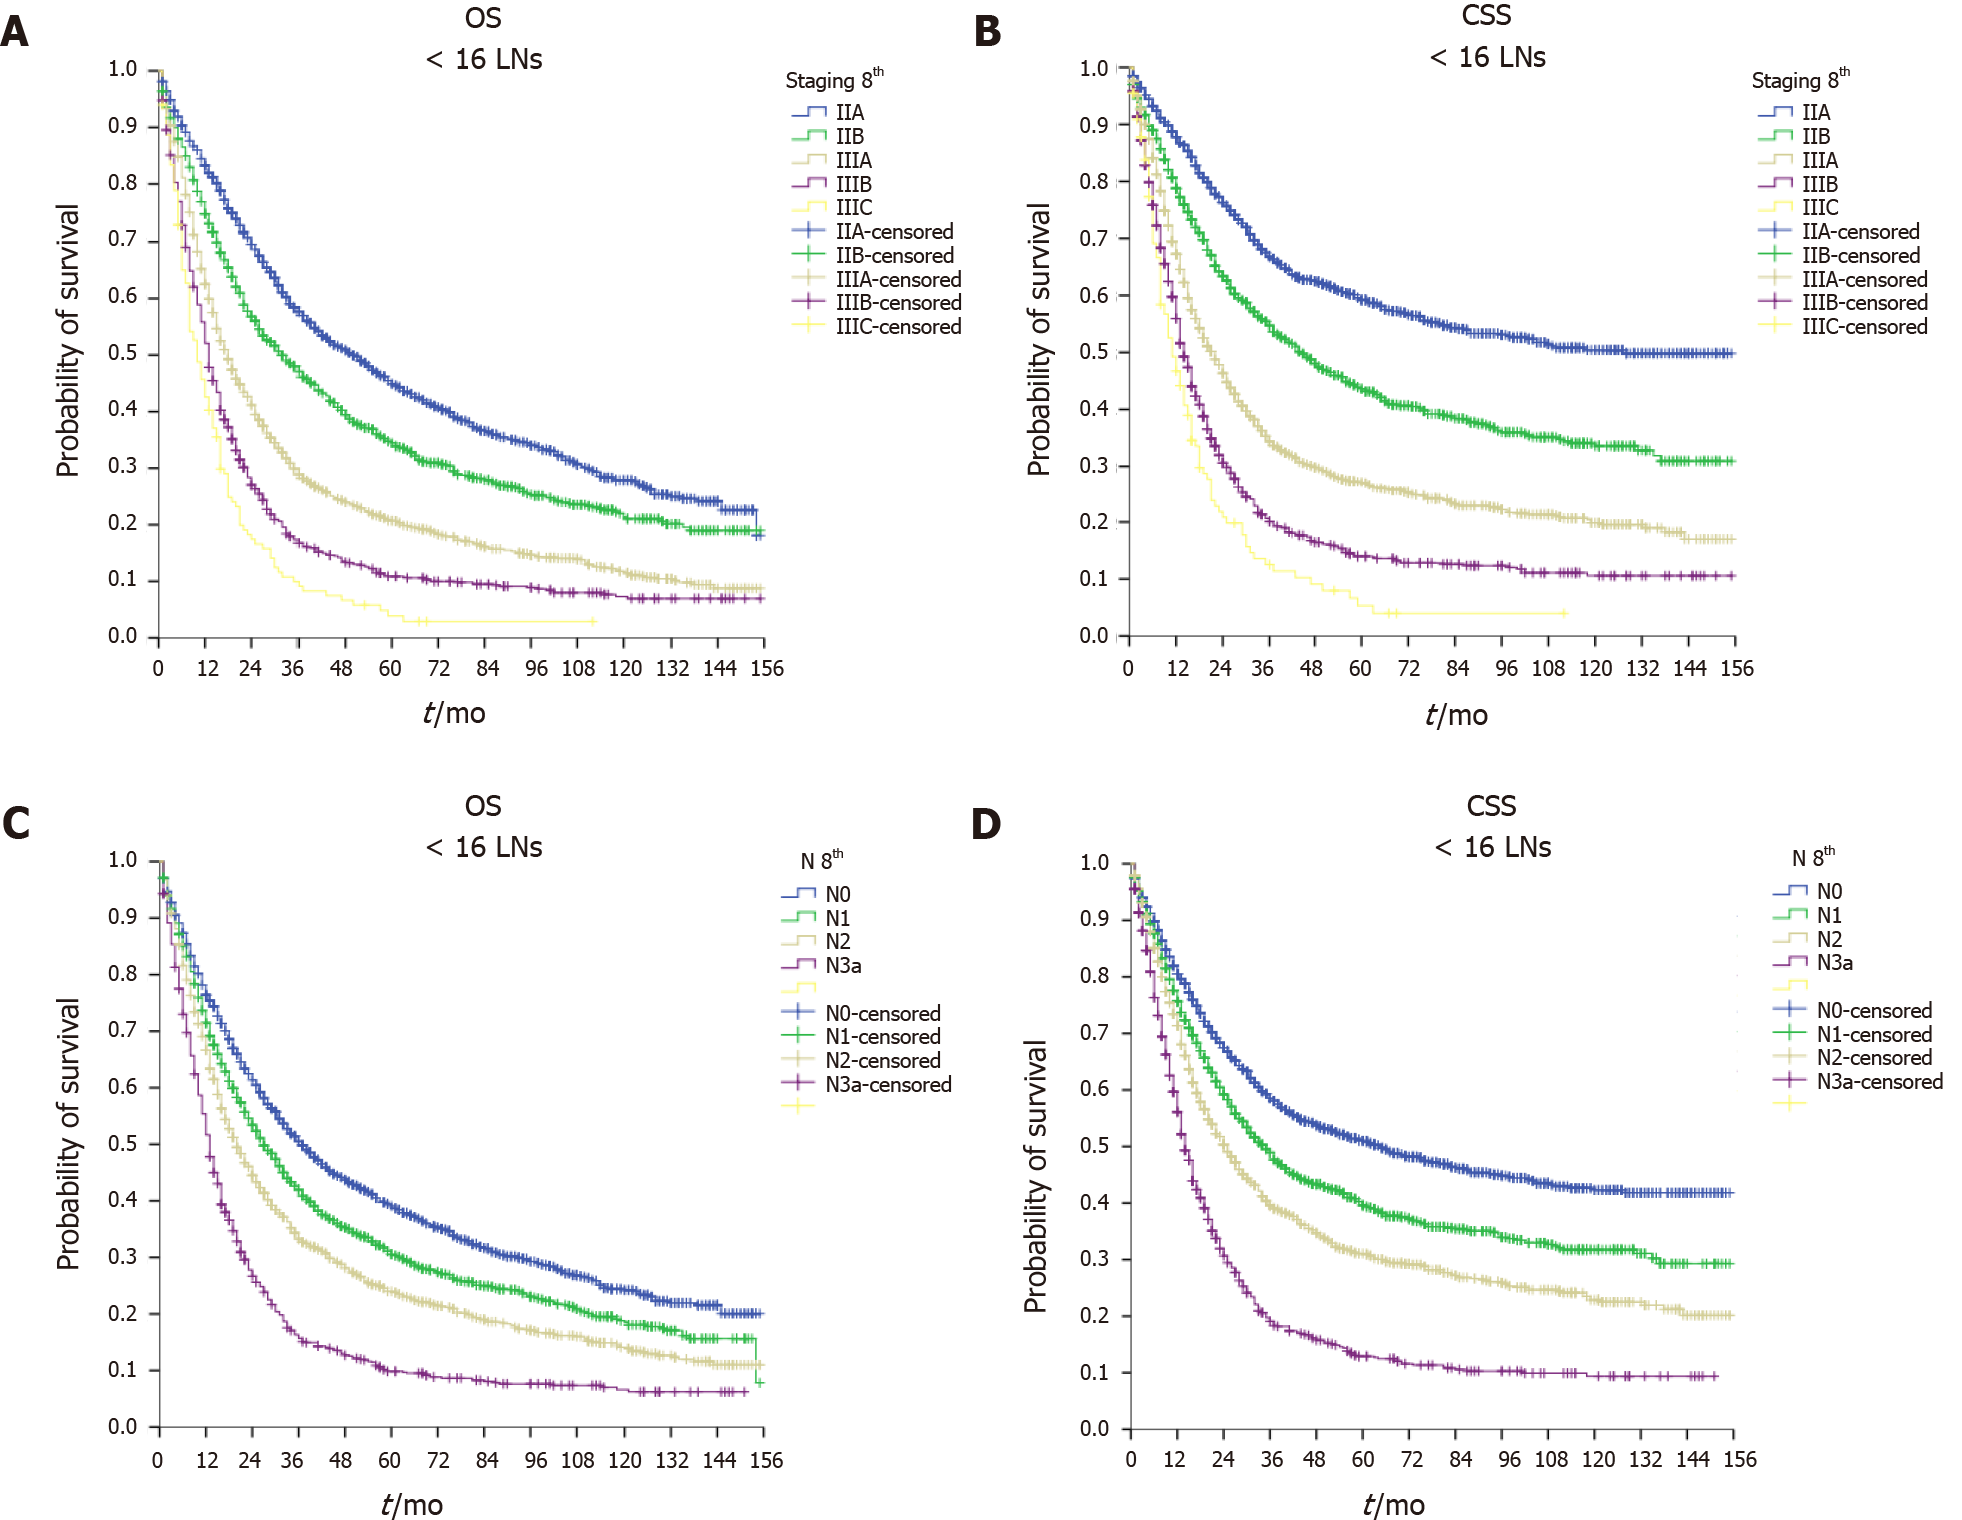
Figure 3 Analysis of survival of patients with inadequate lymph node assessment.
Kaplan-Meier curves of A: Overall survival (OS); B: Cancer-specific survival (CSS) based on stage; C and D: OS (C) and CSS (D) based on the N classification.
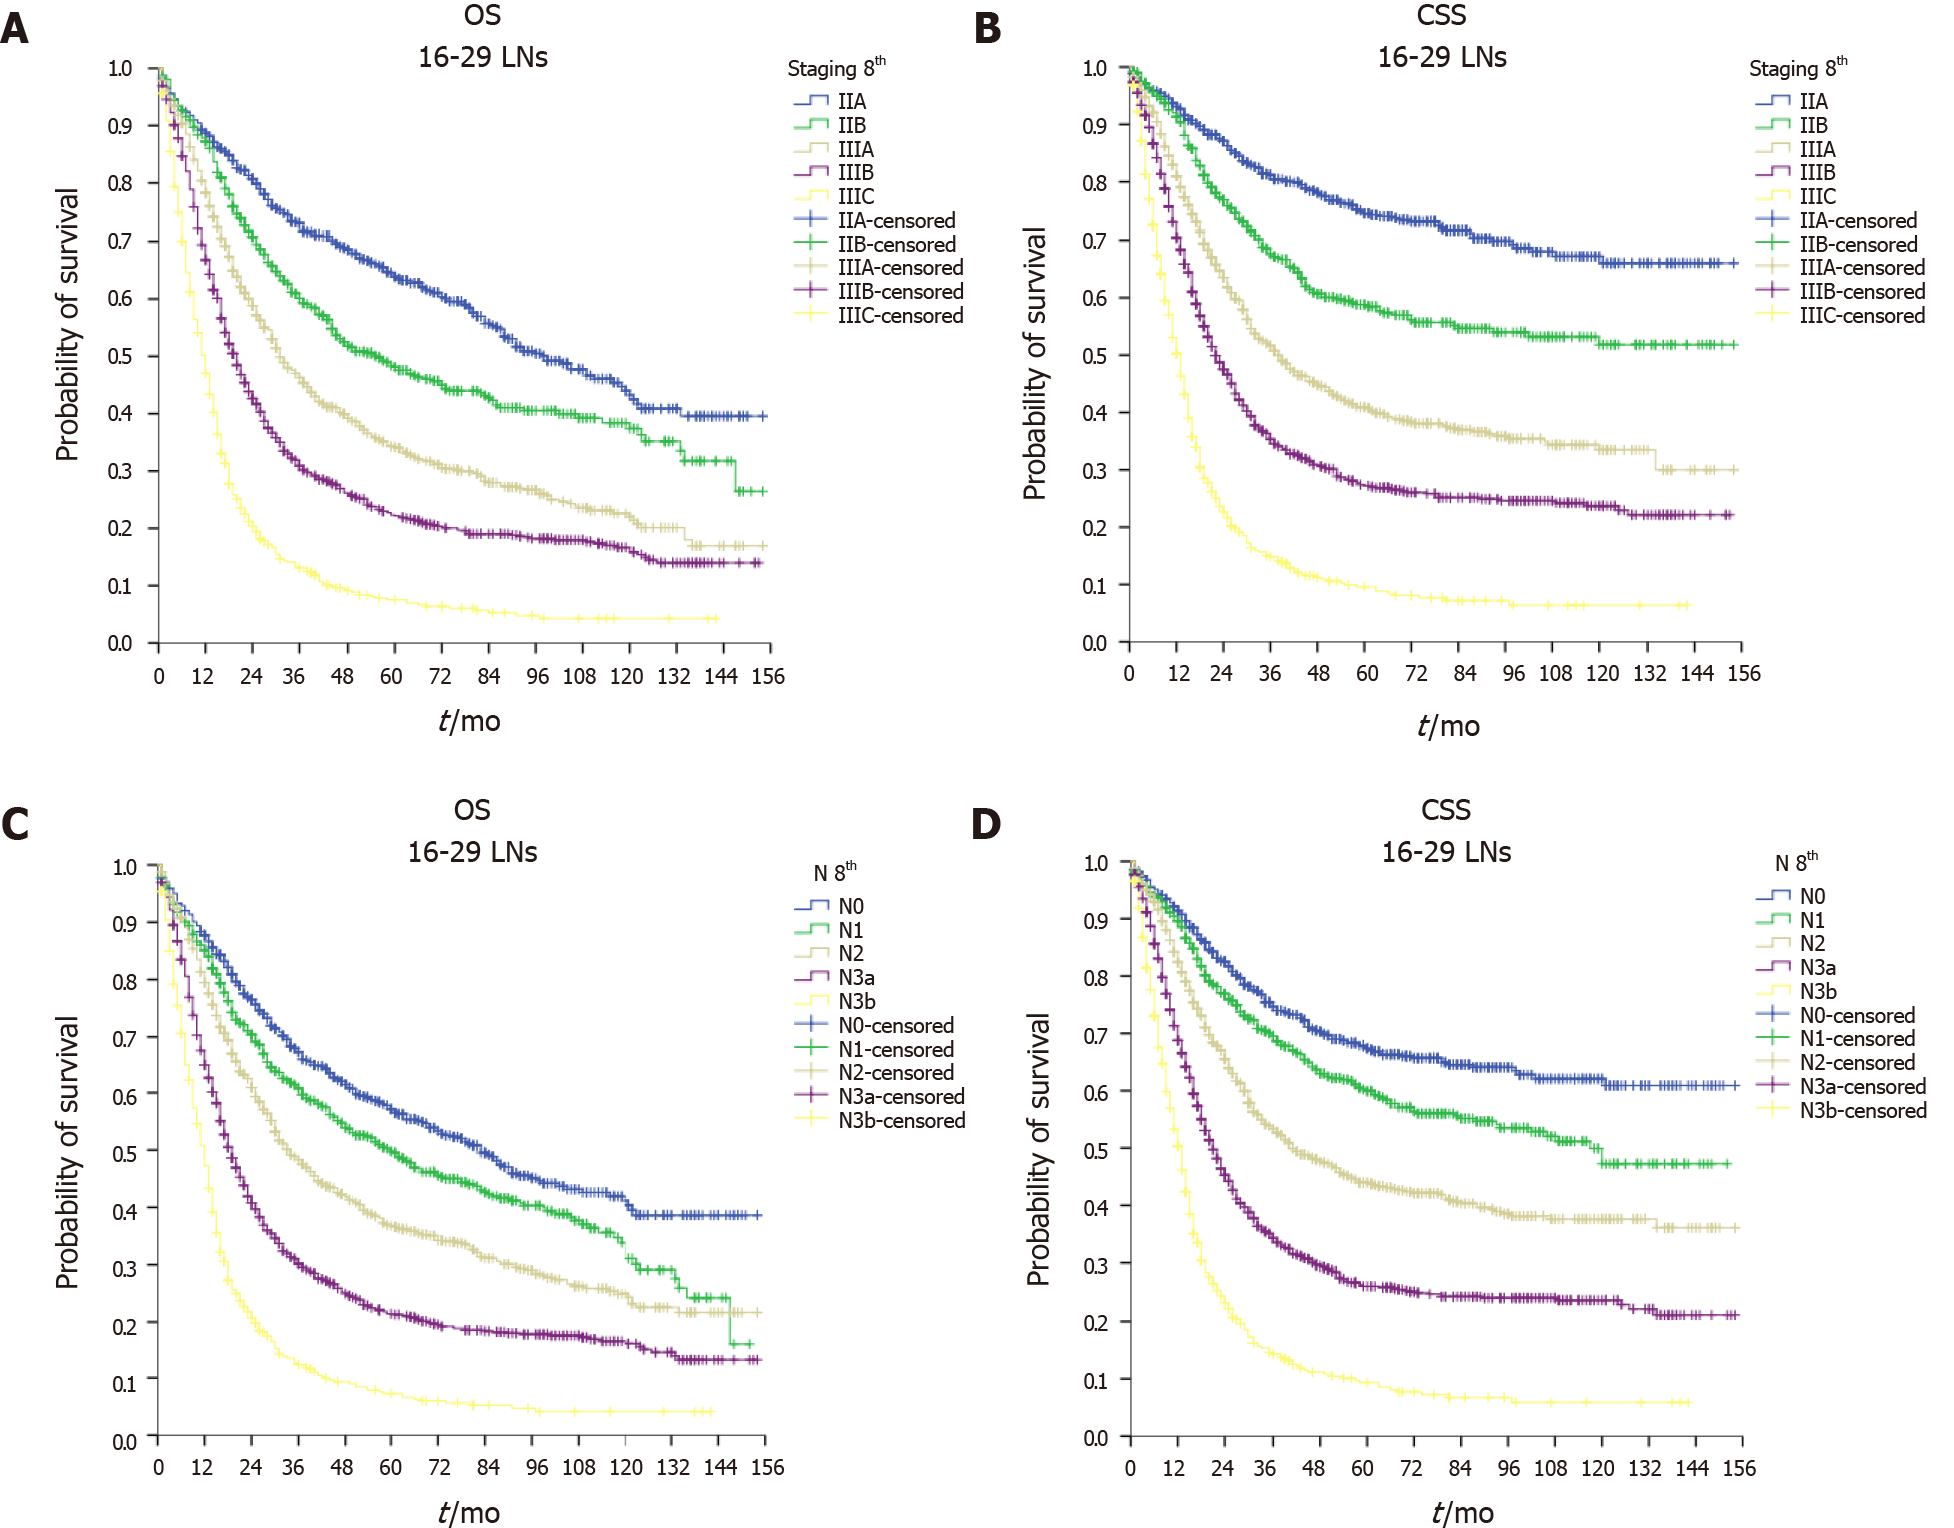
Figure 4 Analysis of survival of patients with lymph node assessment group.
Kaplan-Meier curves of A: Overall survival (OS); B: Cancer-specific survival (CSS) based on stages; C and D: OS (C) and CSS (D) based on the N classification.
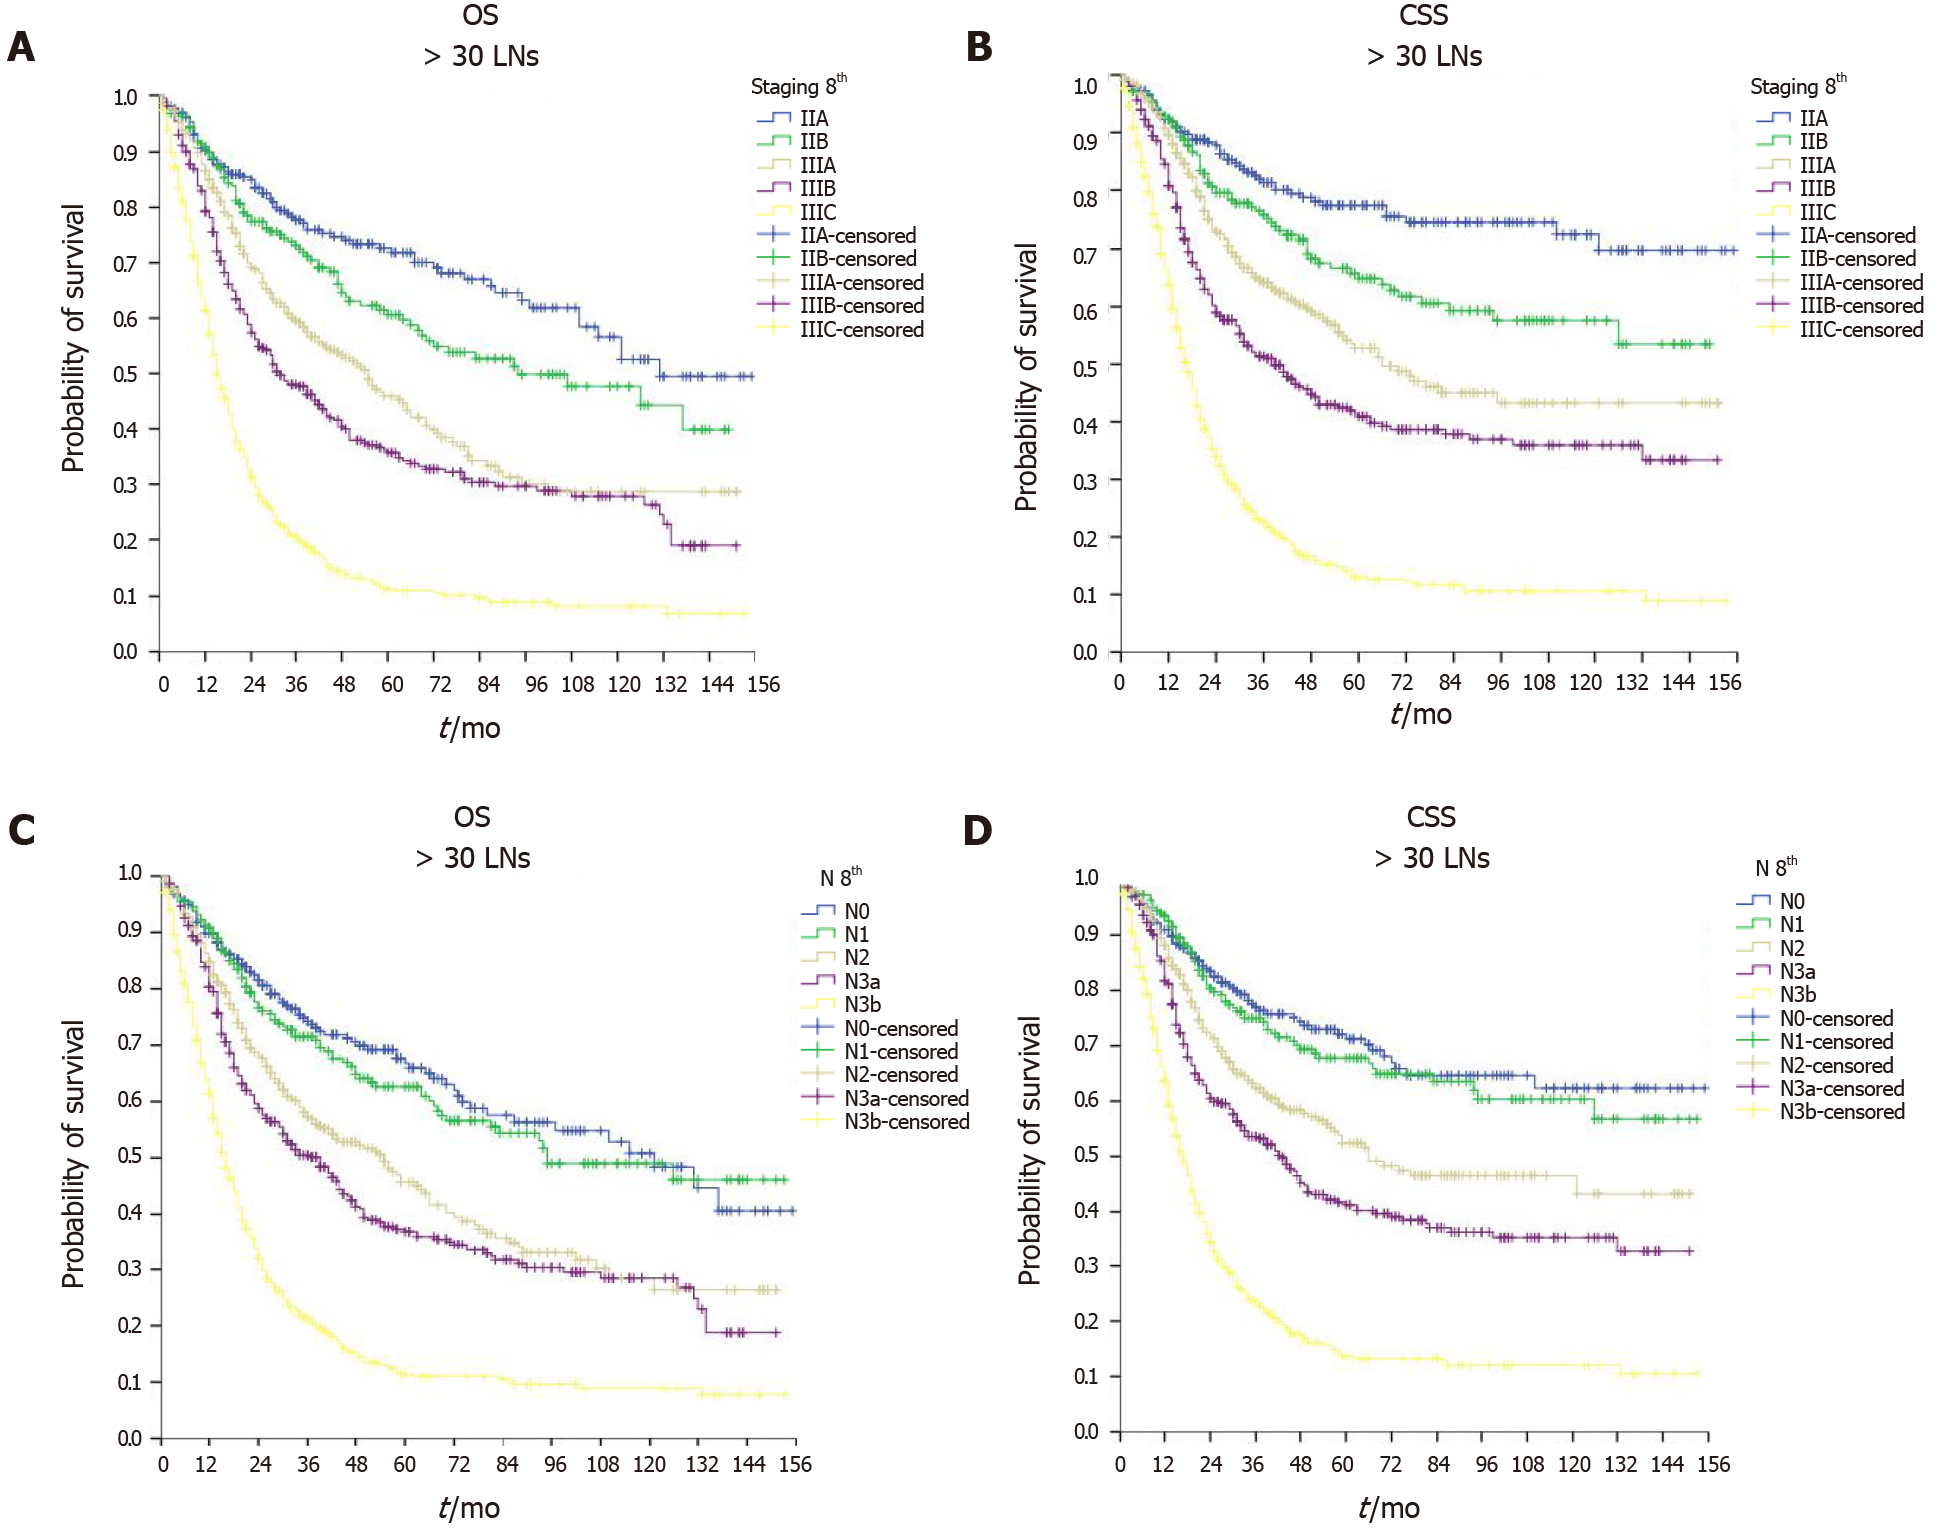
Figure 5 Analysis of survival of patients with optimal lymph node assessment.
Kaplan-Meier curves of A: Overall survival (OS); B: Cancer-specific survival (CSS) based on stage; C: OS; D: CSS based on the N category.
- Citation: Desiderio J, Sagnotta A, Terrenato I, Garofoli E, Mosillo C, Trastulli S, Arteritano F, Tozzi F, D'Andrea V, Fong Y, Woo Y, Bracarda S, Parisi A. Long-term survival of patients with stage II and III gastric cancer who underwent gastrectomy with inadequate nodal assessment. World J Gastrointest Surg 2021; 13(11): 1463-1483
- URL: https://www.wjgnet.com/1948-9366/full/v13/i11/1463.htm
- DOI: https://dx.doi.org/10.4240/wjgs.v13.i11.1463


