Copyright
©The Author(s) 2020.
World J Gastrointest Surg. Nov 27, 2020; 12(11): 442-459
Published online Nov 27, 2020. doi: 10.4240/wjgs.v12.i11.442
Published online Nov 27, 2020. doi: 10.4240/wjgs.v12.i11.442
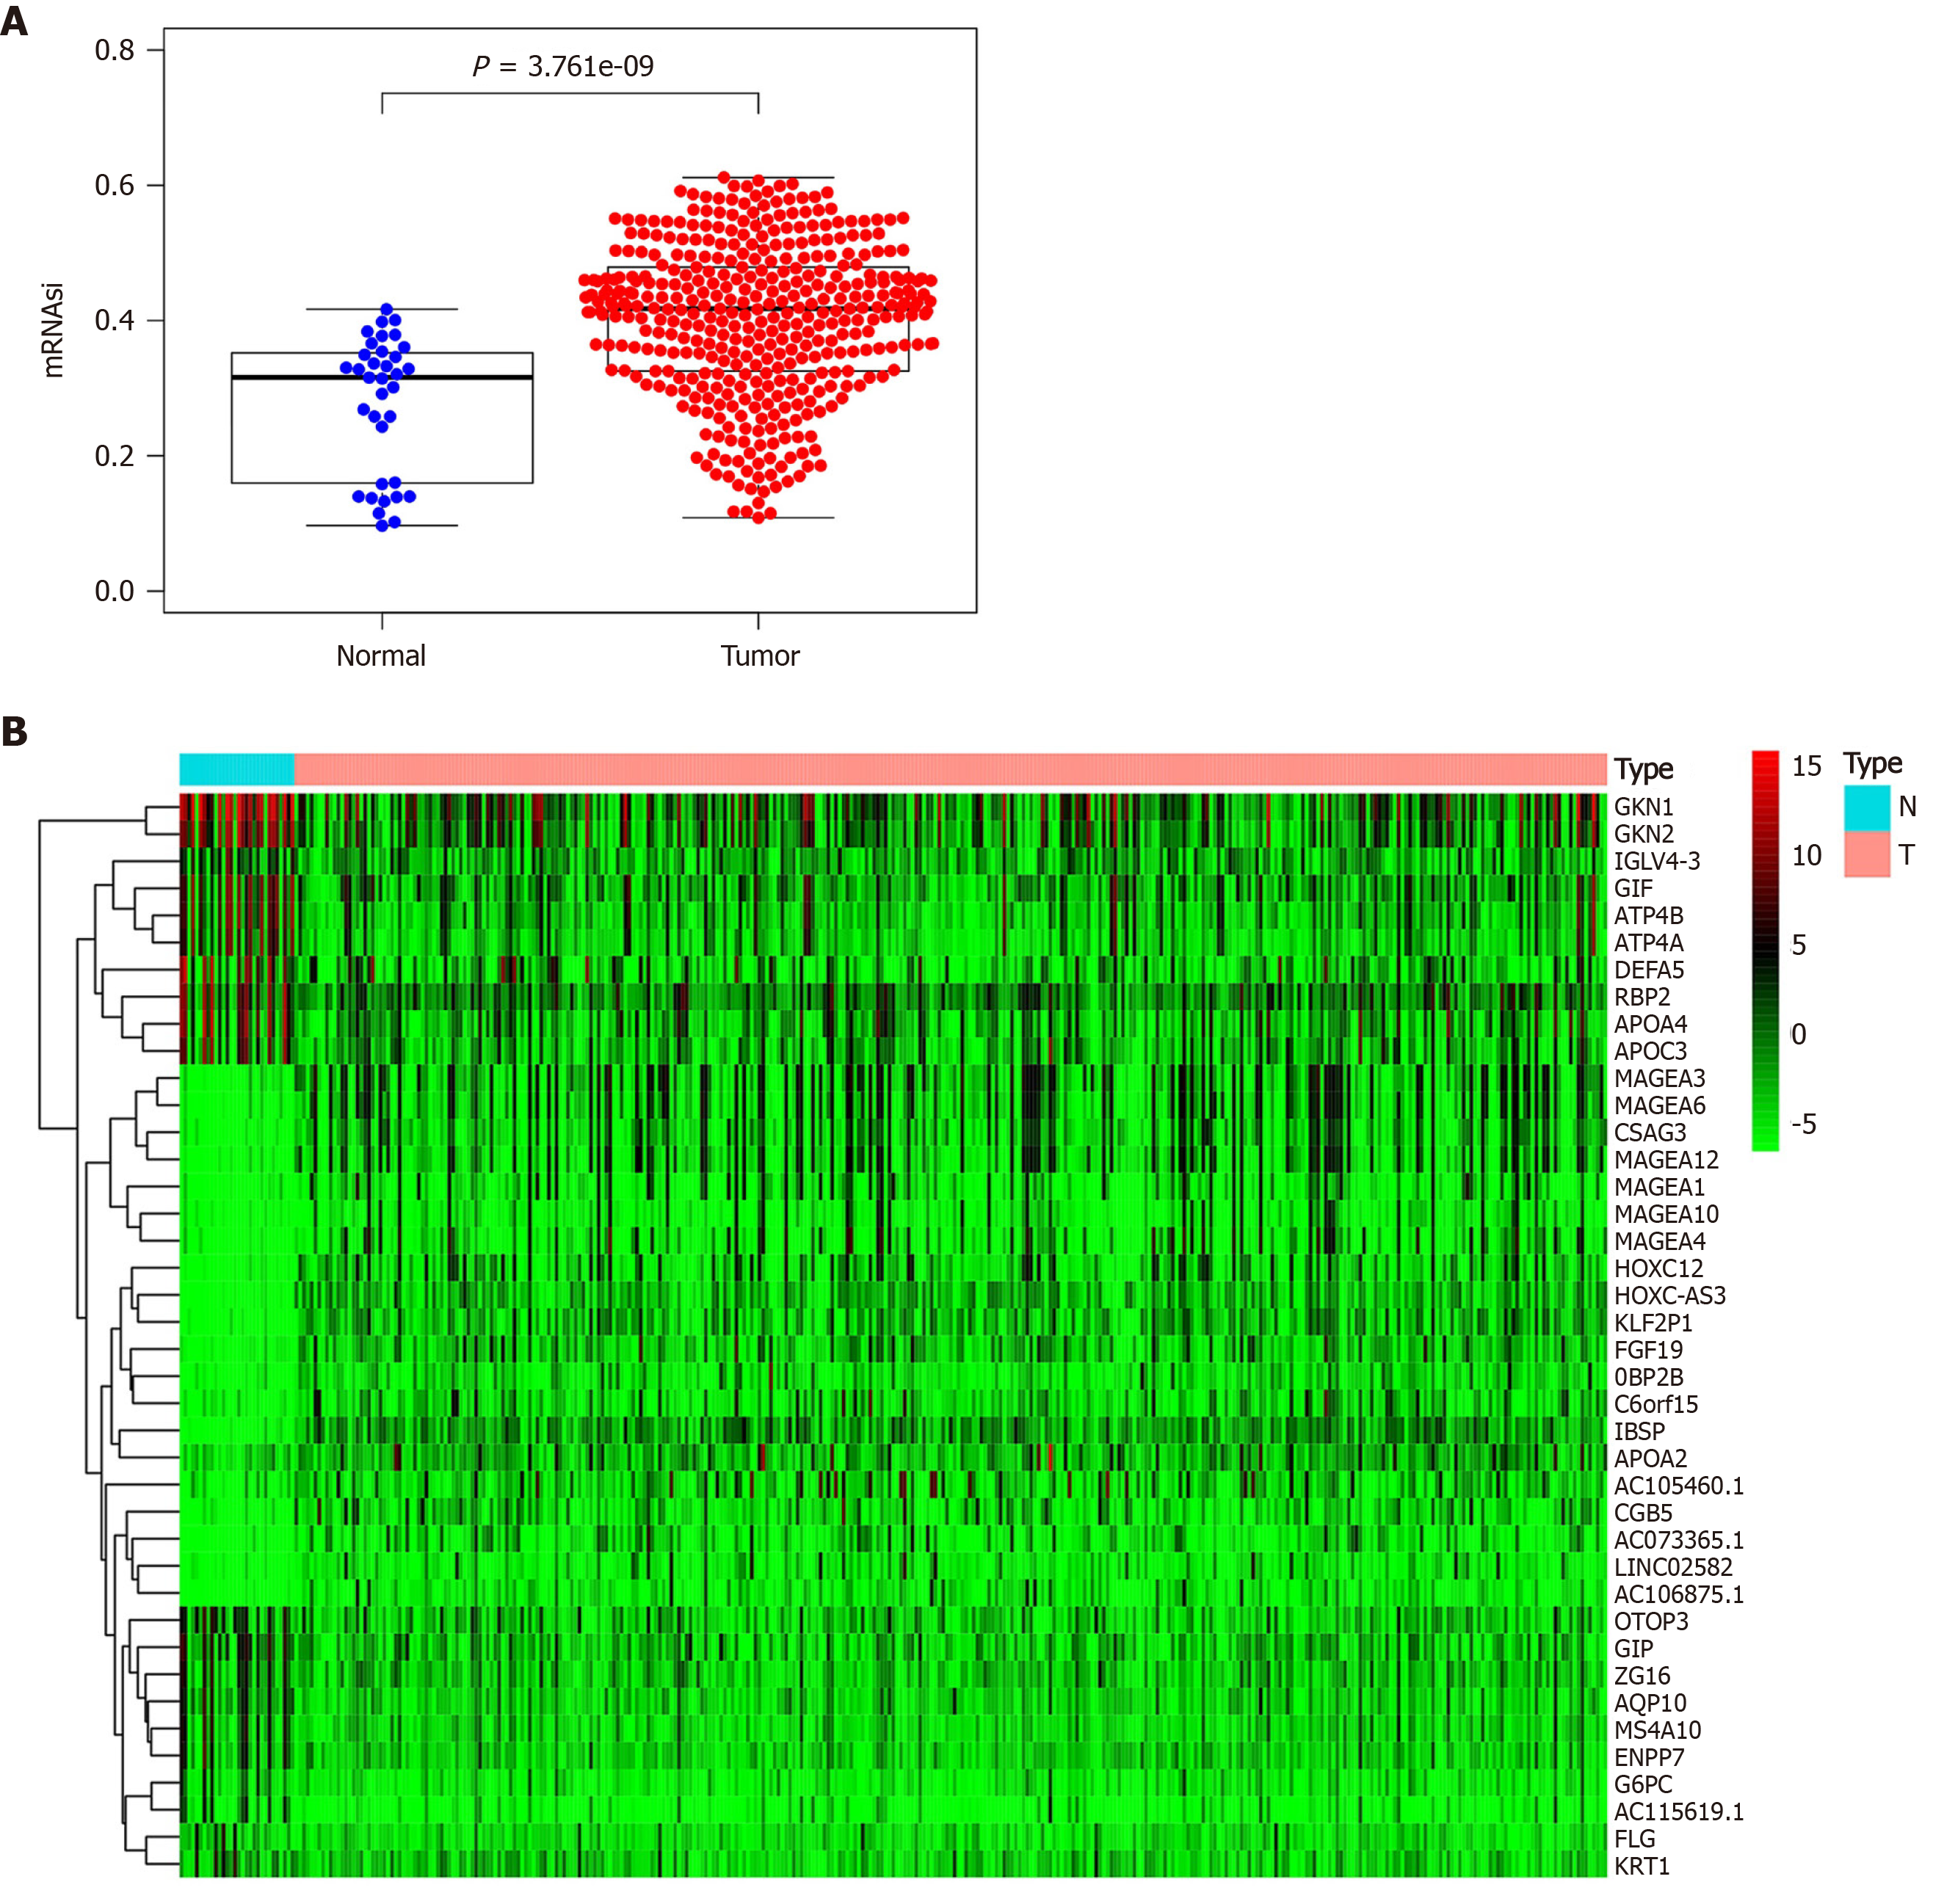
Figure 1 Differential analysis of mRNA expression-based stemness index and screening of differentially expressed genes.
A: Expression of mRNA expression-based stemness index in gastric tumor tissues and normal gastric tissues; B: Significantly differentially expressed genes in gastric tumor tissues and normal gastric tissues.
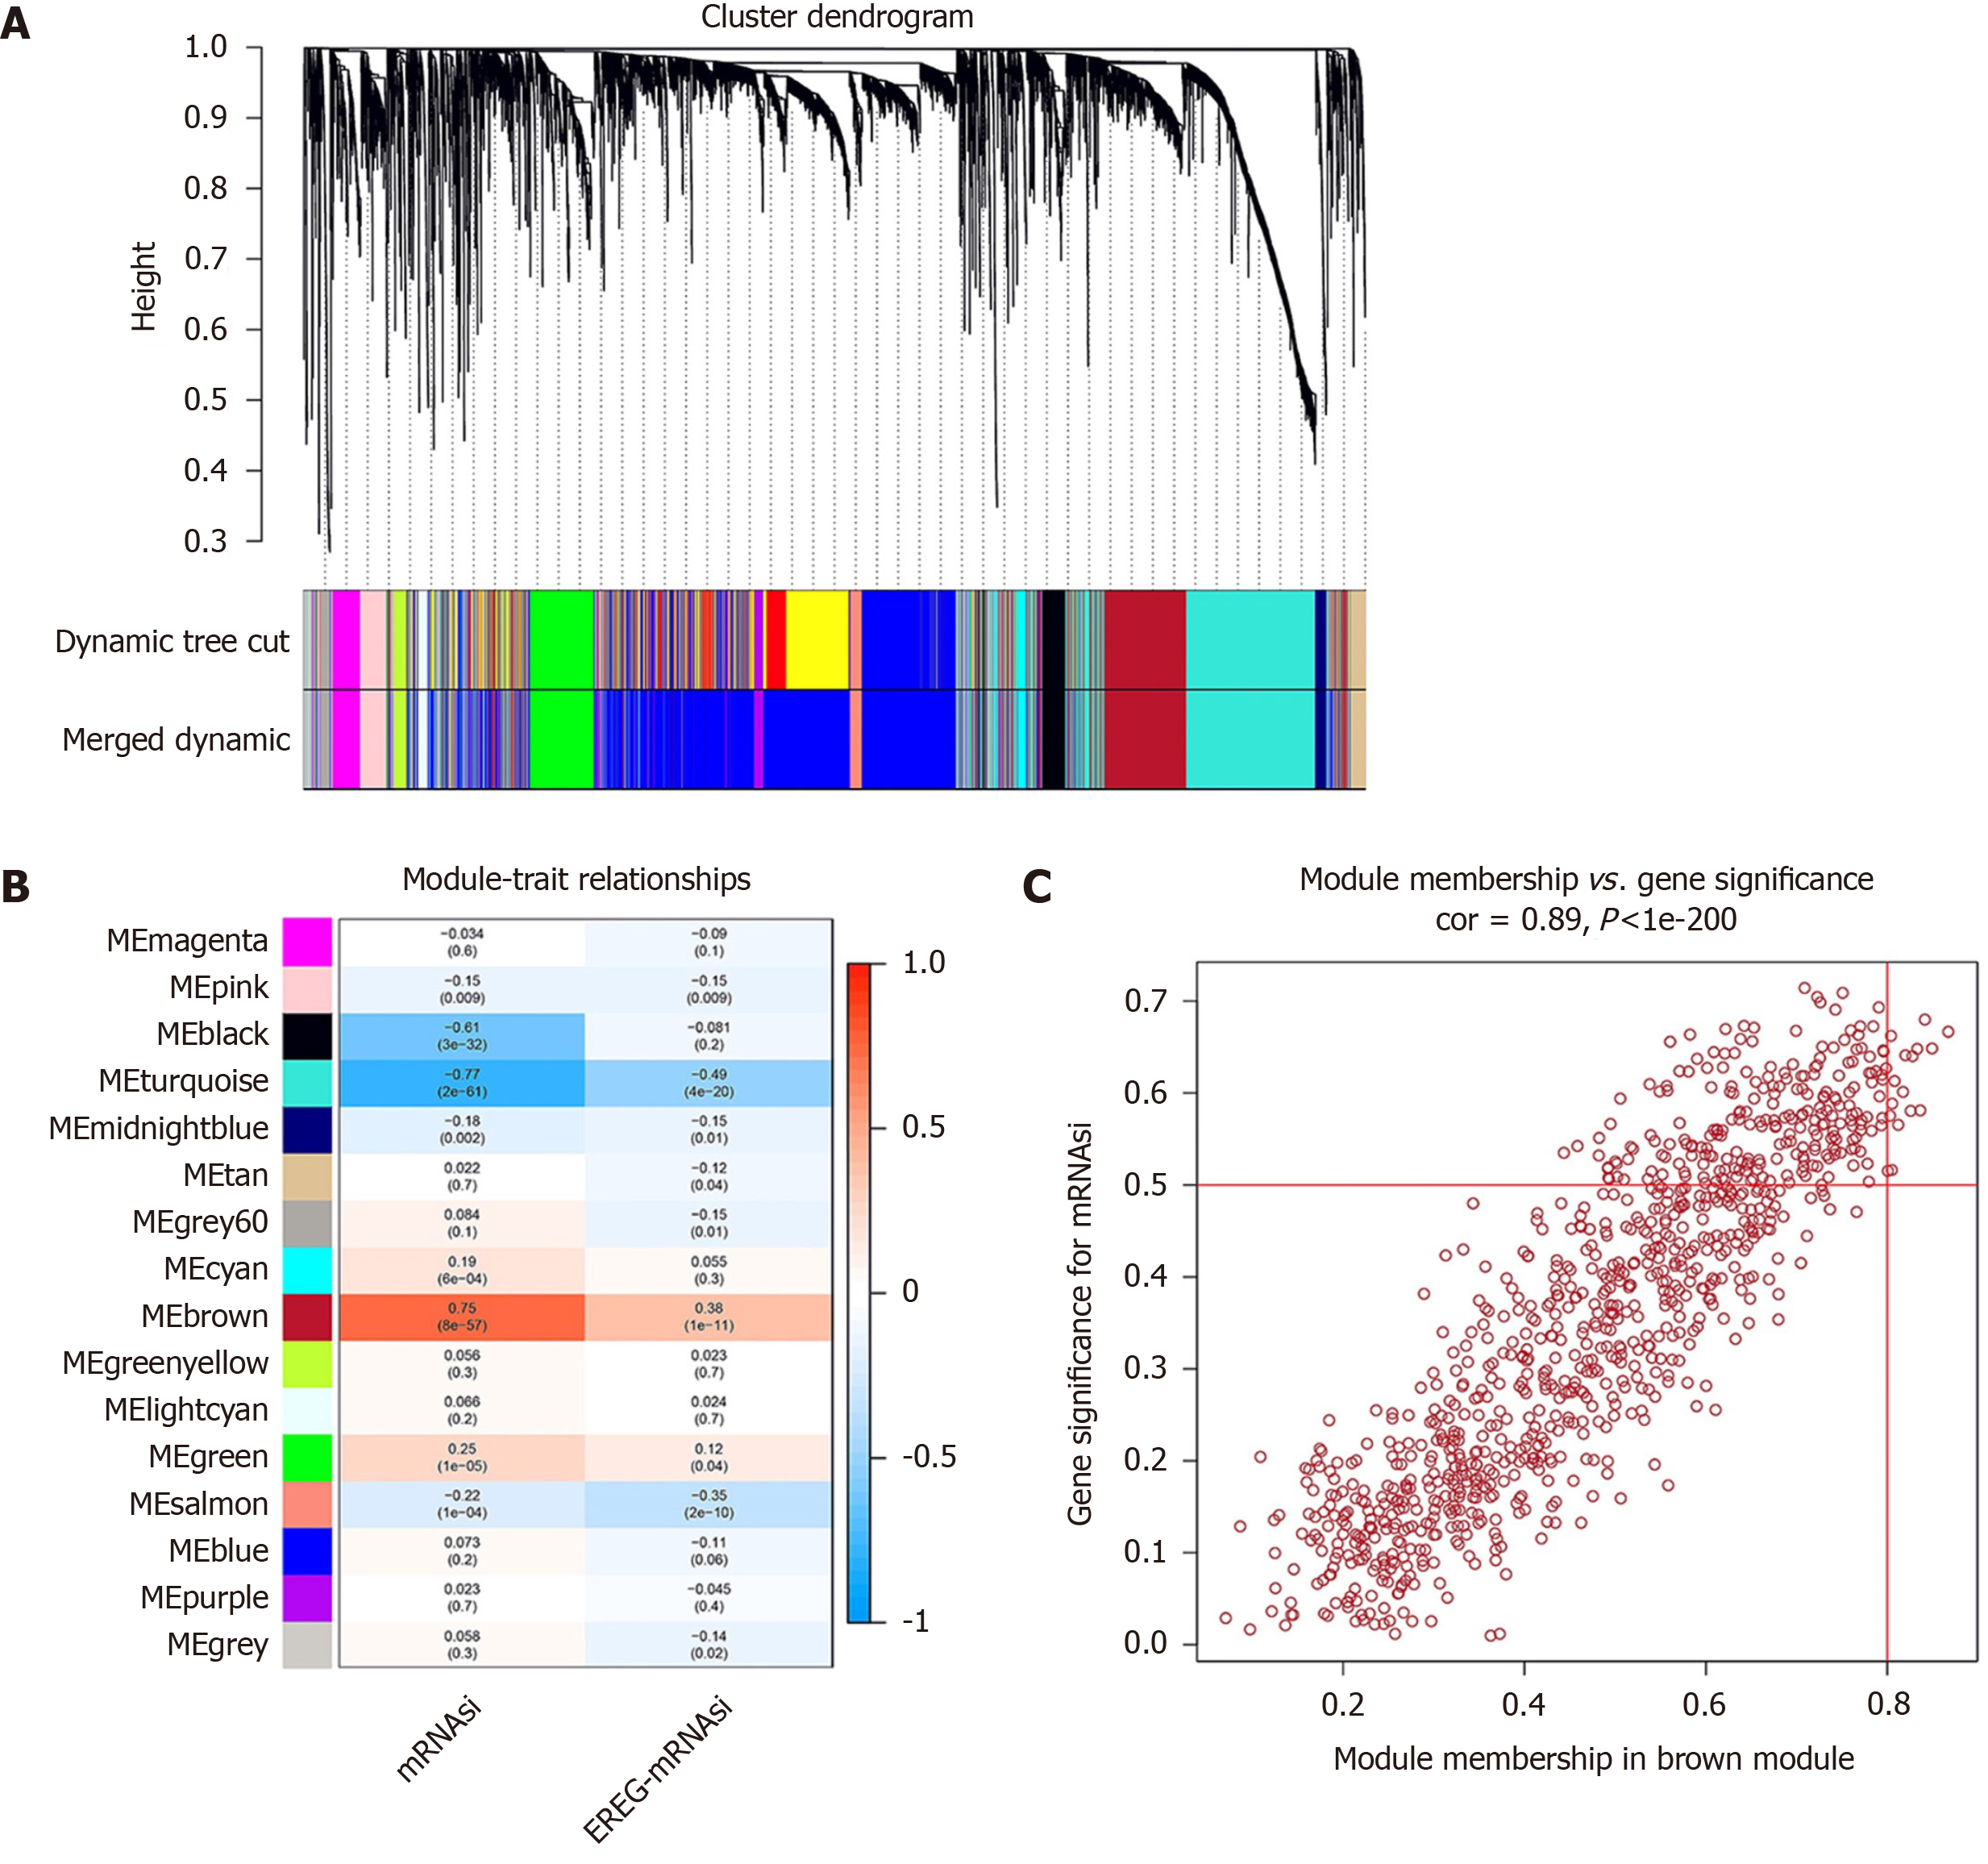
Figure 2 Weighted gene coexpression network analysis.
A: Clustering dendrograms of differentially expressed genes. Each piece of the leaves on the cluster dendrogram corresponds to a gene. The first color band indicates the modules detected by dynamic tree cut methods. The second color band indicates the modules after merging similar modules; B: Correlation between the gene module and mRNA expression-based stemness index (mRNAsi). The correlation coefficient in each cell represents the correlation between the gene module and mRNAsi, which increases in size from blue to red. The corresponding P value is also annotated; C: Scatter plot of module eigengenes in brown. The top right corner is where the key genes are located.
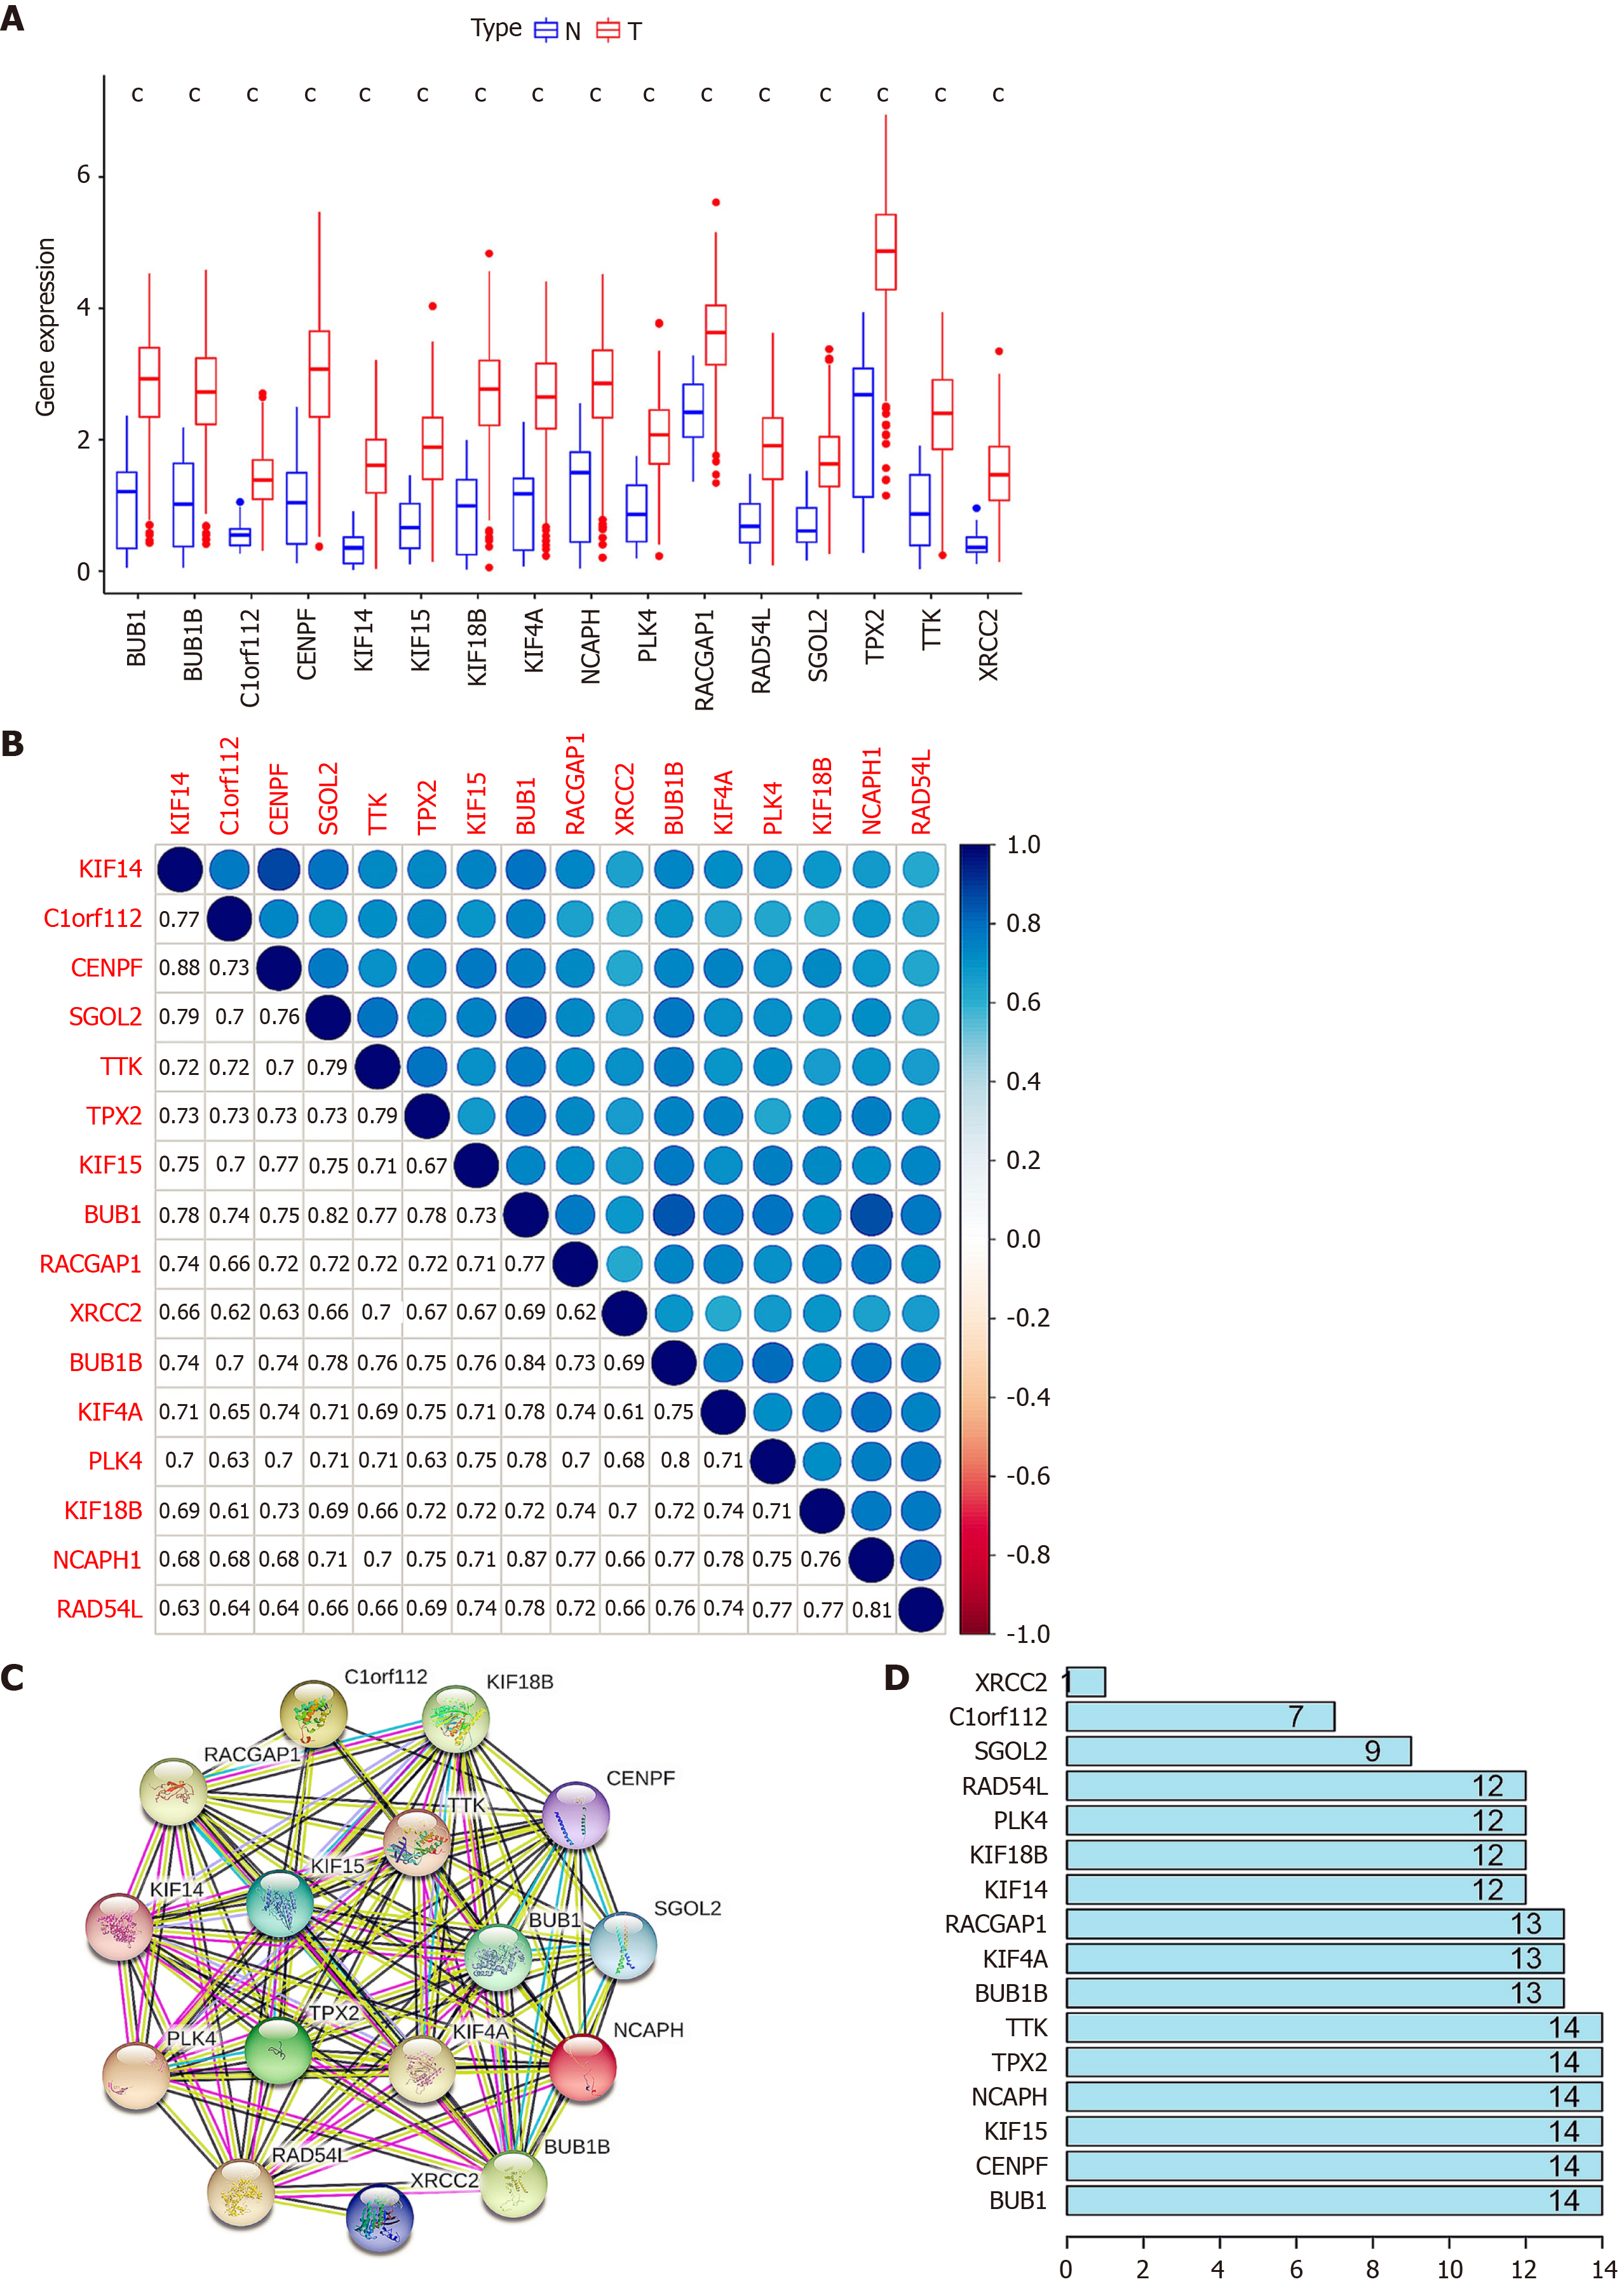
Figure 3 Analysis of key genes.
A: Expression of the key genes in gastric tumor tissues and normal gastric tissues. The red histogram indicates gastric tumor tissue. The blue histogram indicates normal gastric tissue. cP < 0.001; B: Correlation of key genes. The number in the box represents the size of the correlation, and the larger the number, the higher the correlation; C: Protein-protein interaction networks of key genes. The color of the lines represents the source of the evidence; D: Connection nodes of key genes. The number represents the number of connection nodes.
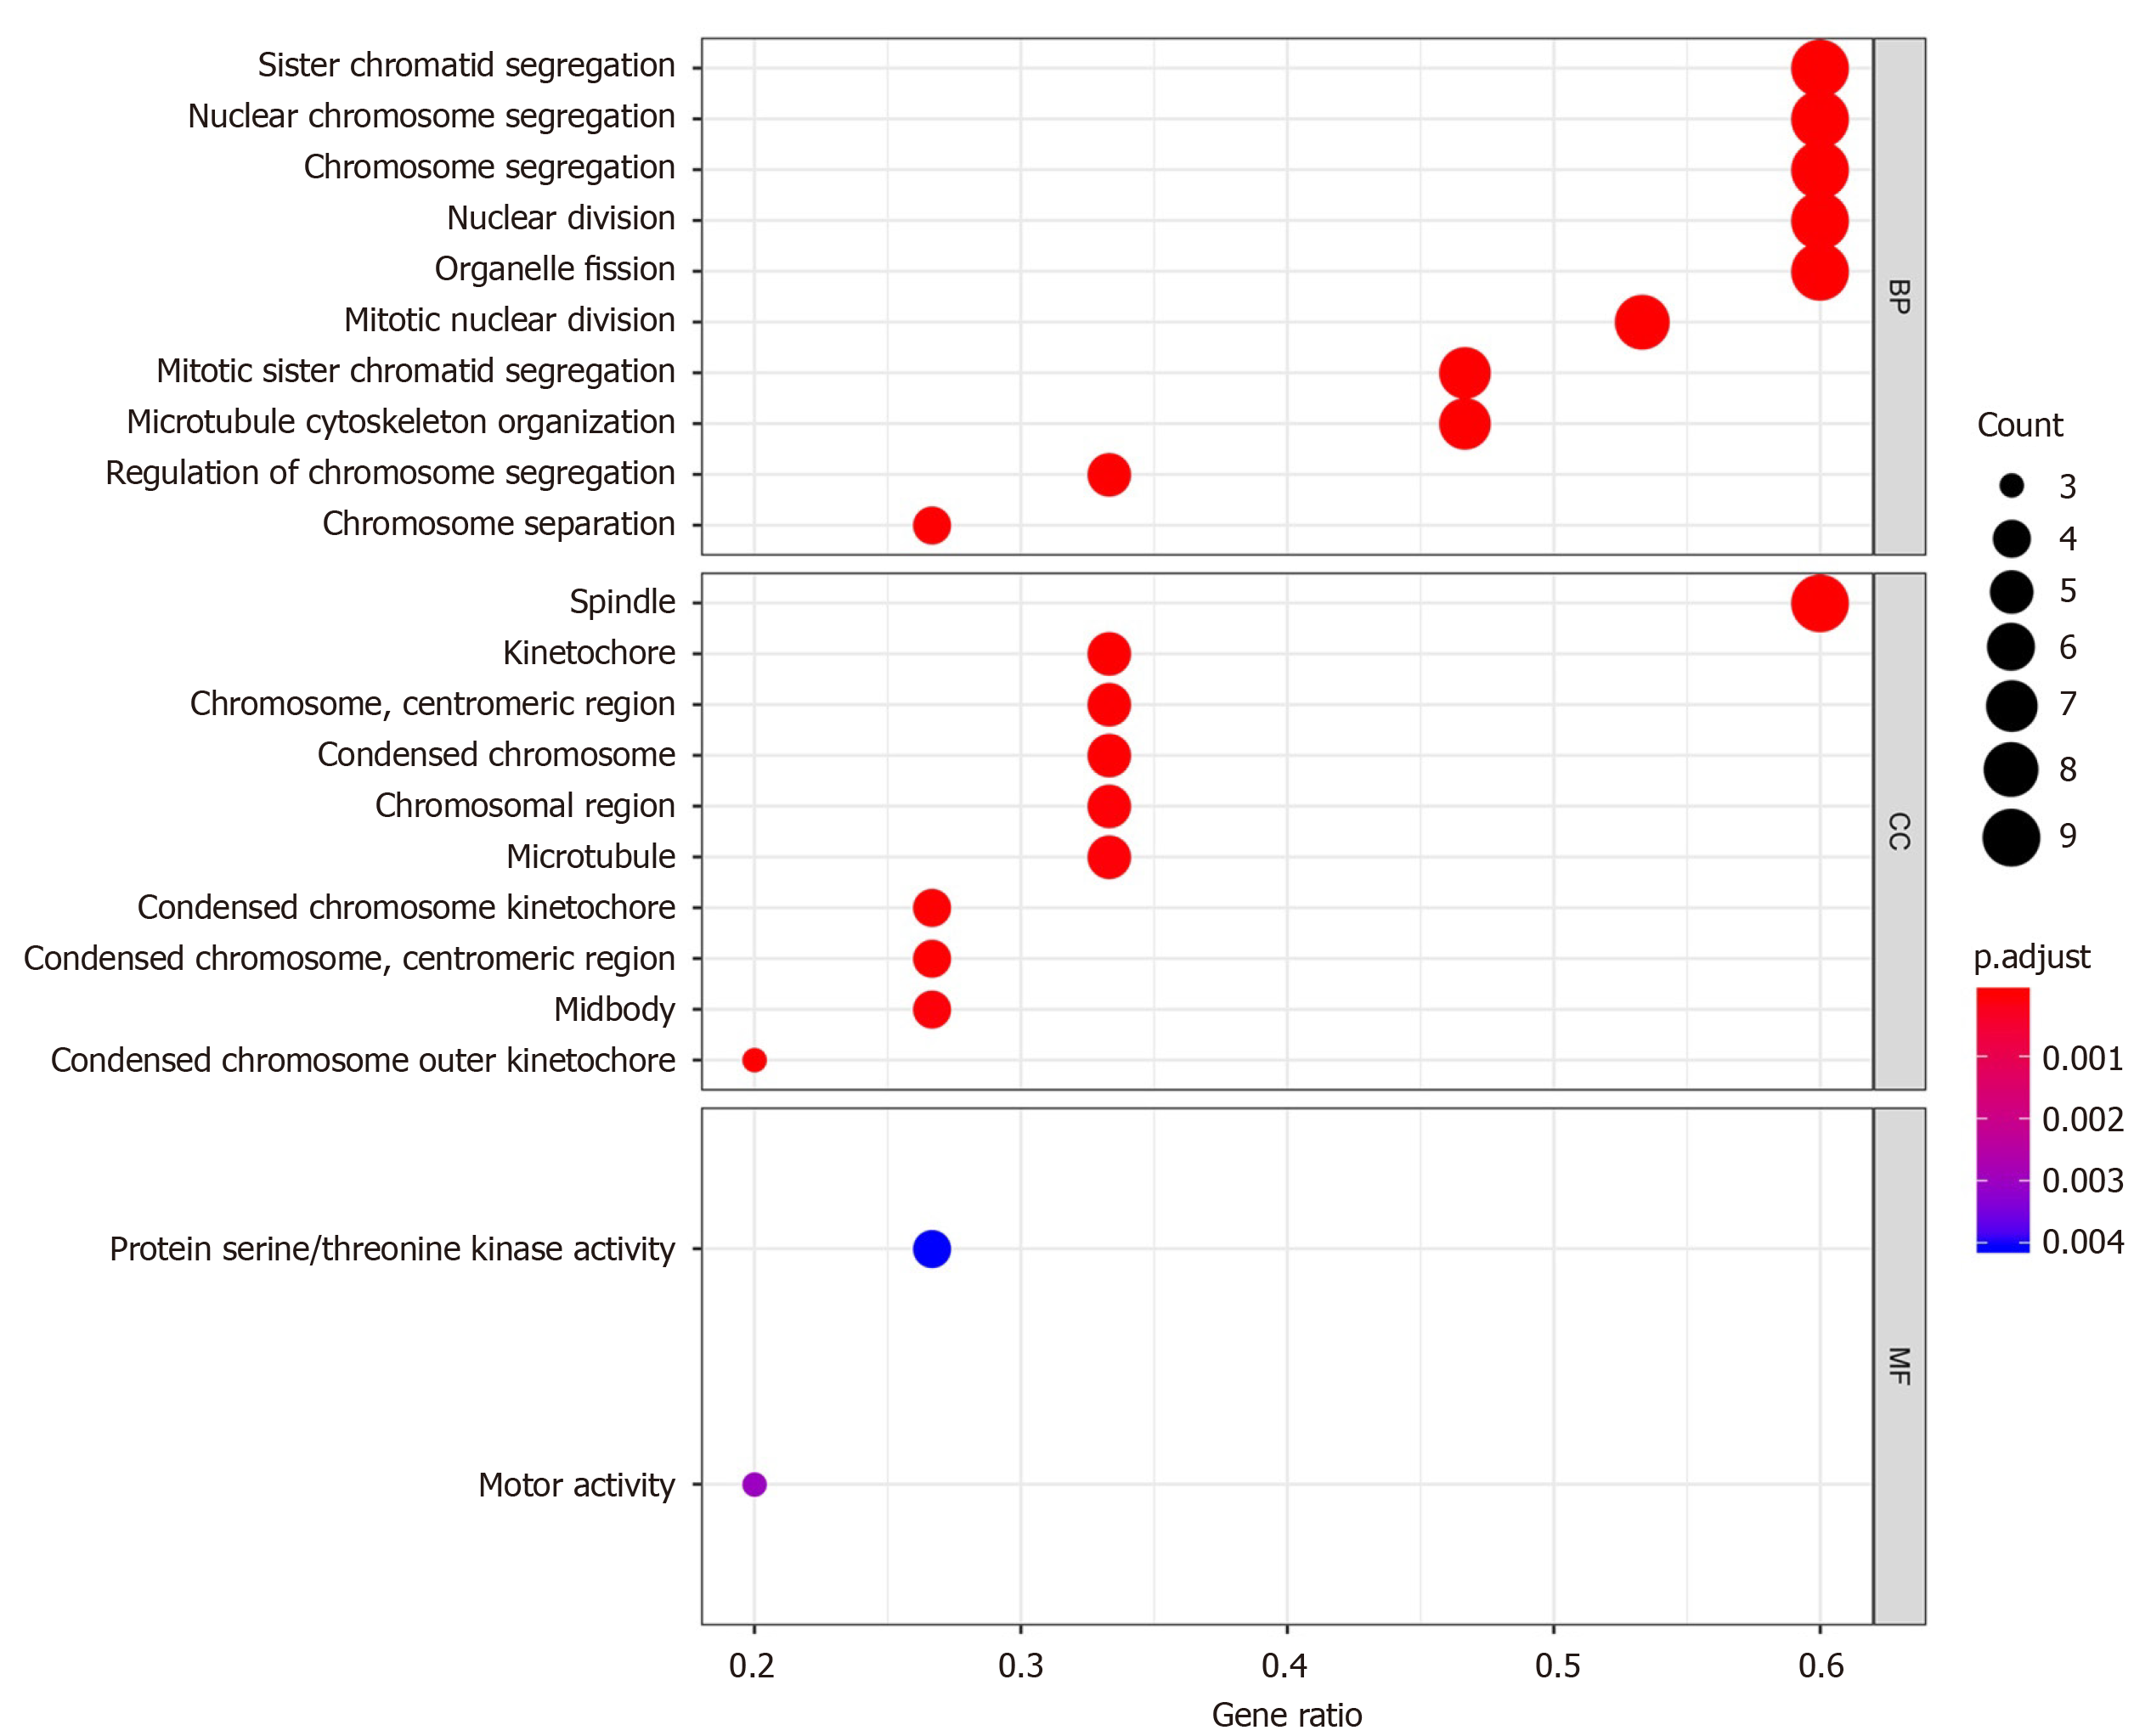
Figure 4 Significantly enriched gene ontology biological process terms.
The larger the circle, the more number of enrichment, and the redder the color, the more significant the difference. BP: Biological process; CC: Cell component; MF: Molecular function.
Figure 5 Survival curves of key genes using the online tool Kaplan-Meier Plotter.
The red indicates high expression and black indicates low expression. A log-rank P < 0.05 was considered statistically significant.
Figure 6 Expression of key genes in gastric cancer based on the Oncomine online database.
The key genes were highly expressed in gastric cancer tissues.
- Citation: Huang C, Hu CG, Ning ZK, Huang J, Zhu ZM. Identification of key genes controlling cancer stem cell characteristics in gastric cancer. World J Gastrointest Surg 2020; 12(11): 442-459
- URL: https://www.wjgnet.com/1948-9366/full/v12/i11/442.htm
- DOI: https://dx.doi.org/10.4240/wjgs.v12.i11.442


