Copyright
©The Author(s) 2025.
World J Diabetes. Aug 15, 2025; 16(8): 108245
Published online Aug 15, 2025. doi: 10.4239/wjd.v16.i8.108245
Published online Aug 15, 2025. doi: 10.4239/wjd.v16.i8.108245
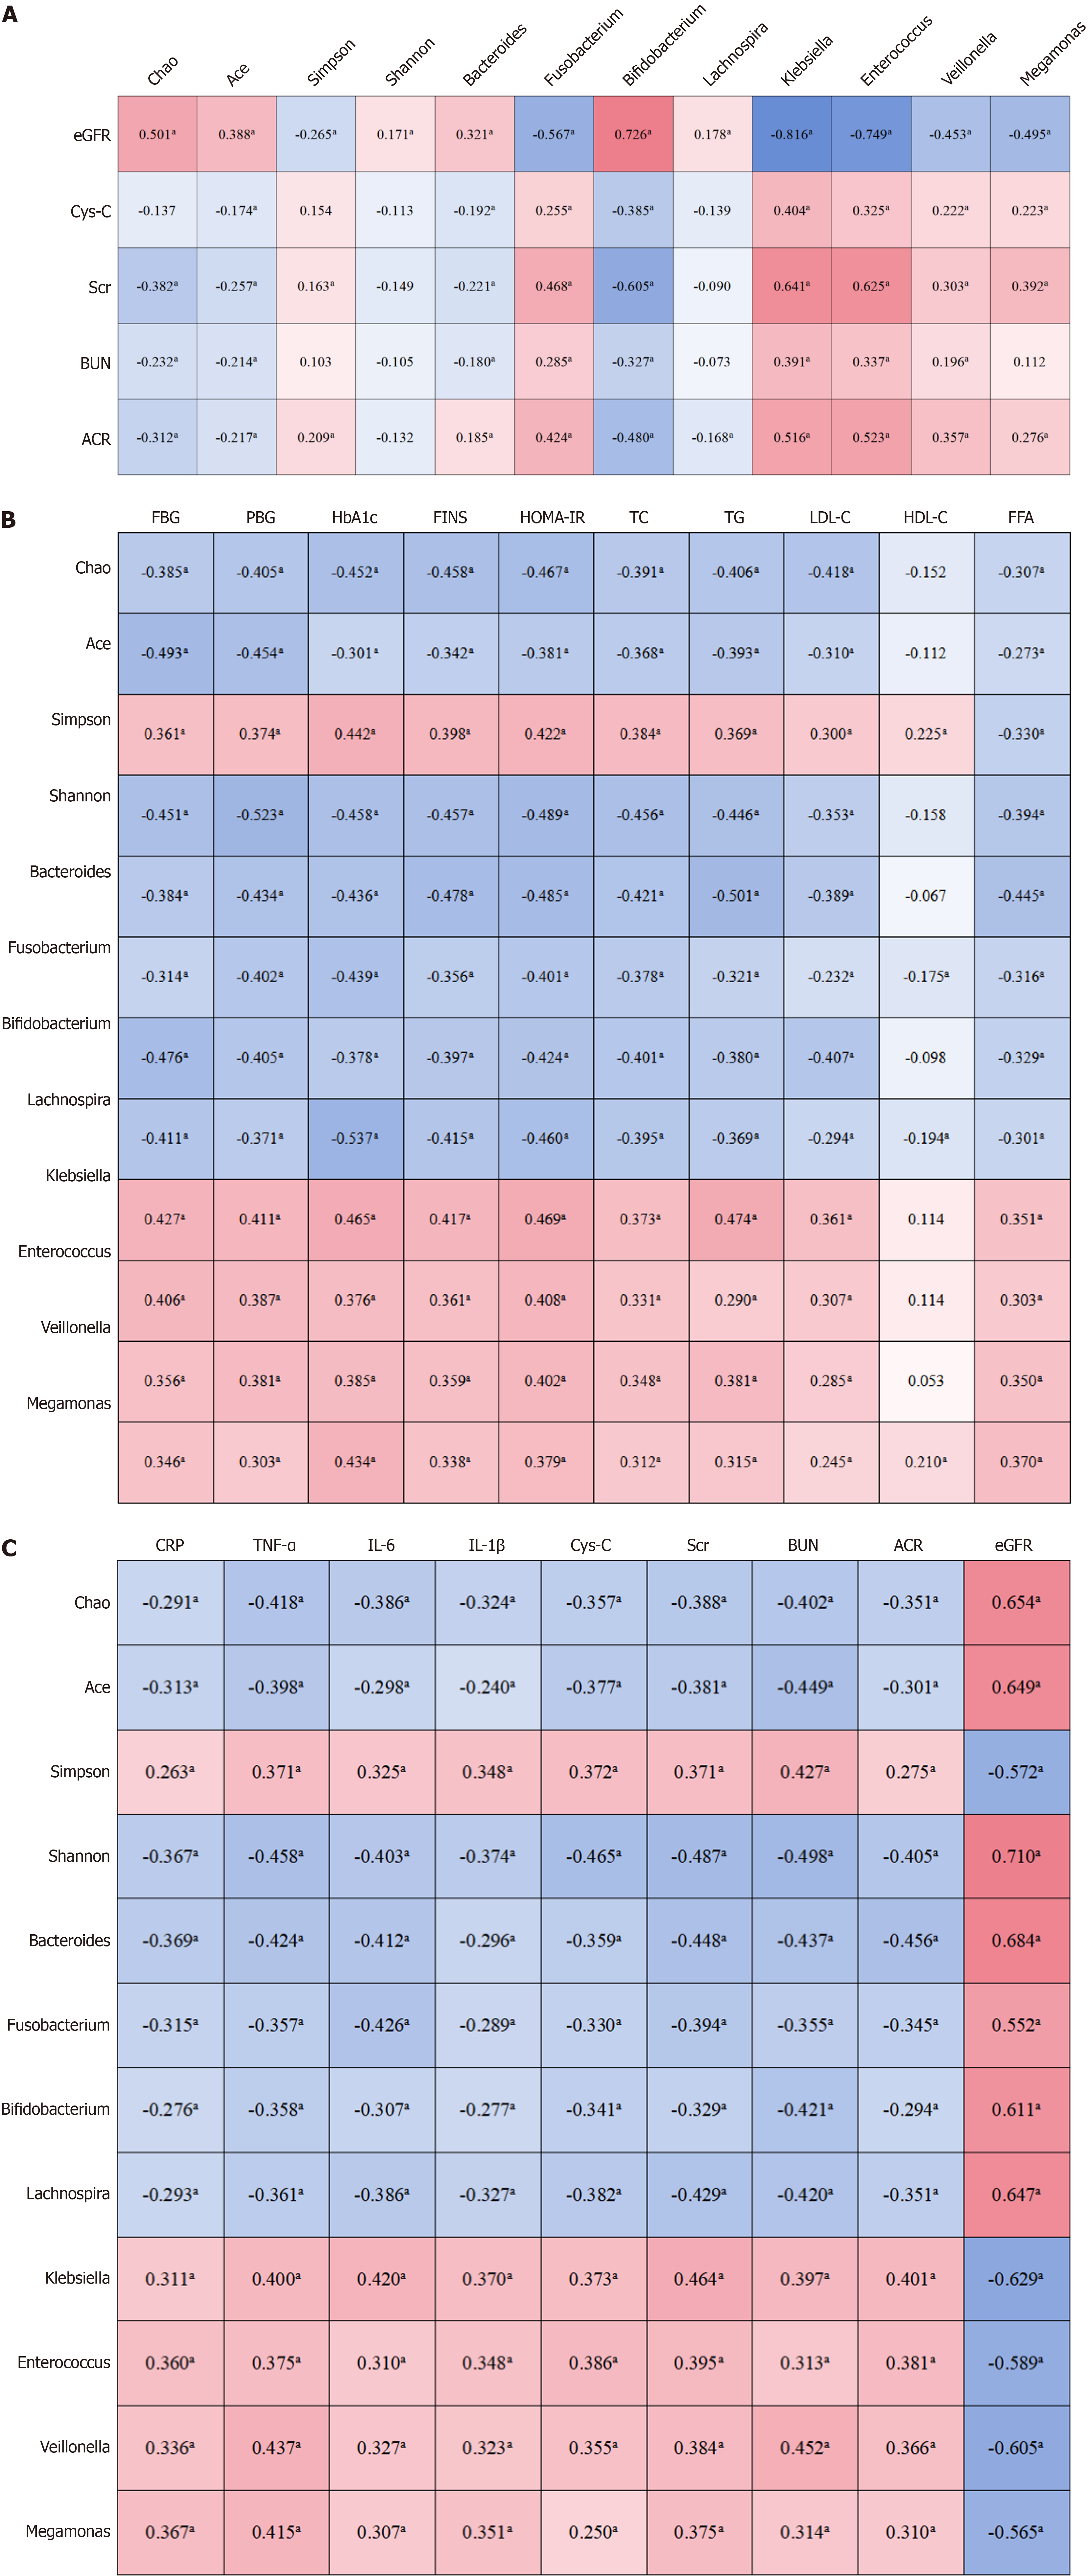
Figure 1 Correlations of gut microbiota with renal, metabolic and inflammatory indices.
aP < 0.05. A: Correlation matrix between intestinal microbial structure and renal function level; B: Correlation analysis matrix between changes in glucose and lipid metabolism and changes in gut microbiota; C: Correlation analysis matrix between changes in inflammation and renal function indicators and changes in gut microbiota. eGFR: Estimated glomerular filtration rate; Cys-C: Cystatin C; Scr: Serum creatinine; BUN: Blood urea nitrogen; ACR: Albumin-to-creatinine ratio; FBG: Fasting blood glucose; PBG: Postprandial blood glucose; HbA1c: Glycated hemoglobin; FINS: Fasting insulin; HOMA-IR: Homeostasis model assessment of insulin resistance; TC: Total cholesterol; TG: Triglycerides; LDL-C: Low-density lipoprotein cholesterol; HDL-C: High-density lipoprotein cholesterol; FFA: Free fatty acids; CRP: C-reactive protein; TNF-α: Tumor necrosis factor α; IL: Interleukin.
- Citation: Shi YP, Pan ZL, Zhang J, Xue LY, Li MQ. Gut dysbiosis, low-grade inflammation, and renal impairment severity in elderly diabetic nephropathy. World J Diabetes 2025; 16(8): 108245
- URL: https://www.wjgnet.com/1948-9358/full/v16/i8/108245.htm
- DOI: https://dx.doi.org/10.4239/wjd.v16.i8.108245


