Copyright
©The Author(s) 2025.
World J Diabetes. Aug 15, 2025; 16(8): 106833
Published online Aug 15, 2025. doi: 10.4239/wjd.v16.i8.106833
Published online Aug 15, 2025. doi: 10.4239/wjd.v16.i8.106833
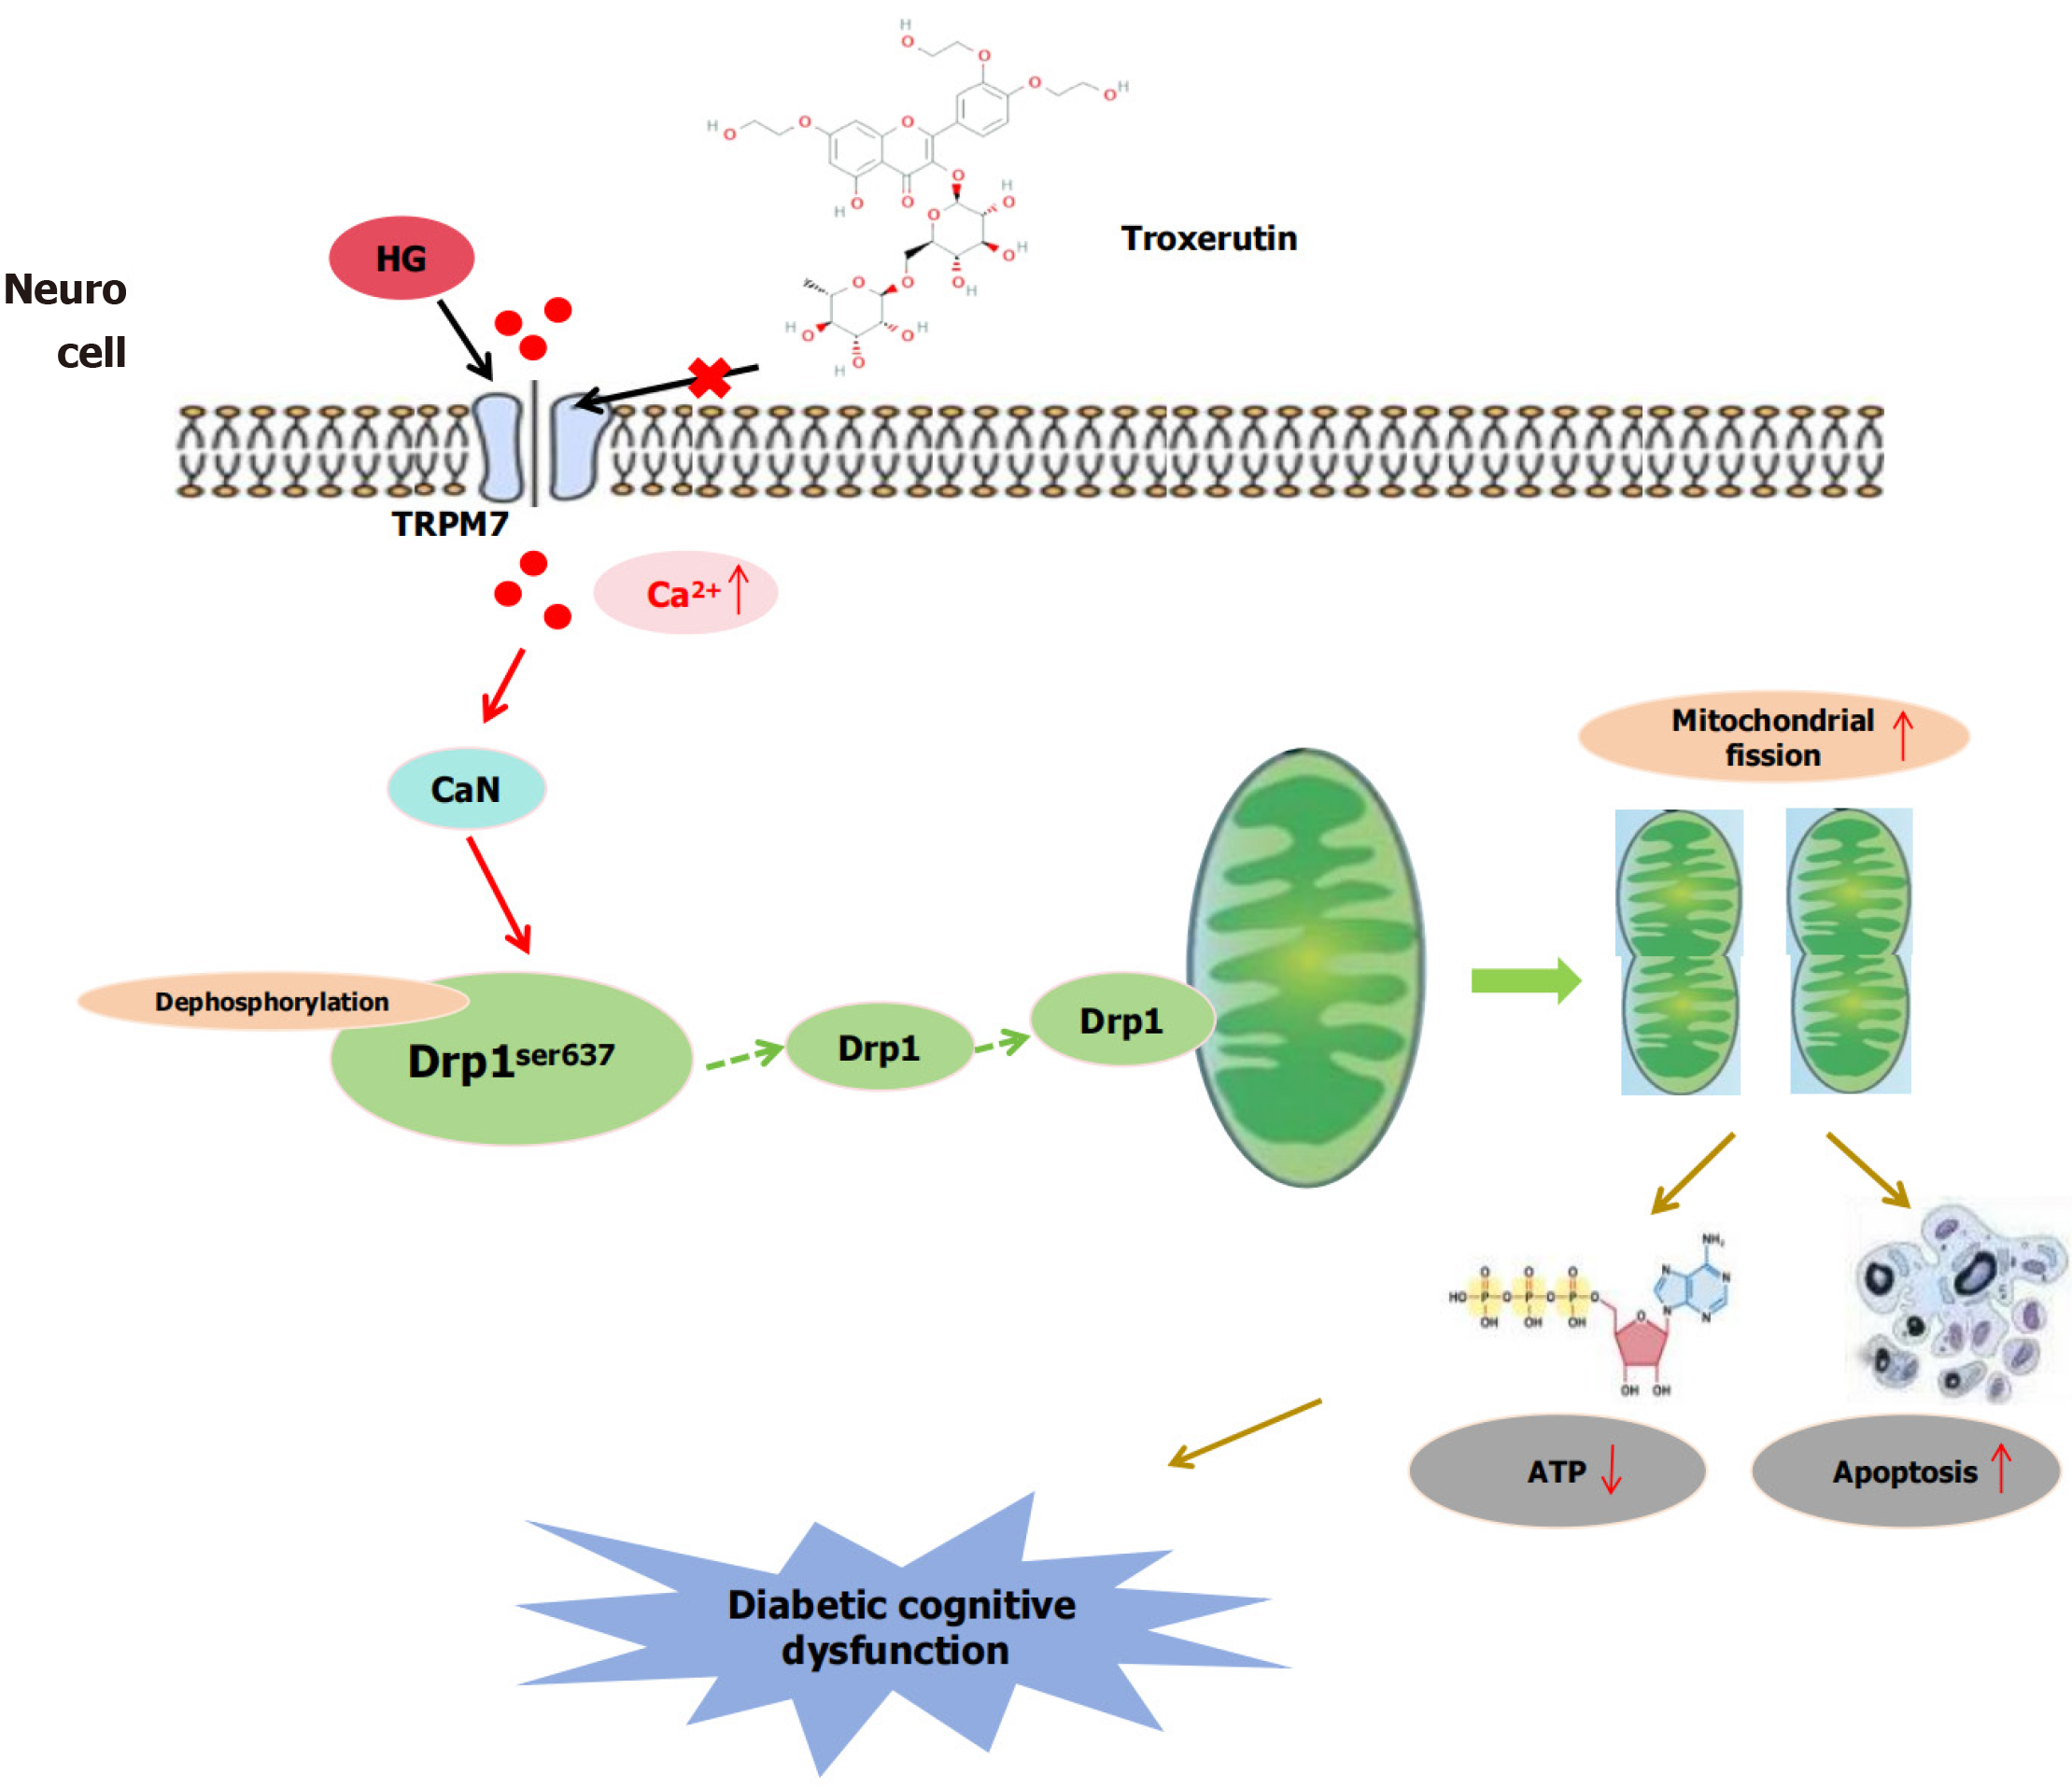
Figure 1 A schematic diagram illustrating the mechanism of troxerutin in improving diabetic cognitive dysfunction through inhibiting transient receptor potential melastatin 7-mediated mitochondrial fission.
HG: High-concentration glucose; ATP: Adenosine triphosphate; TRPM7: Transient receptor potential melastatin 7; CaN: Calcineurin.
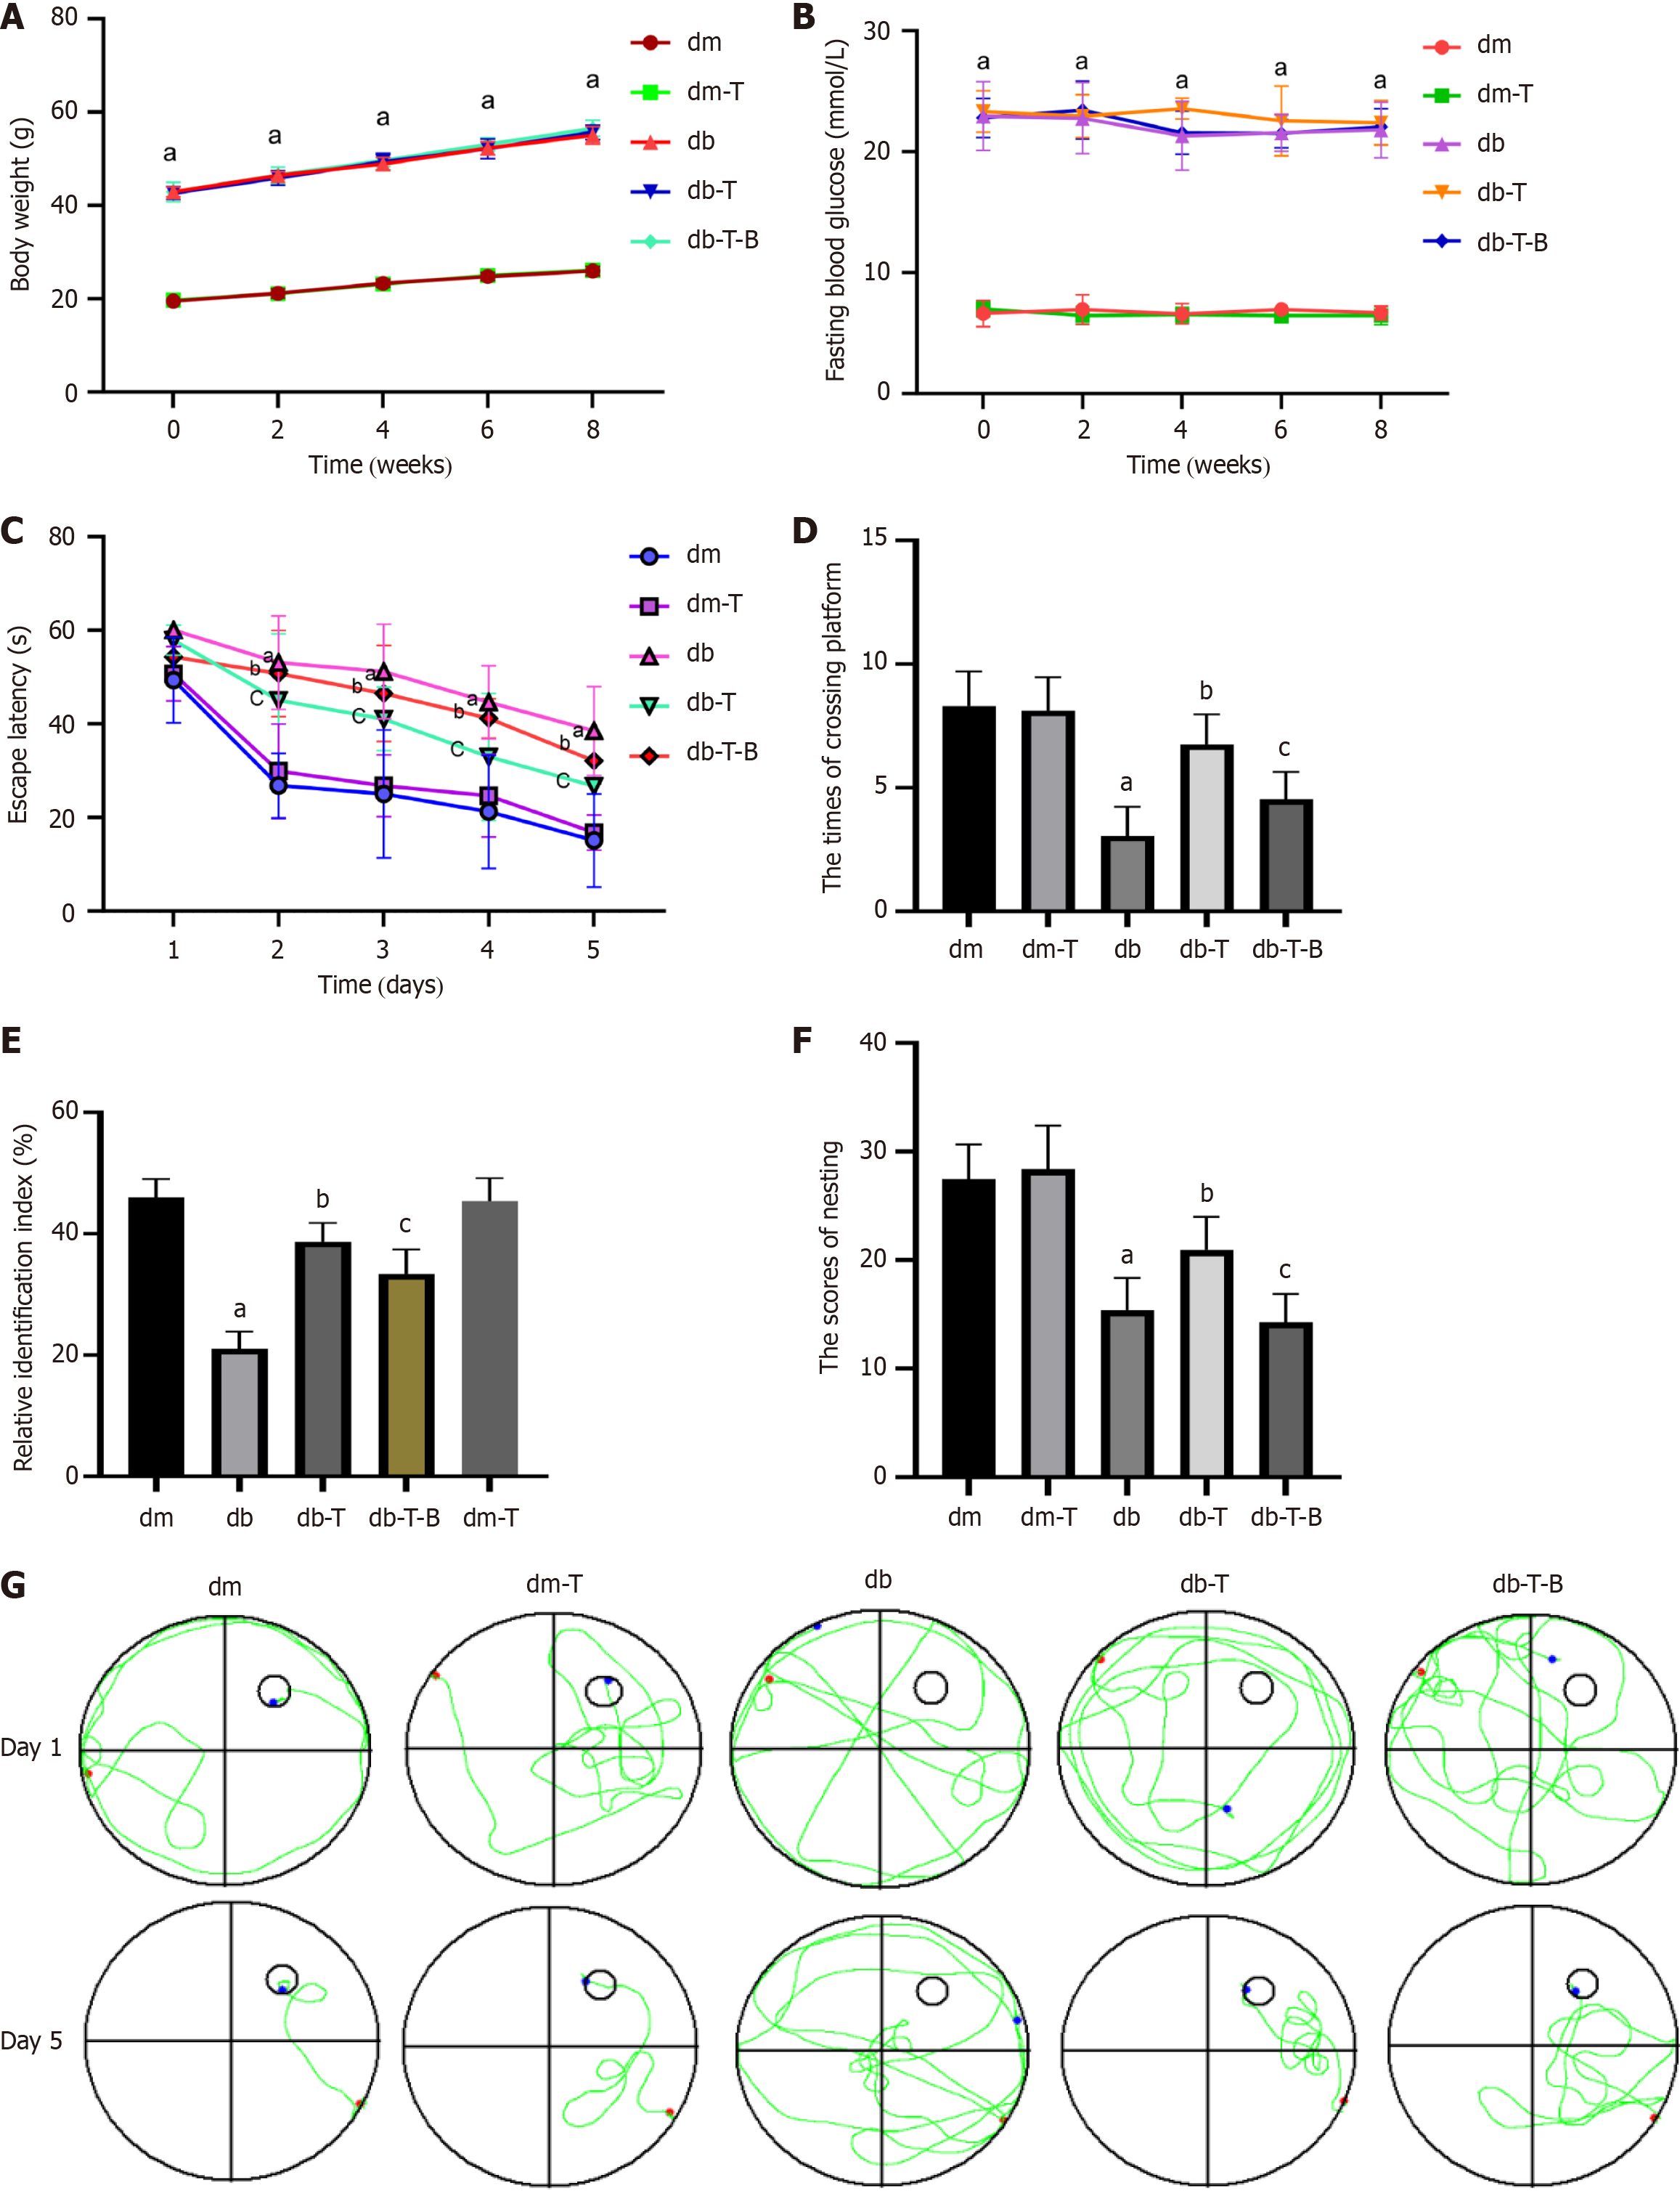
Figure 2 The db/db mice exhibit cognitive dysfunction at 17 weeks of age.
A: The body weight (n = 8 mice per group); B: The fasting glucose level (n = 8 mice per group); the animals’ cognitive functions were assessed by the Morris water-maze test, novel object recognition and Nesting test as described in “materials and methods” (n = 8 mice per group); C: Escape latency (s); D: The times of crossing platform within 60 seconds in spatial probe test; E: Relative identification index; F: The scores of nesting; G: Swimming trajectories of the mice in exploration experiment. aP < 0.05, compared with dm group; bP < 0.05, compared with db group; cP < 0.05, compared with the db-T group. Data presented as mean ± SEM. dm: Control group; dm-T: Control + troxerutin group; db: Diabetes group; db-T: Diabetes + troxerutin group; db-T-B: Diabetes + troxerutin + bradykinin group.
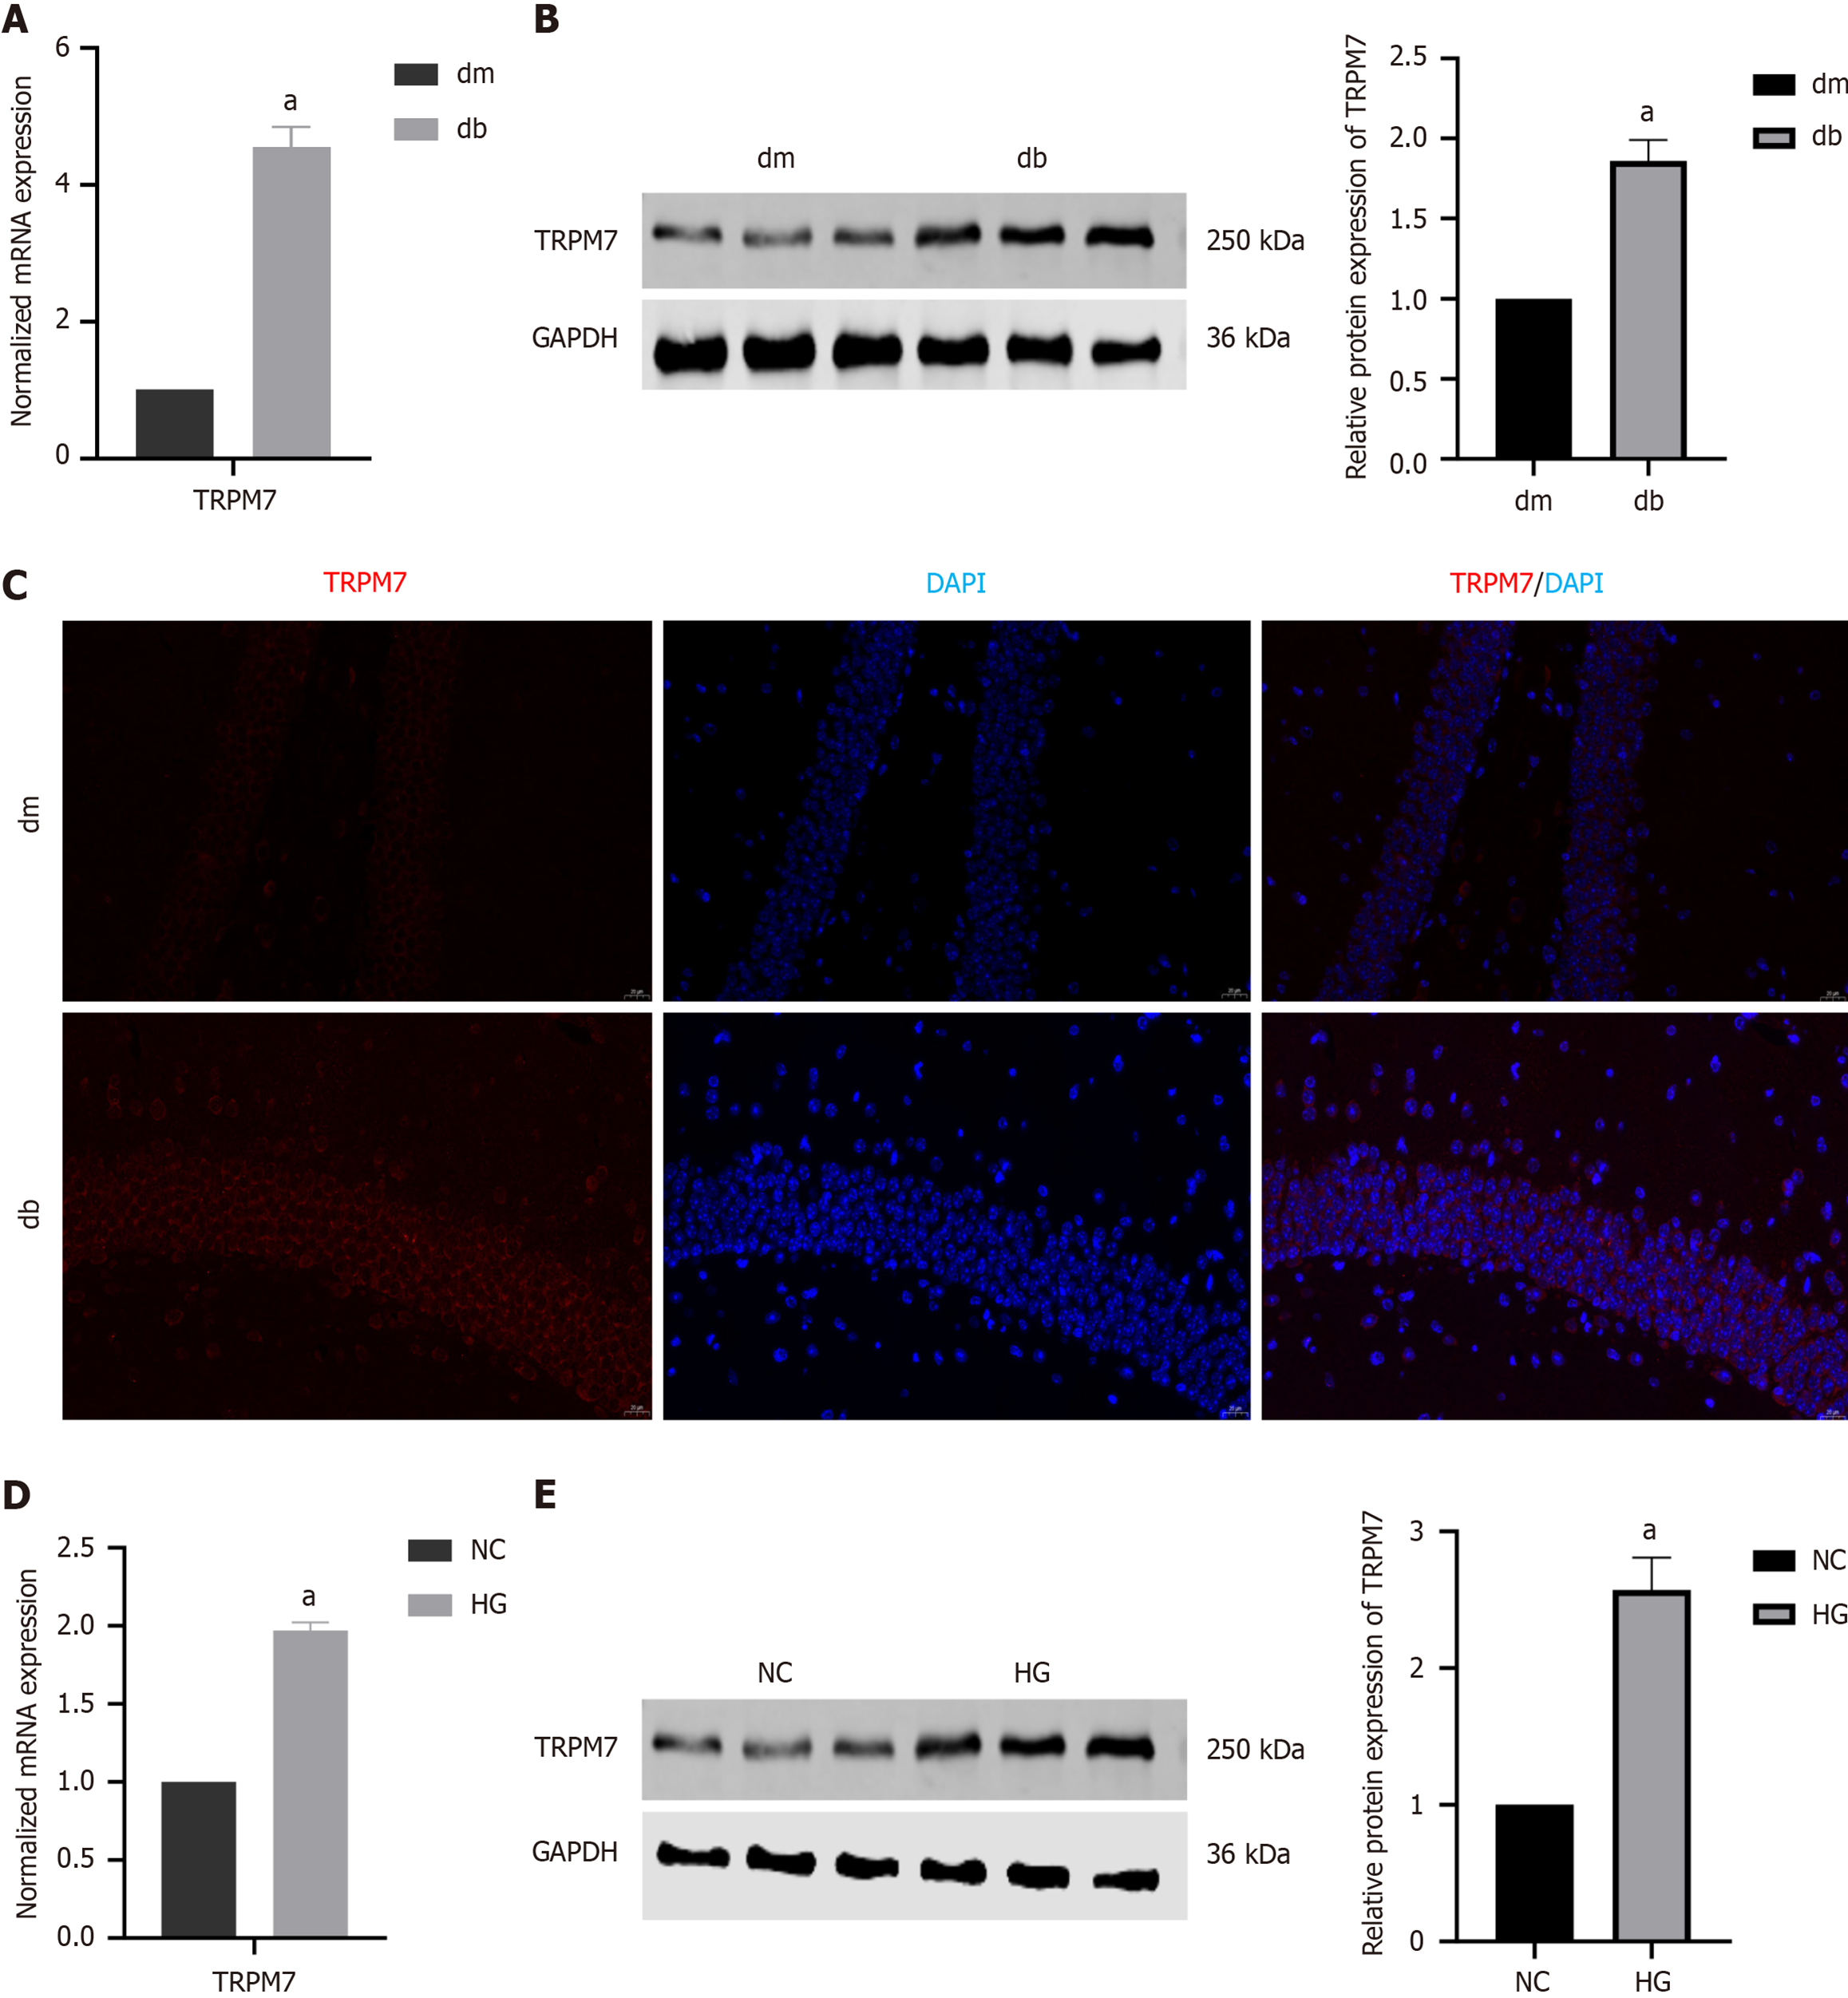
Figure 3 The level of transient receptor potential melastatin 7 was increased in diabetic cognitive dysfunction mice and hippocampal neuronal cells dealed with high-concentration glucose.
A: The normalized mRNA expression of transient receptor potential melastatin 7 (TRPM7) in the hippocampal tissue; B: The relative protein expression of TRPM7 in the hippocampal tissue; C: Immunofluorescent staining of TRPM7 in the hippocampal tissue; D: The normalized mRNA expression of TRPM7 in high-concentration glucose-treated hippocampal neuronal cells; E: The relative protein expression of TRPM7 in high-concentration glucose-treated hippocampal neuronal cells. aP < 0.05, compared with dm group or normal control group. Data presented as mean ± SEM. dm: Control group; db: Diabetes group; NC: Normal control; HG: Hypertonic group (100 mmol/L glucose); DAPI: 4’,6-diamidino-2-phenylindole; TRPM7: Transient receptor potential melastatin 7.
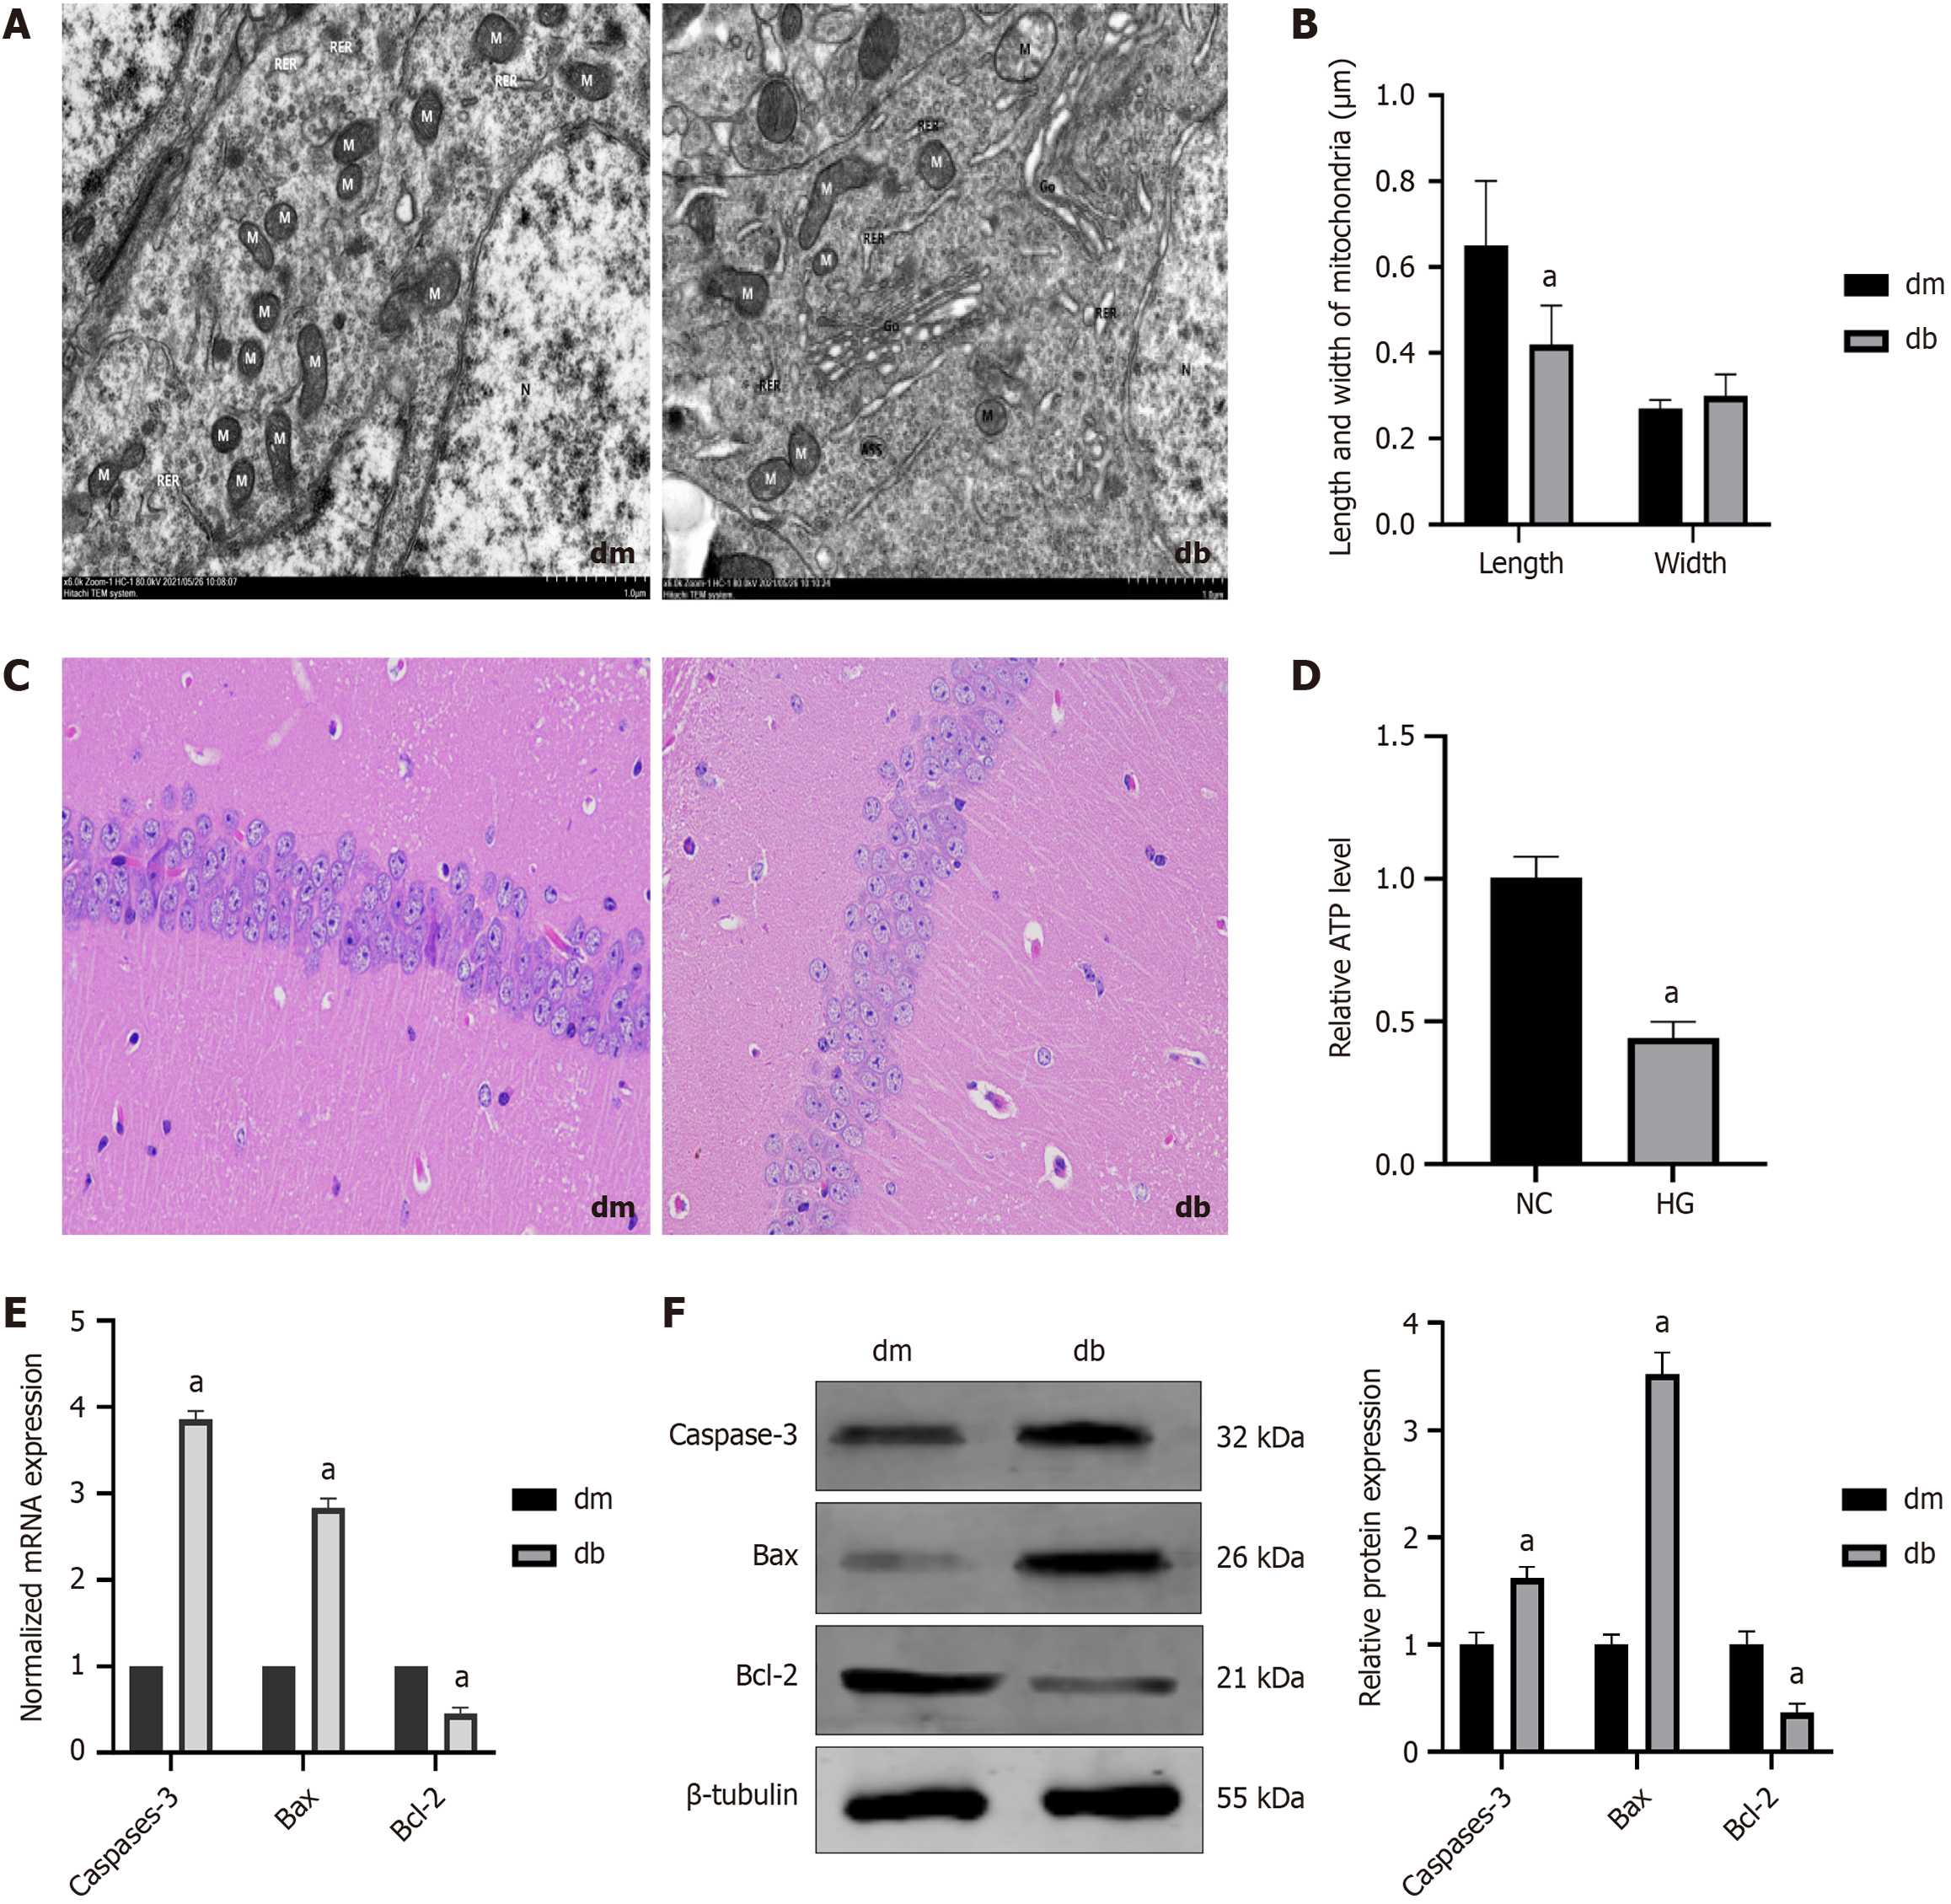
Figure 4 Mitochondrial division increased, adenosine triphosphate synthesis decreased, and apoptosis-associated molecules increased in the hippocampus of diabetic cognitive dysfunction mice.
A: Transmission electron microscopy images show mitochondrial swelling, disrupted and reduced cristae, and increased mitochondrial fission in the hippocampal tissue of db mice group; B: Mitochondrial length and width (n = 20); C: Hematoxylin and eosin staining shows disordered hippocampal pyramidal cells and disrupted organelle morphology in the db mice group (400 ×); D: Relative of adenosine triphosphate level; E: The normalized mRNA expression of caspase-3, B-cell lymphoma 2 (Bcl-2)-associated X protein (Bax), and Bcl-2; F: The relative protein expression of The relative protein expression of caspase-3, Bcl-2-associated X protein, and Bcl-2. aP < 0.05, compared with dm group. Data presented as mean ± SEM. dm: Control group; db: Diabetes group; NC: Normal control; HG: Hypertonic group (100 mmol/L glucose); Bax: B-cell lymphoma 2-associated X protein; Bcl-2: B-cell lymphoma 2.
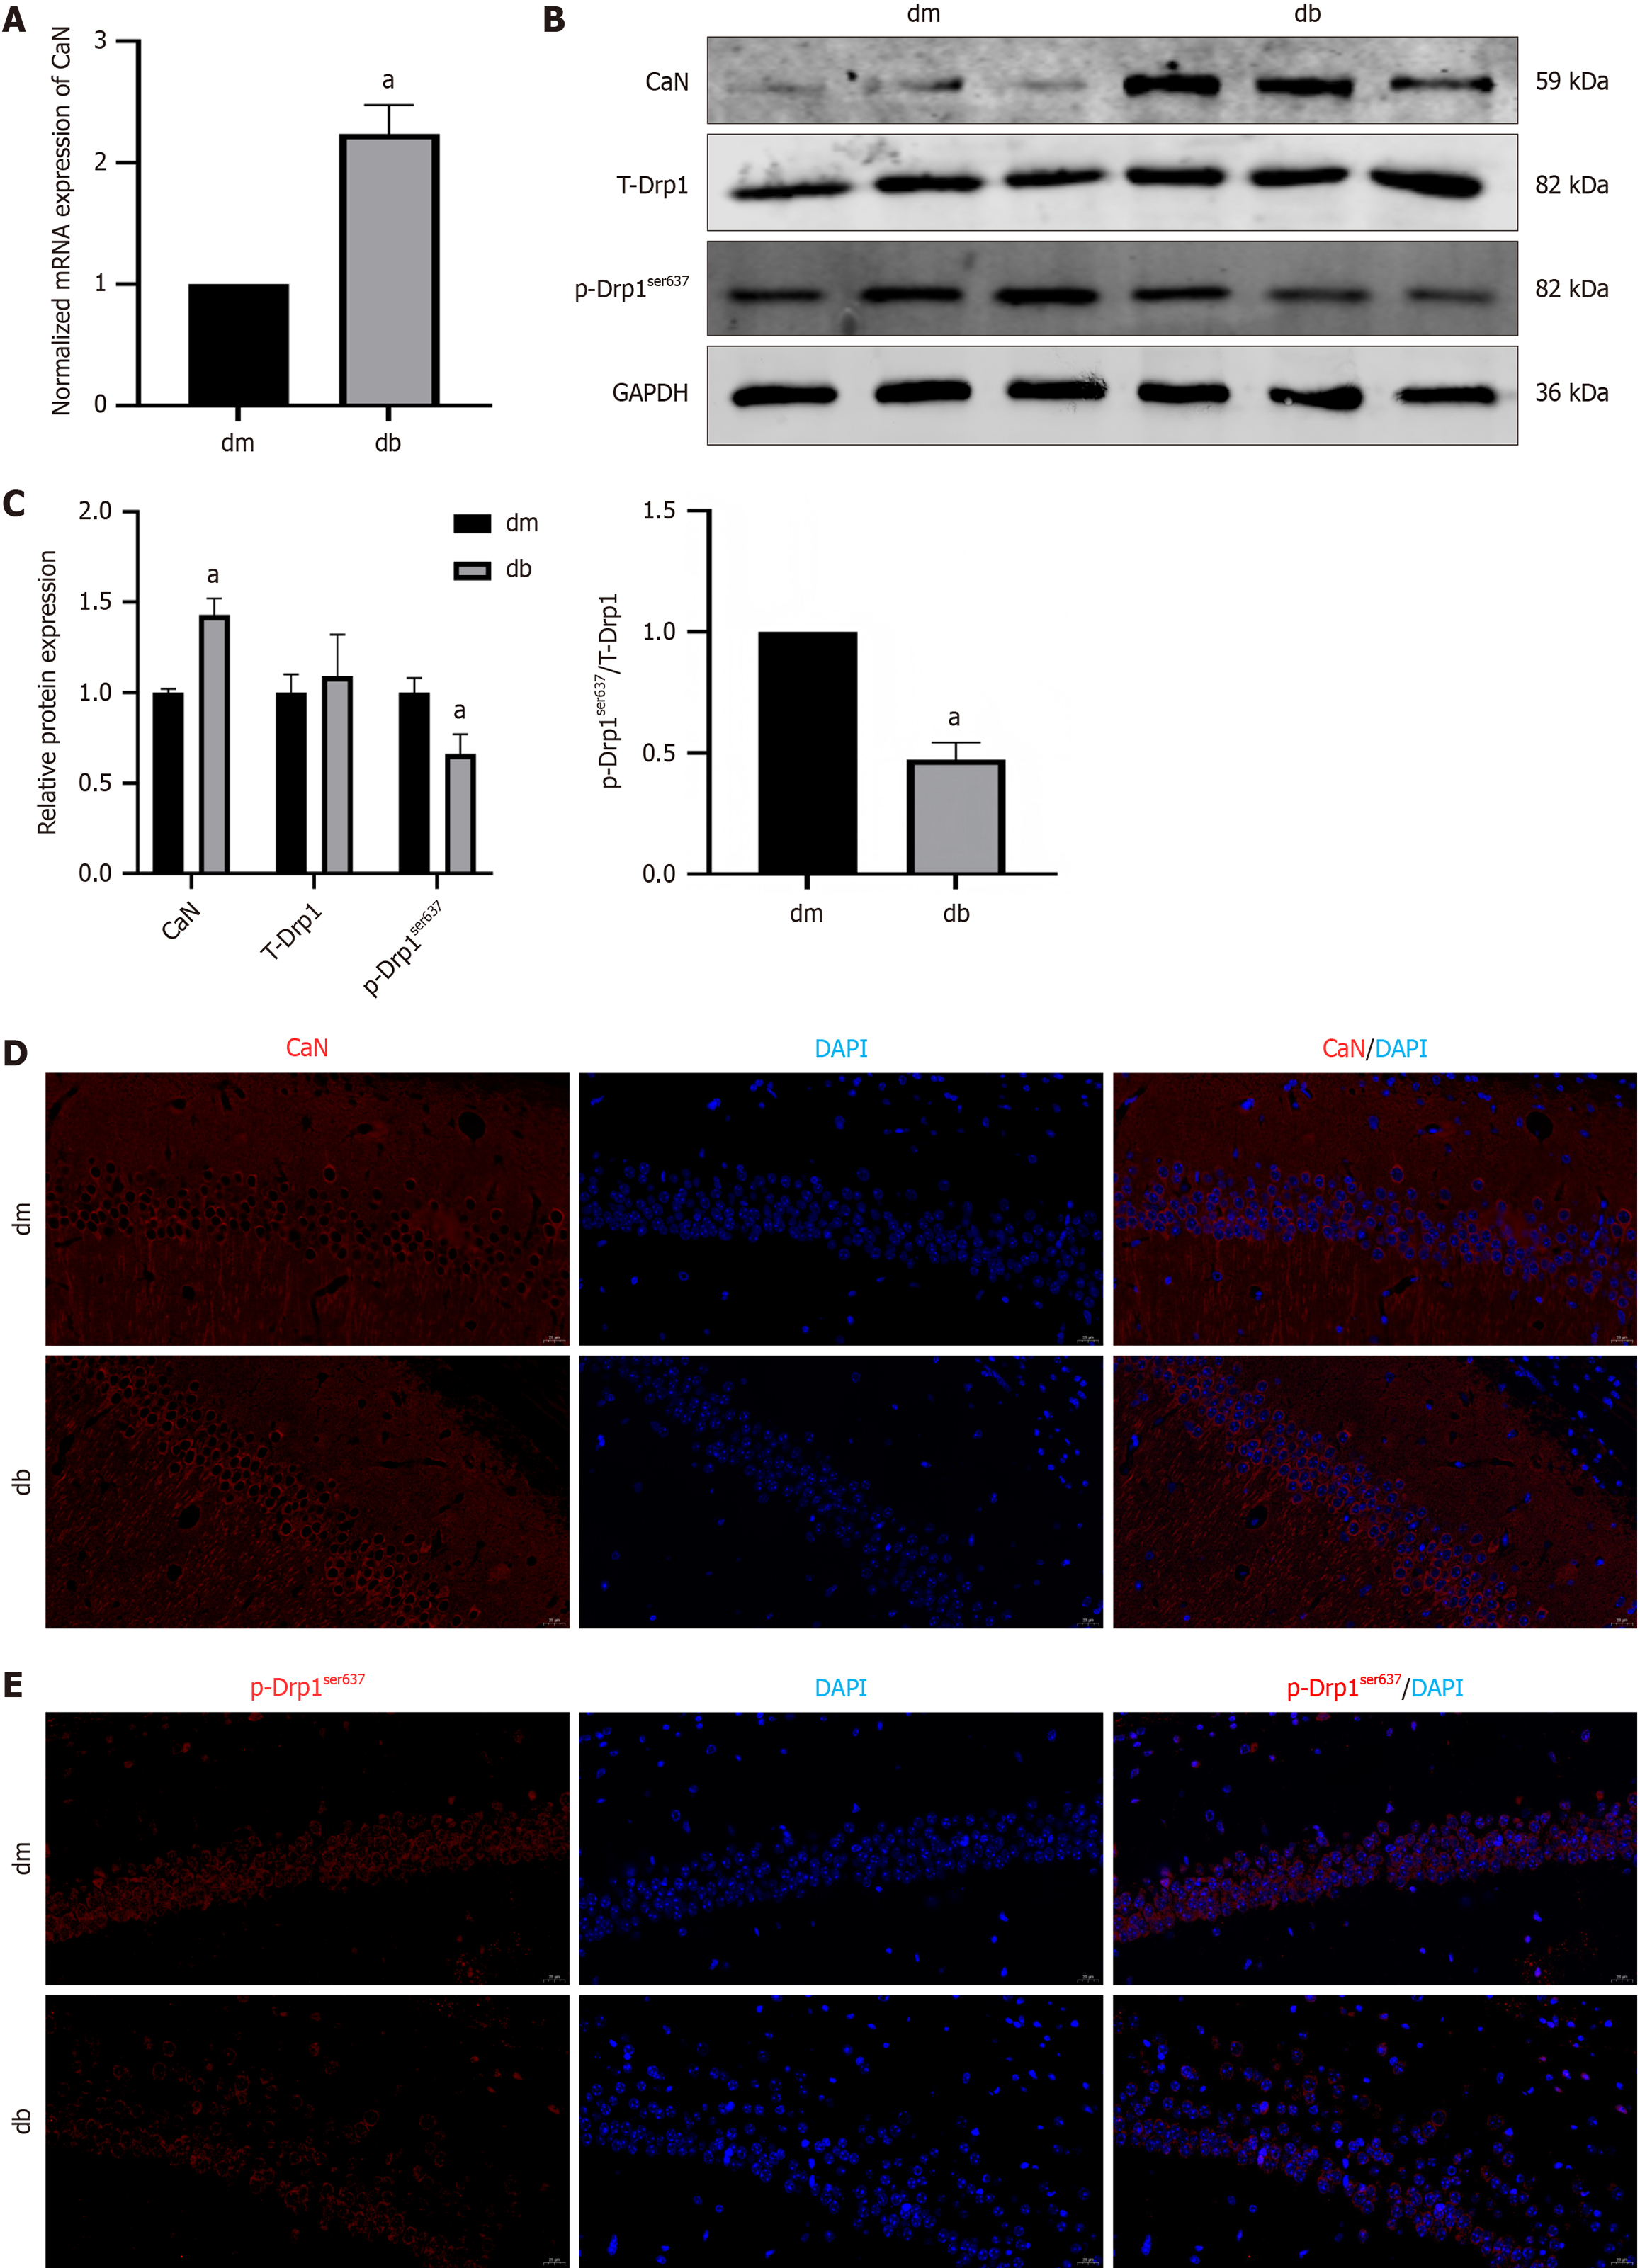
Figure 5 The expression of calcineurin was upregulated and the expression of p- dynamin-related protein 1ser637was downregulated in hippocampus of diabetic cognitive dysfunction mice.
A: The normalized mRNA expression of calcineurin (CaN); B: Protein bands of CaN, T-dynamin-related protein 1 (Drp1), and p-Drp1ser637; C: The relative protein expression of CaN, T-Drp1, and p-Drp1ser637; D: Immunofluorescent staining of CaN; E: Immunofluorescent staining of p-Drp1ser637. aP < 0.05, compared with dm group. Data presented as mean ± SEM. Drp1: Dynamin-related protein 1; dm: Control group; db: Diabetes group; CaN: Calcineurin; DAPI: 4’,6-diamidino-2-phenylindole.
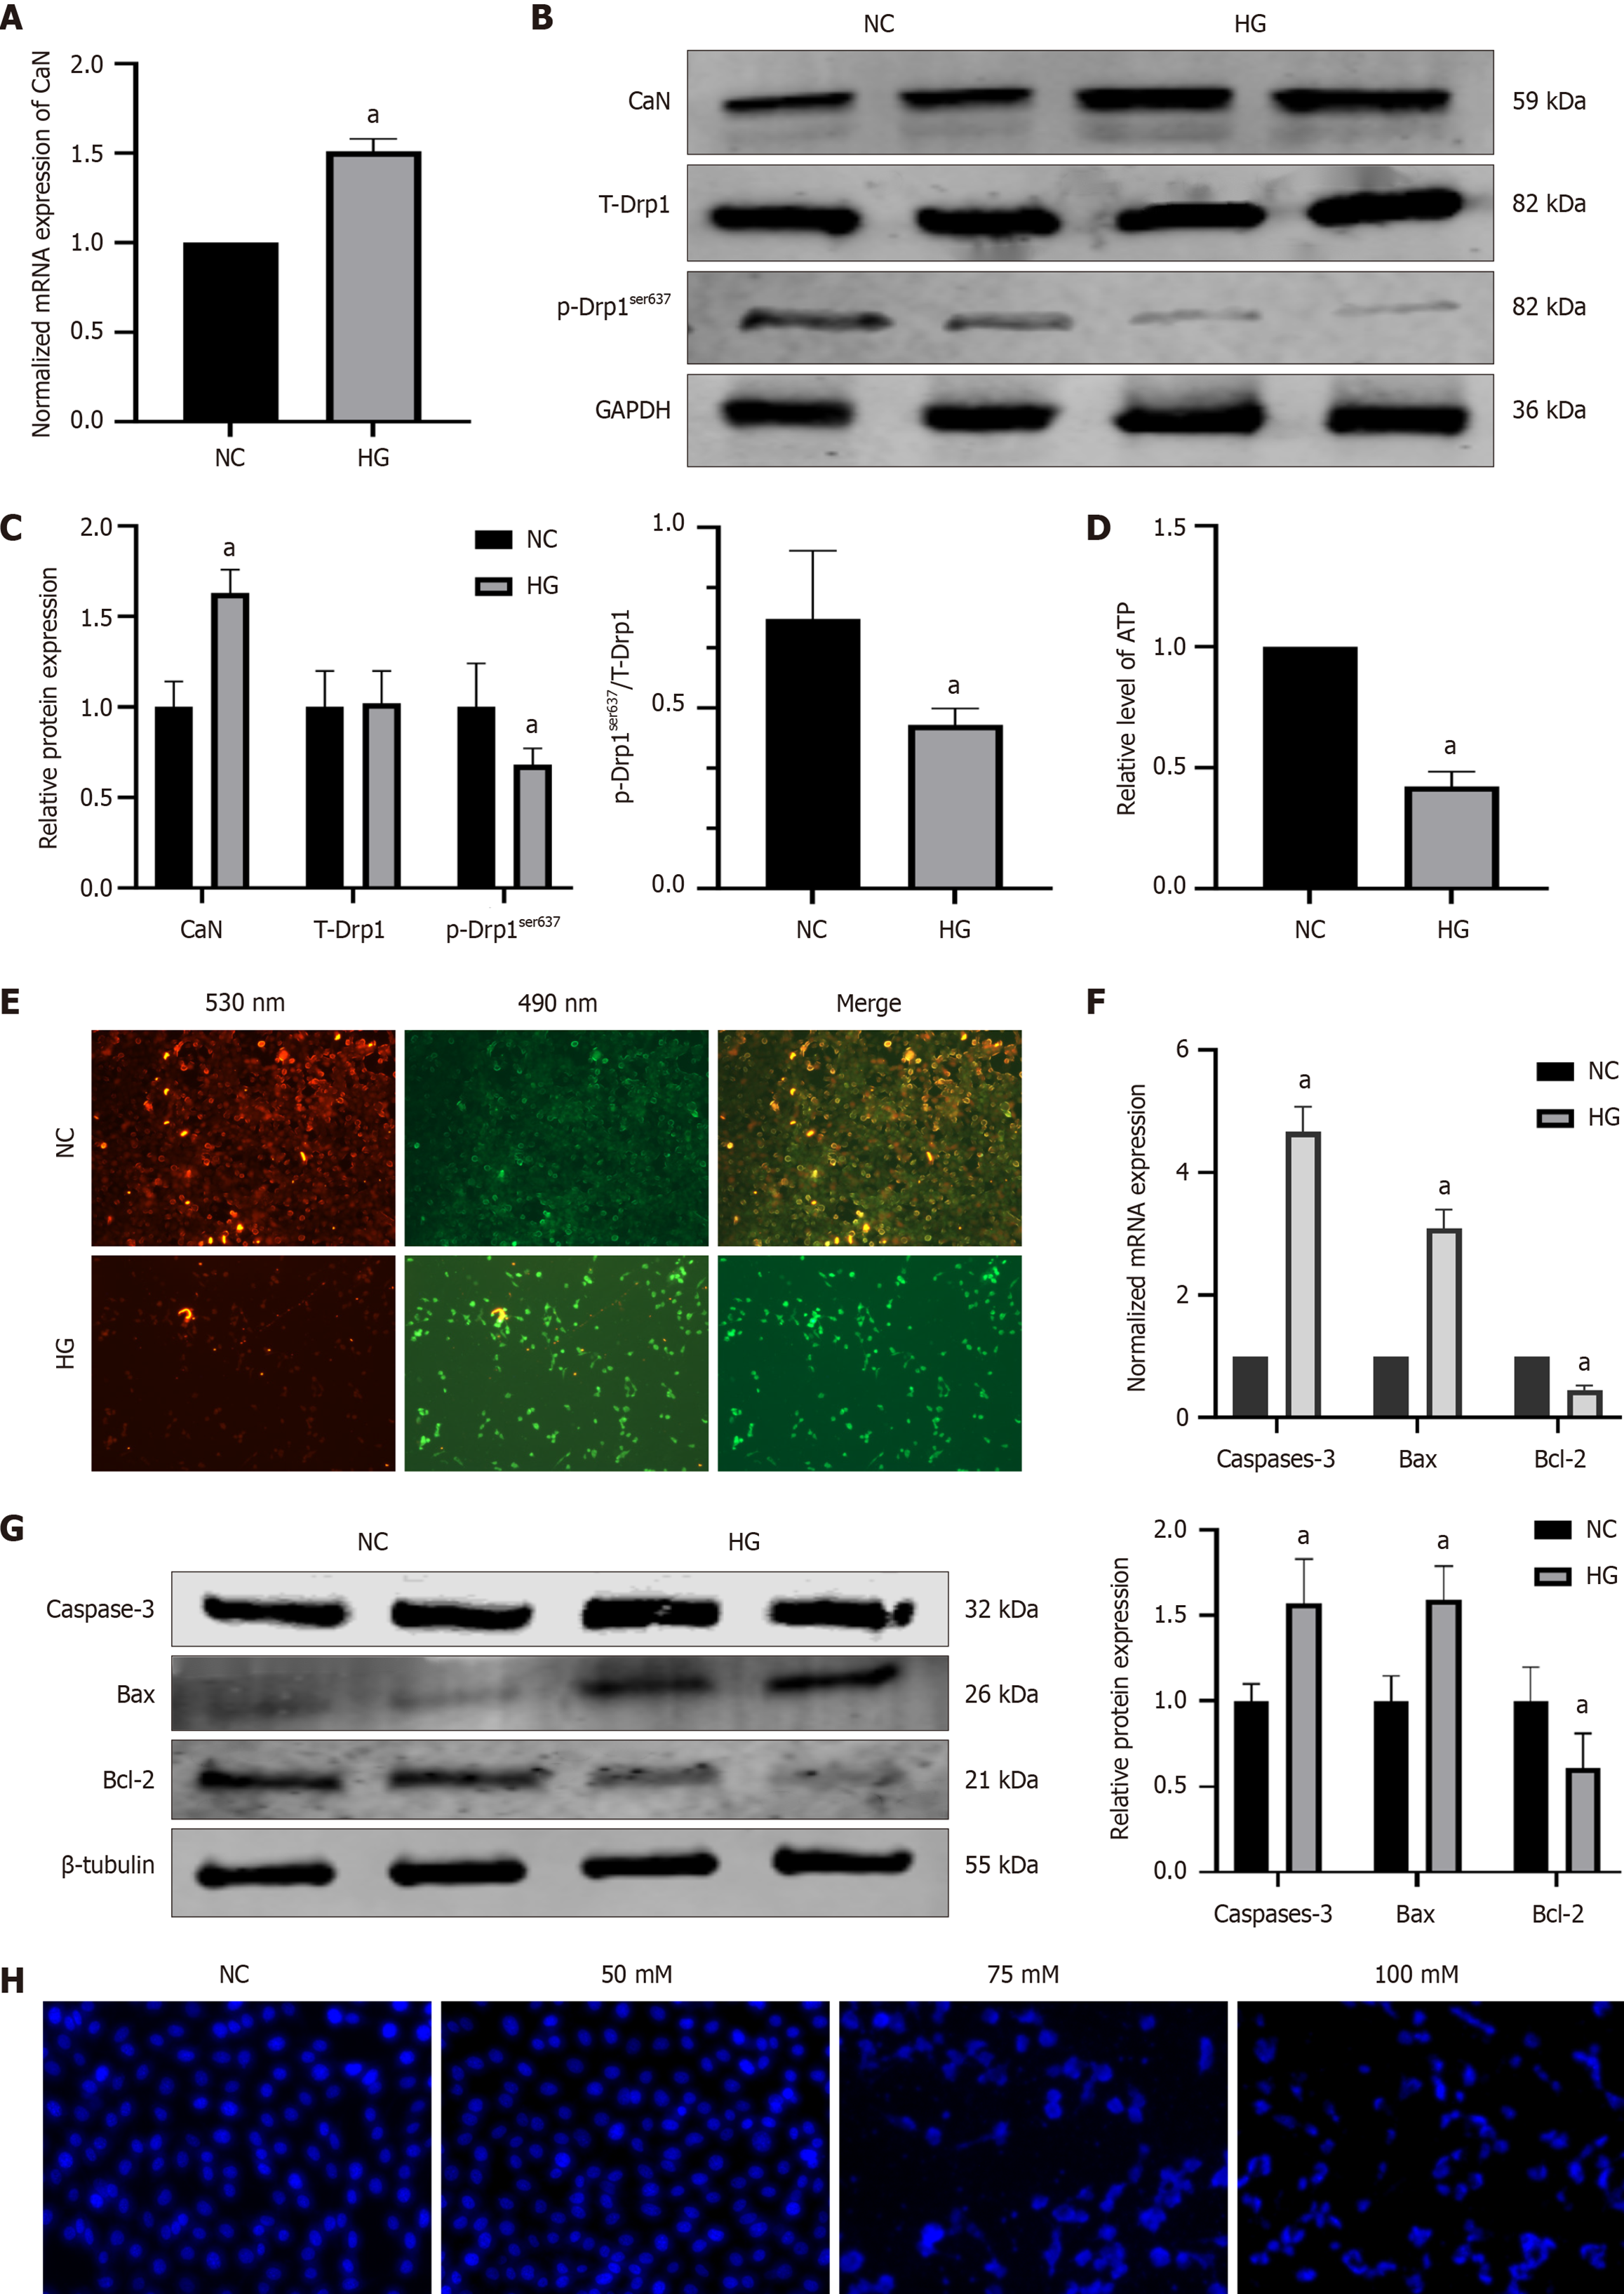
Figure 6 High-concentration glucose increased expressions of calcineurin and apoptosis-associated molecules, decreased expressions of adenosine triphosphate and p-dynamin-related protein 1ser637 in hippocampal neuronal cells.
A: The normalized mRNA expression of calcineurin (CaN); B: Protein bands of CaN, T-dynamin-related protein 1 (Drp1) and p-Drp1ser637; C: The relative protein expression of CaN, T-Drp1 and p-Drp1ser637; D: Relative of adenosine triphosphate level; E: Mitochondrial membrane potential: The red fluorescence was decreased in the high-concentration glucose group, indicating an increase in apoptotic cells; F: The normalized mRNA expression of caspase-3, B-cell lymphoma 2 (Bcl-2)-associated X protein (Bax), and Bcl-2; G: The relative protein expression of The relative protein expression of caspase-3, Bcl-2-associated X protein, and Bcl-2; H: Hoechst 33258 fluorescence staining: The cell nucleus presented with a lobulated and fragmented appearance in the high-concentration glucose group. aP < 0.05, compared with normal control group. Data presented as mean ± SEM. Drp1: Dynamin-related protein 1; CaN: Calcineurin; NC: Normal control; HG: Hypertonic group (100 mmol/L glucose); GAPDH: Glyceraldehyde-3-phosphate dehydrogenase; Bax: B-cell lymphoma 2-associated X protein; Bcl-2: B-cell lymphoma 2.
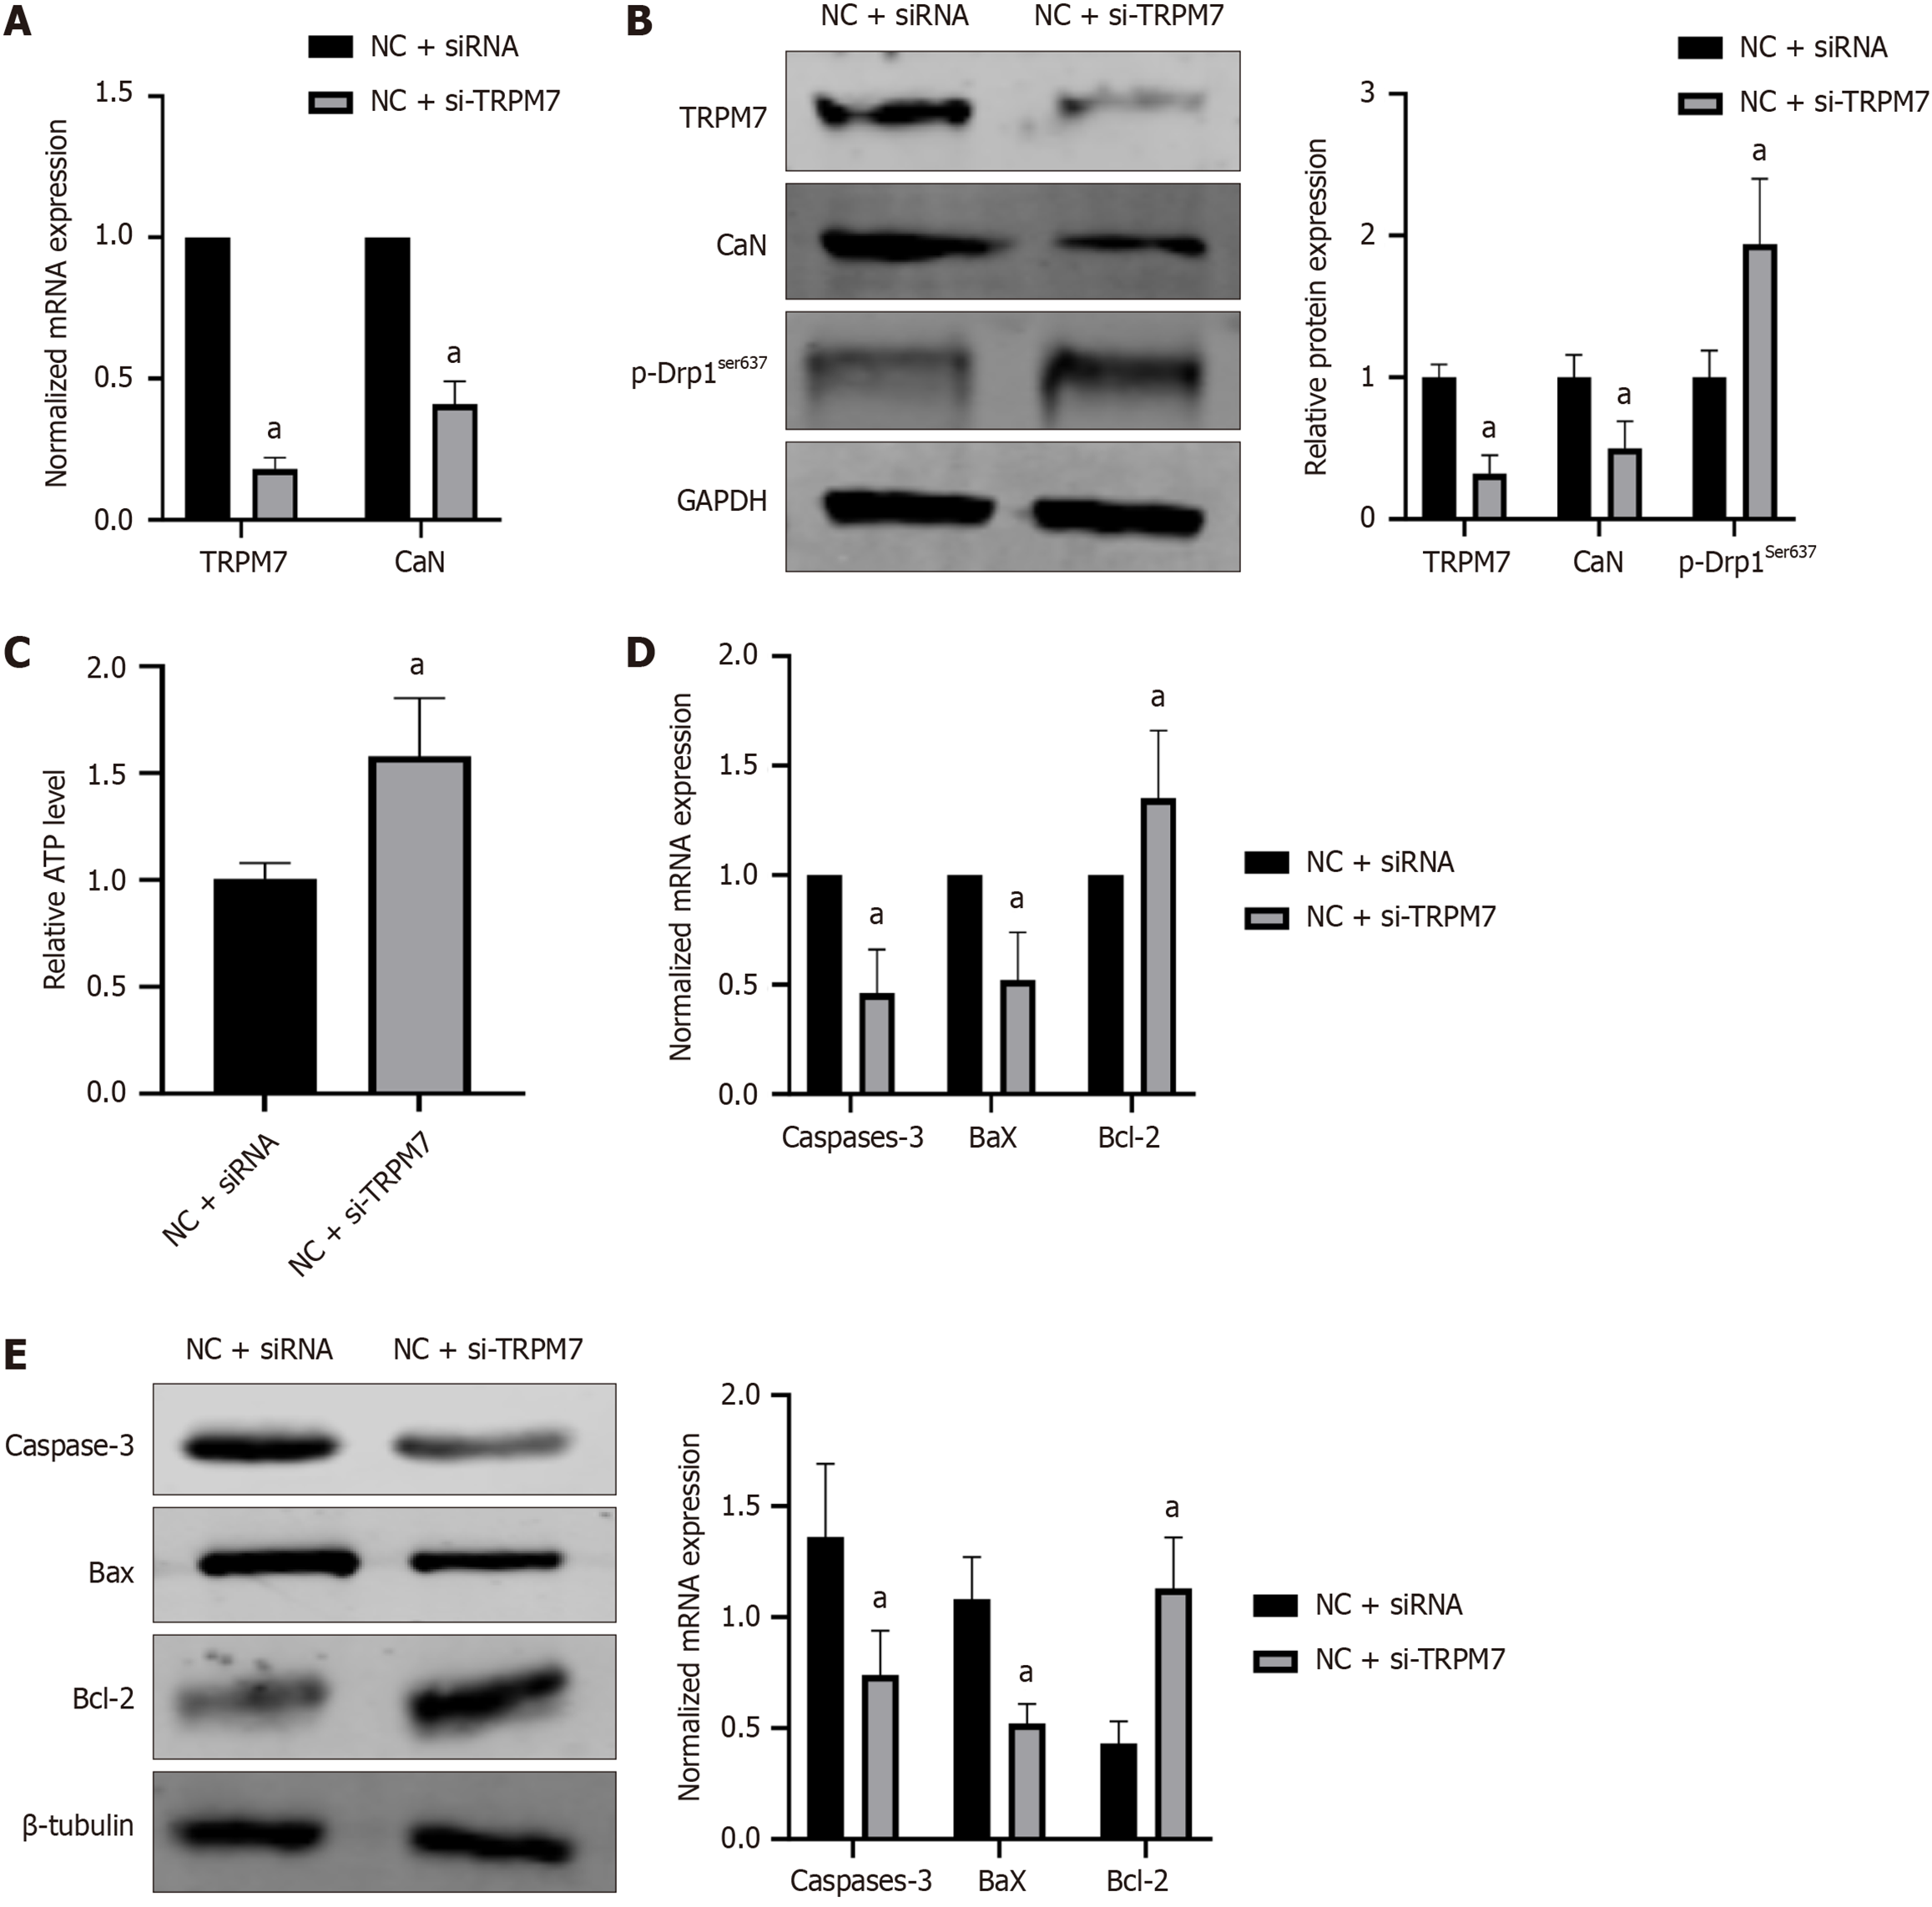
Figure 7 Silencing transient receptor potential melastatin 7 inhibited expressions of calcineurin and apoptosis-associated molecules, increased expressions of adenosine triphosphate and p-dynamin-related protein 1ser637 in hippocampal neuronal cells.
Cells were preincubated with transient receptor potential melastatin 7 (TRPM7) siRNA or control siRNA for 24 hours and then incubated with high-concentration glucose for 48 hours. A: The normalized mRNA expression of TRPM7, calcineurin, and p-Drp1ser637; B: The relative protein expression of TRPM7, calcineurin, and p-Drp1ser637; C: Relative of adenosine triphosphate level; D: The normalized mRNA expression of caspase-3, B-cell lymphoma 2 (Bcl-2)-associated X protein (Bax), and Bcl-2; E: The relative protein expression of the relative protein expression of caspase-3, Bcl-2-associated X protein, and Bcl-2. aP < 0.05, compared with normal control + small interfering RNA empty vector group. Data presented as mean ± SEM. Drp1: Dynamin-related protein 1; TRPM7: Transient receptor potential melastatin 7; CaN: Calcineurin; NC: Normal control; siRNA: Small interfering RNA; Bax: B-cell lymphoma 2-associated X protein; Bcl-2: B-cell lymphoma 2.
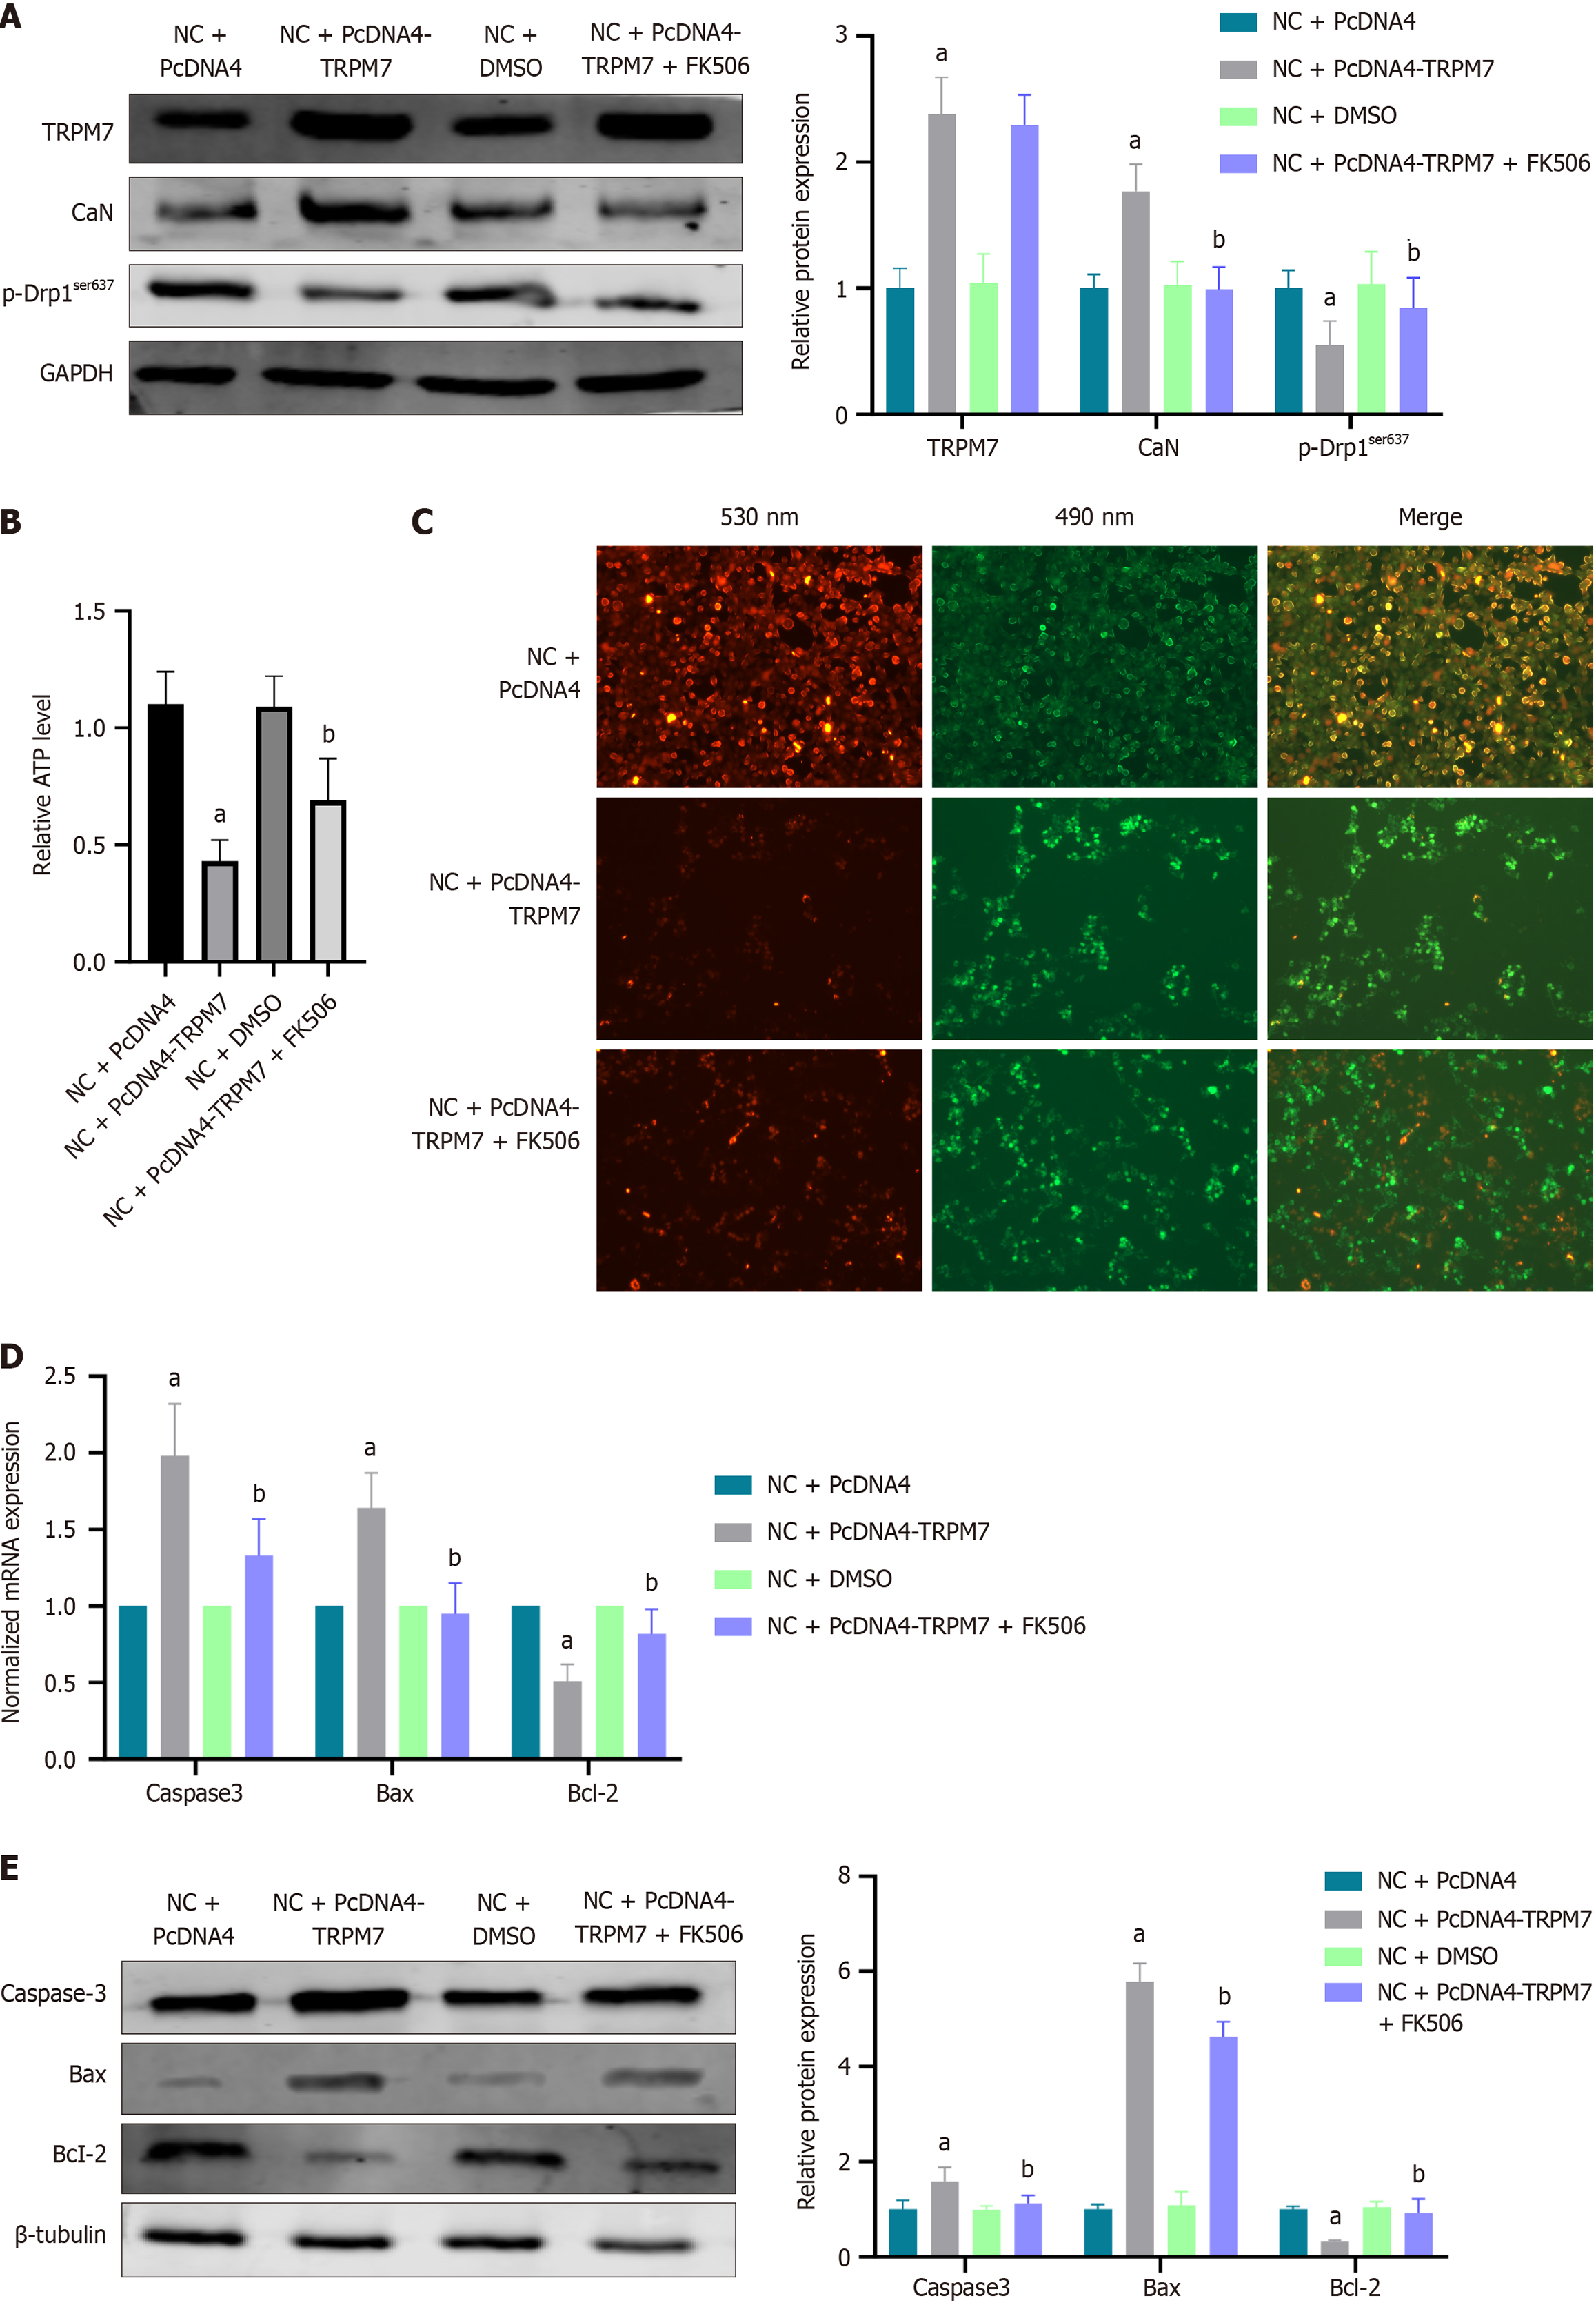
Figure 8 Overexpression of transient receptor potential melastatin 7 increased expressions of calcineurin and apoptosis-associated molecules, decreased expressions of adenosine triphosphate and p-dynamin-related protein 1ser637 in hippocampal neuronal cells.
A: The relative protein expression of transient receptor potential melastatin 7 (TRPM7), calcineurin, and p-Drp1ser637; B: Relative of adenosine triphosphate level; C: Mitochondrial membrane potential: The red fluorescence was decreased in the NC + PcDNA4-TRPM7 group, indicating an increase in apoptotic cells; D: The normalized mRNA expression of caspase-3, B-cell lymphoma 2 (Bcl-2)-associated X protein (Bax), and Bcl-2; E: The relative protein expression of The relative protein expression of caspase-3, Bcl-2-associated X protein, and Bcl-2, FK506 is a calcineurin inhibitor that attenuates the adenosine triphosphate reduction and cell apoptosis caused by TRPM7 overexpression. aP < 0.05, compared with normal control + PcDNA4 group; bP < 0.05, compared with NC + PcDNA4-TRPM7 group. Data presented as mean ± SEM. Drp1: Dynamin-related protein 1; TRPM7: Transient receptor potential melastatin 7; CaN: Calcineurin; NC: Normal control; DMSO: Dimethyl sulfoxide; Bax: B-cell lymphoma 2-associated X protein; Bcl-2: B-cell lymphoma 2.
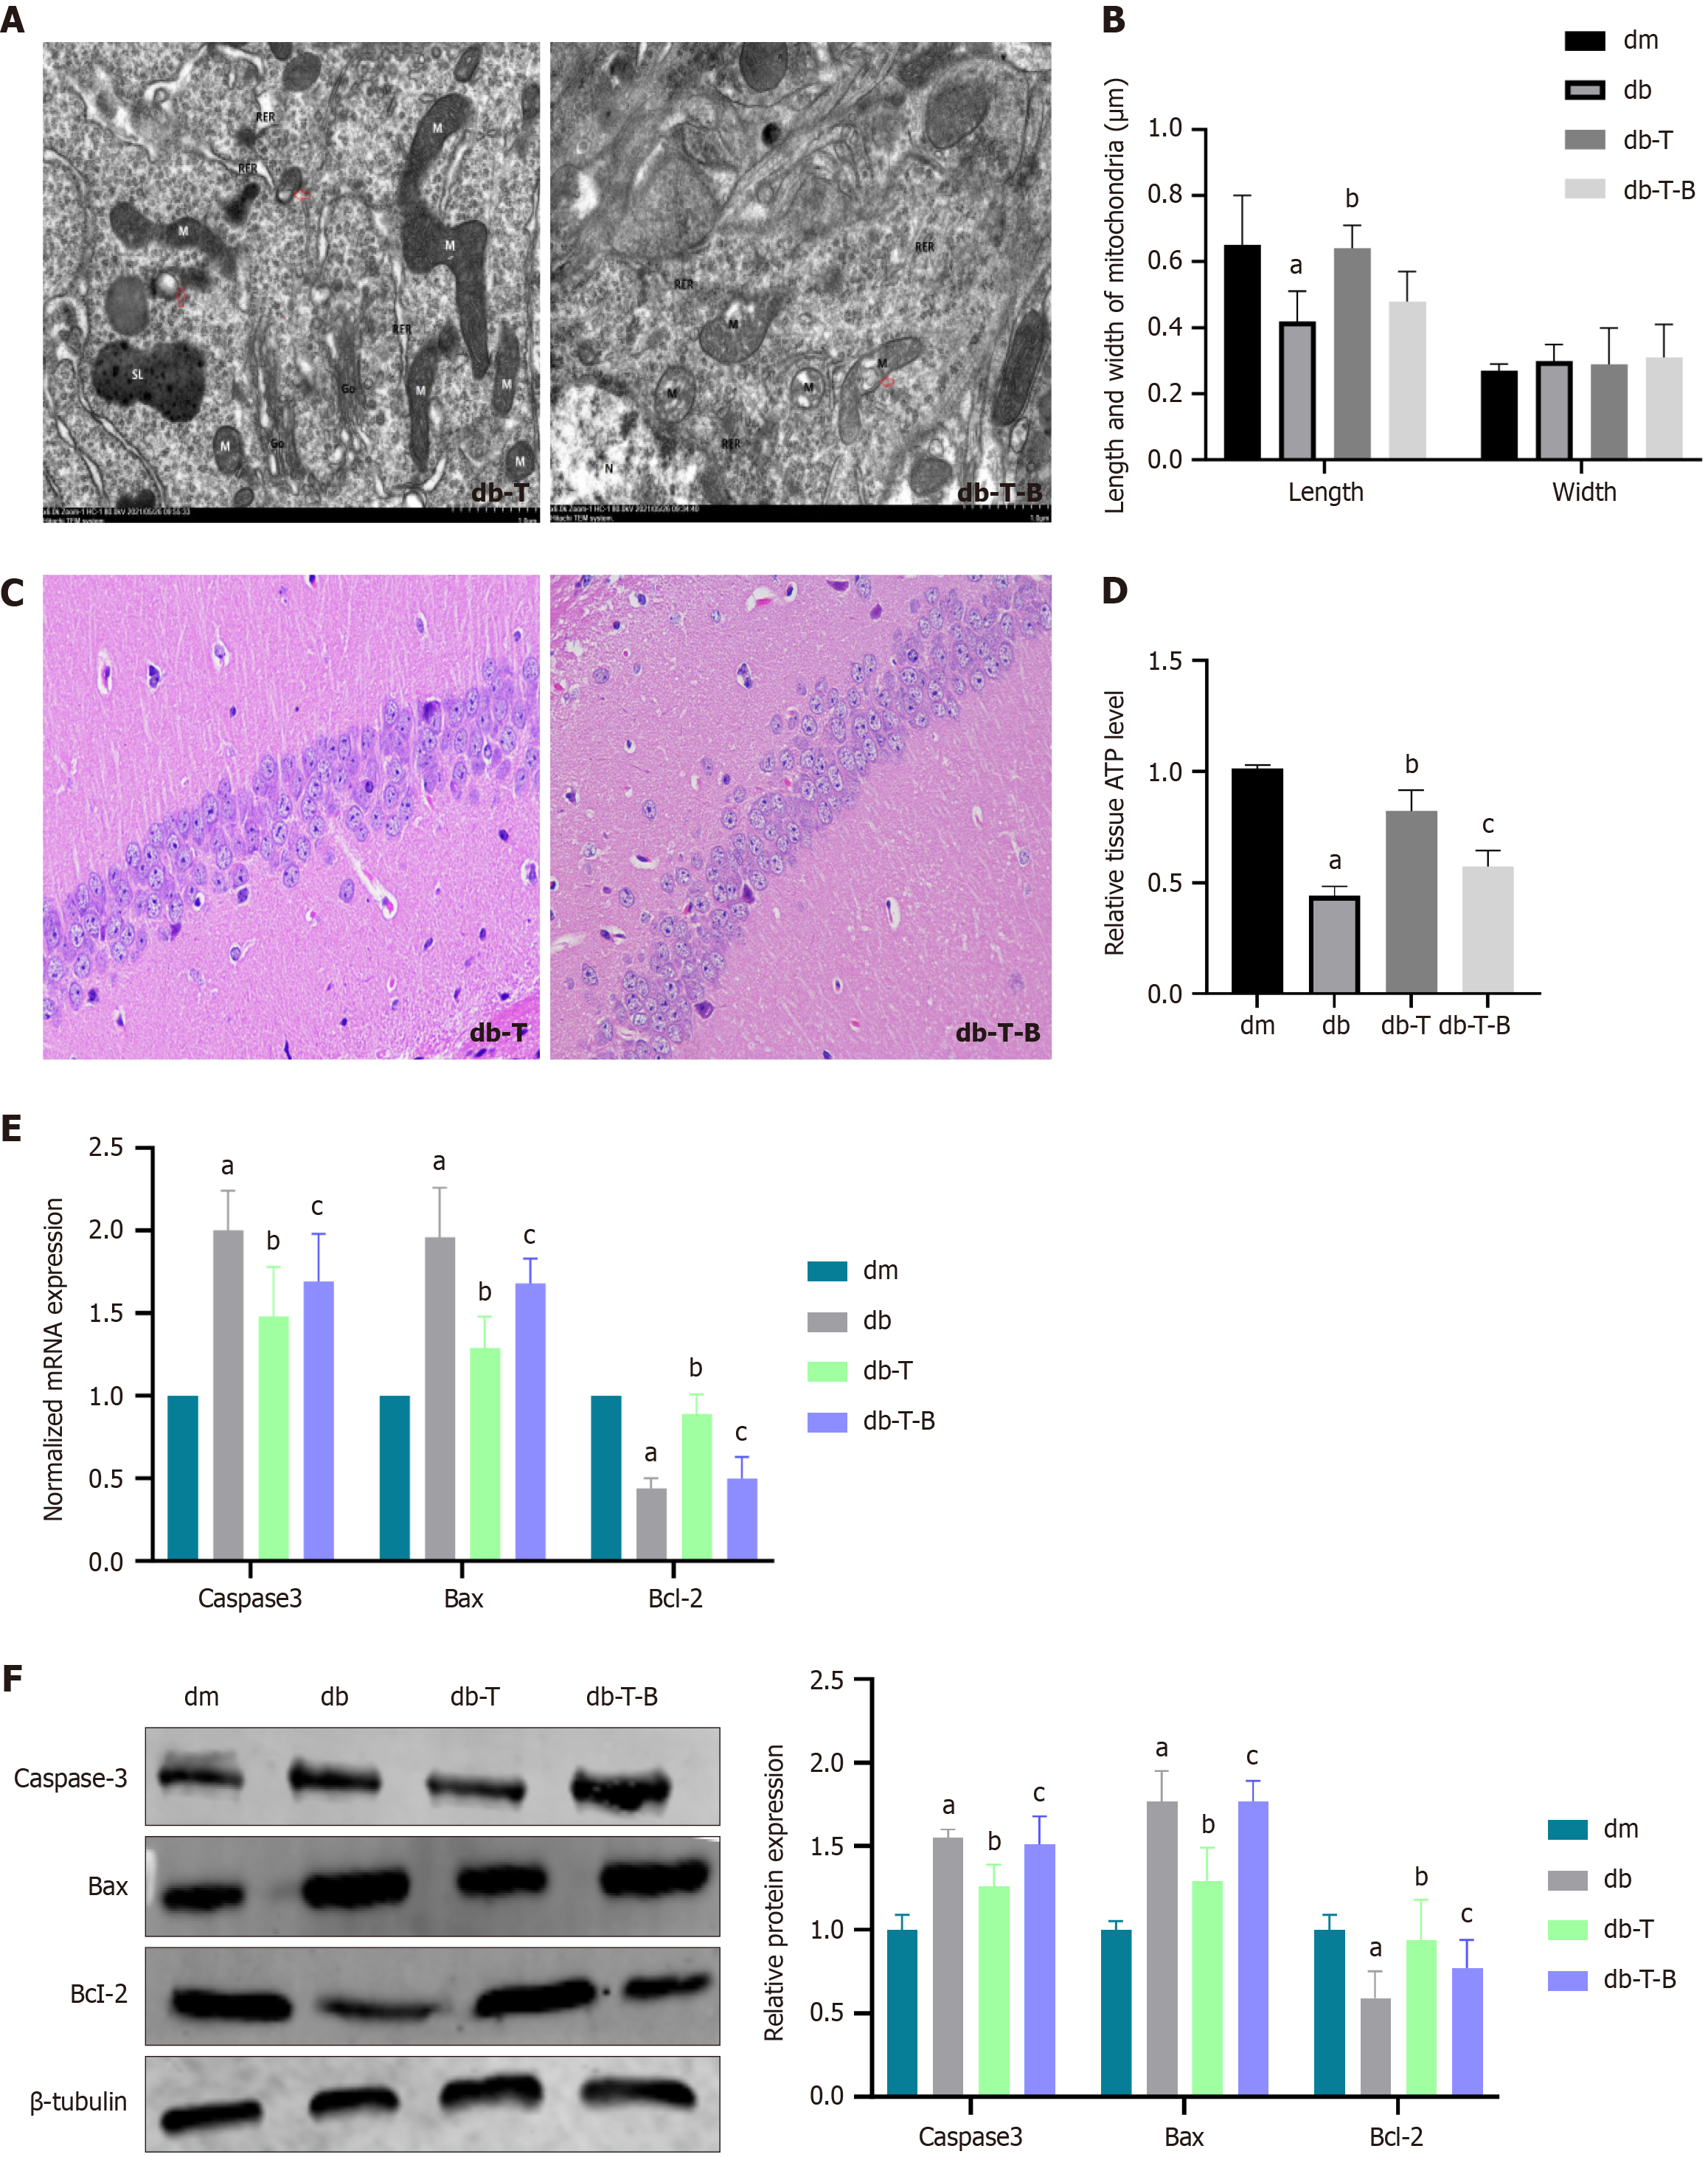
Figure 9 Troxerutin improved mitochondrial fission and cell apoptosis in the hippocampal tissue of diabetic cognitive dysfunction mice.
A: Transmission electron microscopy images show a decrease in mitochondrial fission in the hippocampal tissue of db-T group compared to db group; B: The length and width of mitochondria were measured (n = 20); C: Hematoxylin and eosin staining shows that hippocampal pyramidal cells injury was improved in db-T group compared to db group (400 ×); D: Relative of adenosine triphosphate level; E: The normalized mRNA expression of caspase-3, B-cell lymphoma 2 (Bcl-2)-associated X protein (Bax), and Bcl-2; F: The relative protein expression of The relative protein expression of caspase-3, Bcl-2-associated X protein, and Bcl-2. Bradykinin is a transient receptor potential melastatin 7 agonist, and its addition diminished the neuroprotective effect of troxerutin. aP < 0.05, compared with dm group; bP < 0.05, compared with diabetes group; cP < 0.05, compared with diabetes + troxerutin group. Data presented as mean ± SEM. dm: Control group; dm-T: Control + troxerutin group; db: Diabetes group; db-T: Diabetes + troxerutin group; db-T-B: Diabetes + troxerutin + bradykinin group; Bax: B-cell lymphoma 2-associated X protein; Bcl-2: B-cell lymphoma 2.
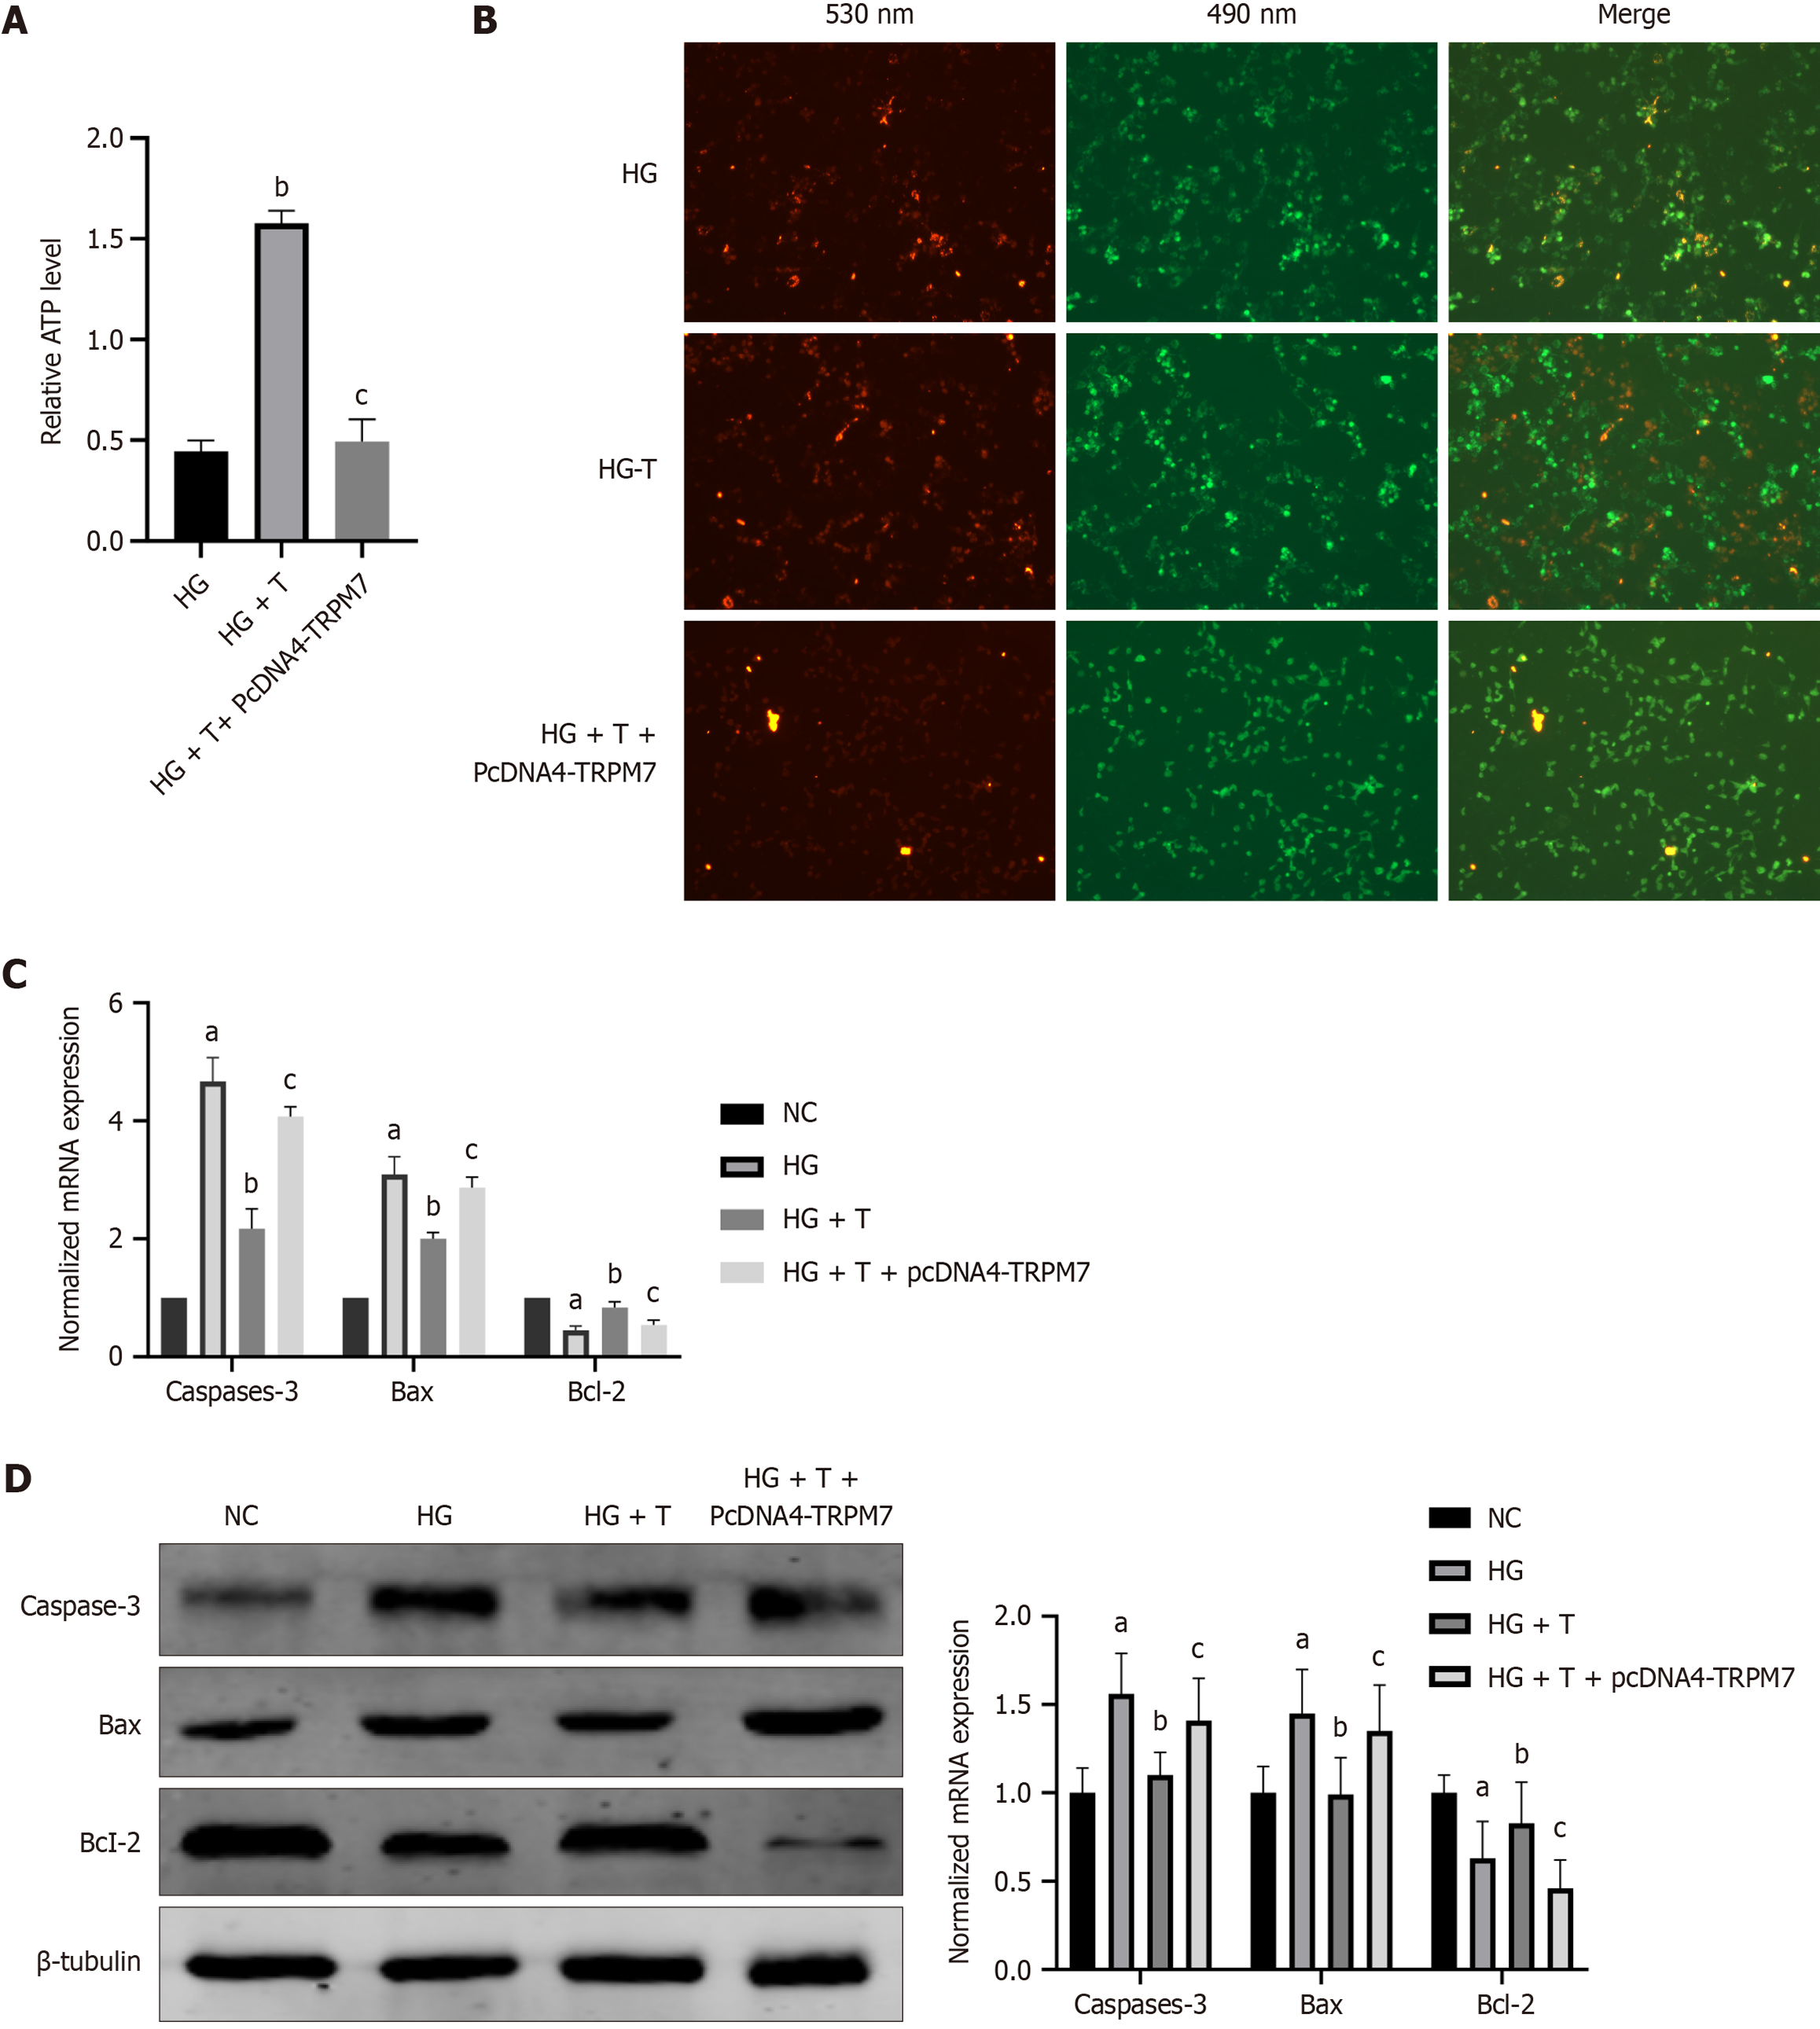
Figure 10 Troxerutin improves mitochondrial energy metabolism abnormality and cell apoptosis induced by high-concentration glucose in hippocampal neuronal cells.
A: Relative of adenosine triphosphate level; B: The normalized mRNA expression of caspase-3, B-cell lymphoma 2 (Bcl-2)-associated X protein (Bax), and Bcl-2; C: The red fluorescence increased in the diabetes + troxerutin group, indicating an increase in mitochondrial membrane potential and a decrease in apoptotic cells; D: The relative protein expression of caspase-3, Bcl-2-associated X protein, and Bcl-2. Consistent with the animal results, the aforementioned effect of troxerutin was attenuated after overexpressing transient receptor potential melastatin 7. aP < 0.05, compared with normal control group; bP < 0.05, compared with high-concentration glucose group; cP < 0.05, compared with high-concentration glucose + troxerutin group. Data presented as mean ± SEM. TRPM7: Transient receptor potential melastatin 7; ATP: Adenosine triphosphate; NC: Normal control; HG: Hypertonic group; T: Troxerutin; Bax: B-cell lymphoma 2-associated X protein; Bcl-2: B-cell lymphoma 2.
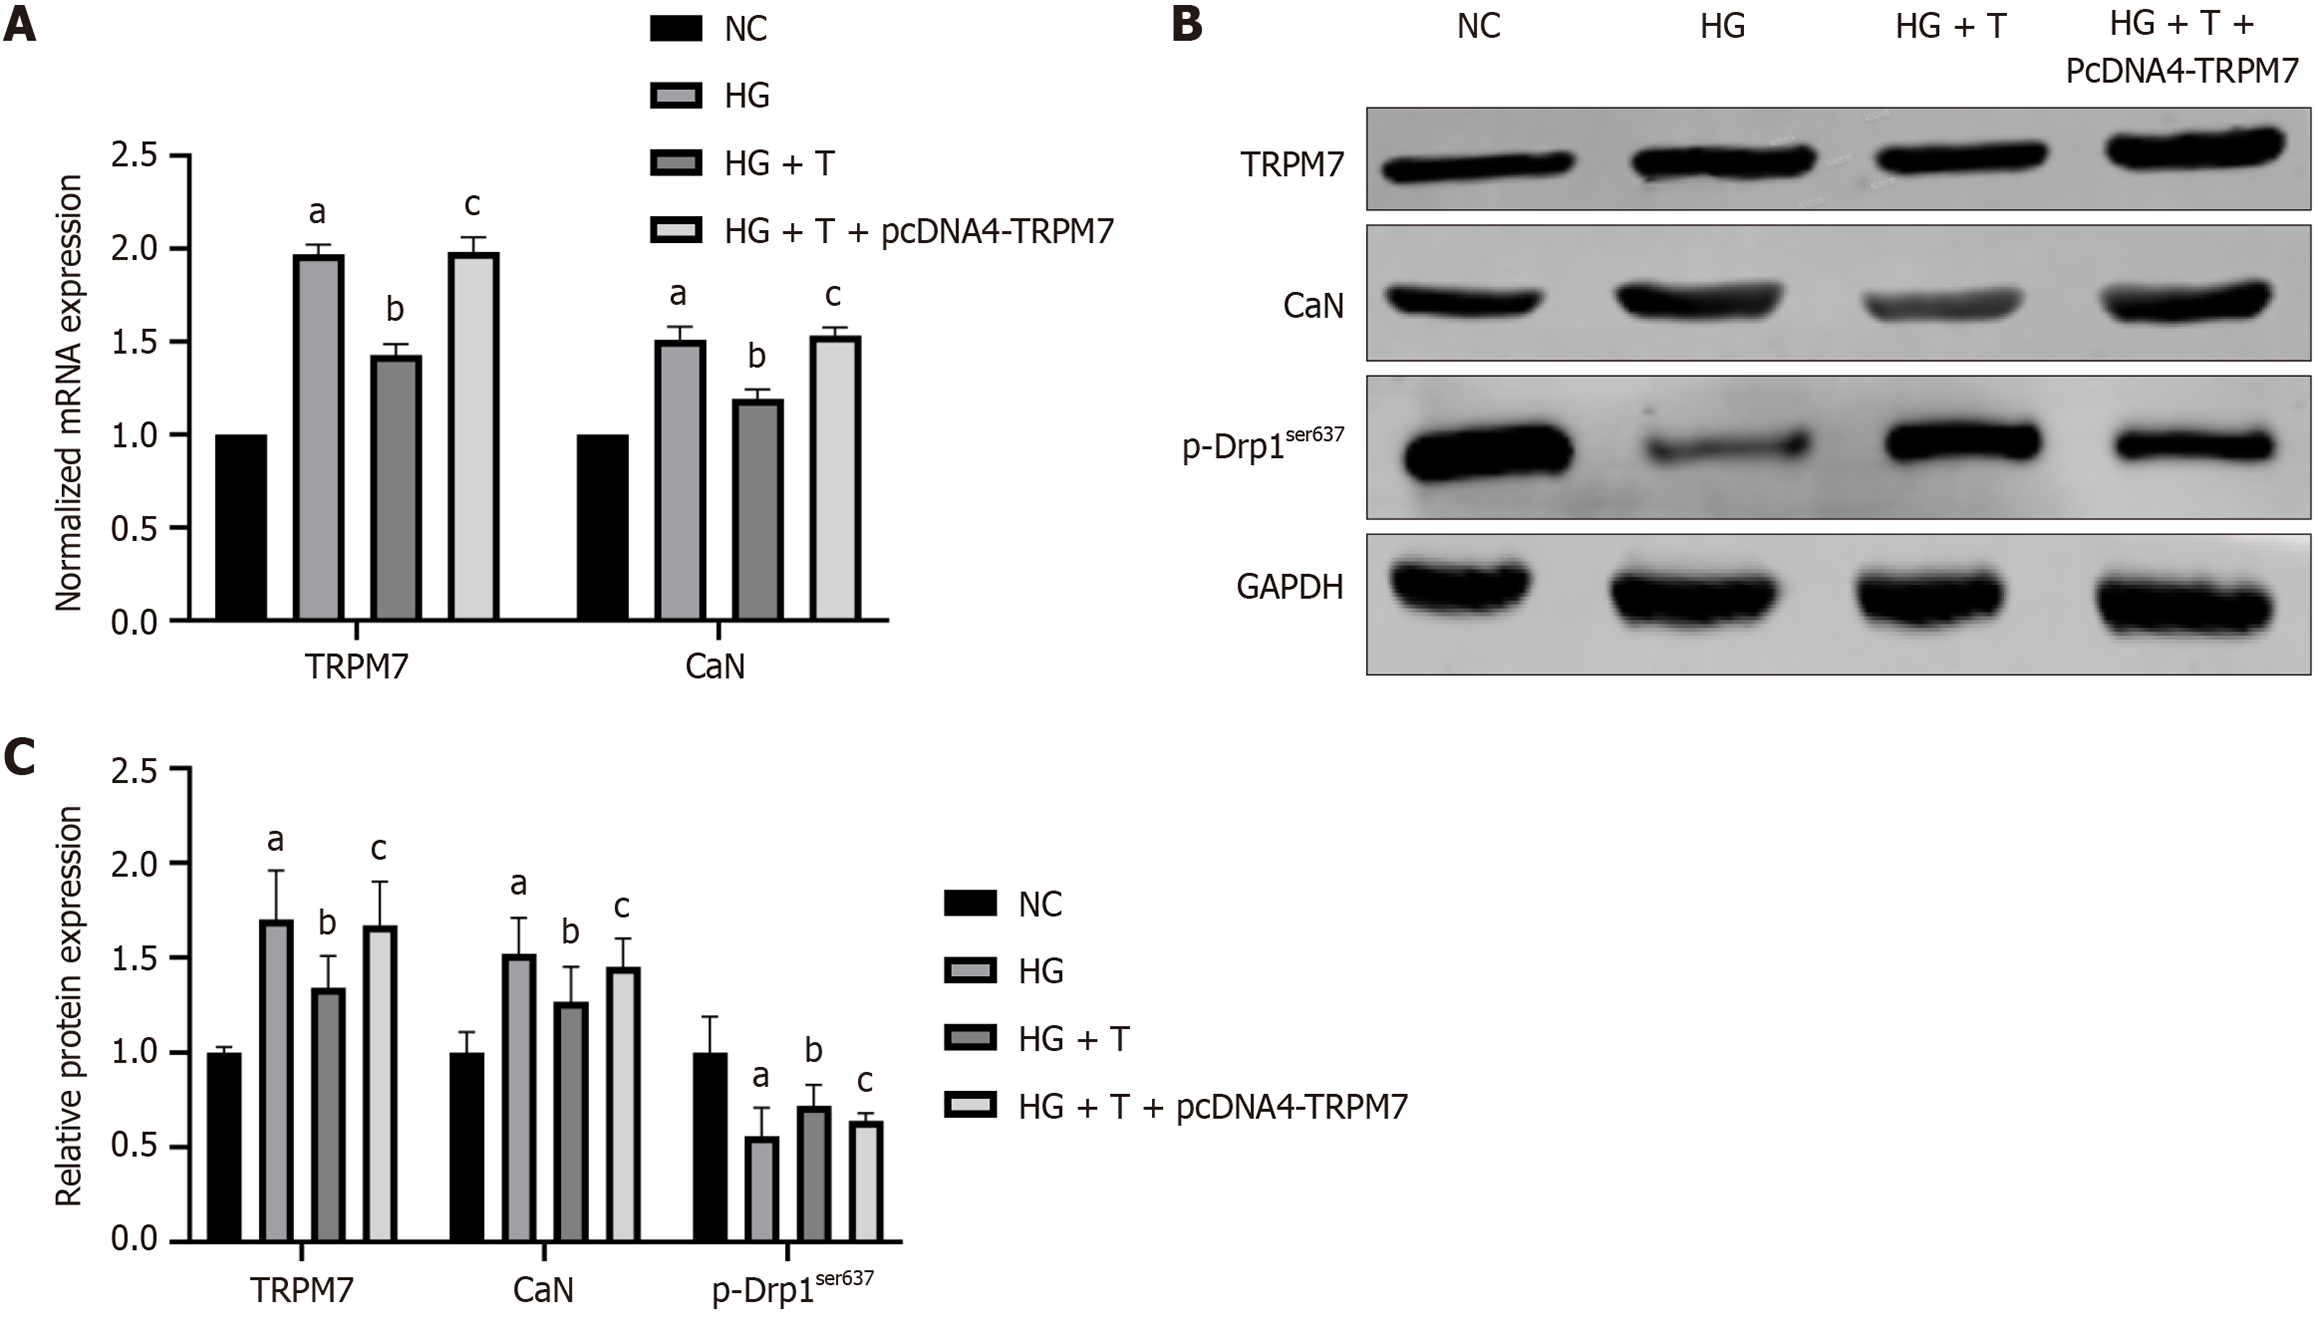
Figure 11 Troxrutin improved the expression of transient receptor potential melastatin 7/calcineurin/p-dynamin-related protein 1ser637 in high-concentration glucose-induced hippocampal neuronal cells.
A: The normalized mRNA expression of transient receptor potential melastatin 7 (TRPM7) and calcineurin (CaN); B: Protein bands of TRPM7, CaN, and p-Drp1ser637; C: The relative protein expression of TRPM7, CaN, and p-Drp1ser637. After overexpression of TRPM7, the above effects of troxrutin were weakened. aP < 0.05, compared with normal control group; bP < 0.05, compared with high-concentration glucose group; cP < 0.05, compared with high-concentration glucose + troxerutin group. Data presented as mean ± SEM. TRPM7: Transient receptor potential melastatin 7; Drp1: Dynamin-related protein 1; CaN: Calcineurin; NC: Normal control; HG: Hypertonic group; T: Troxerutin.
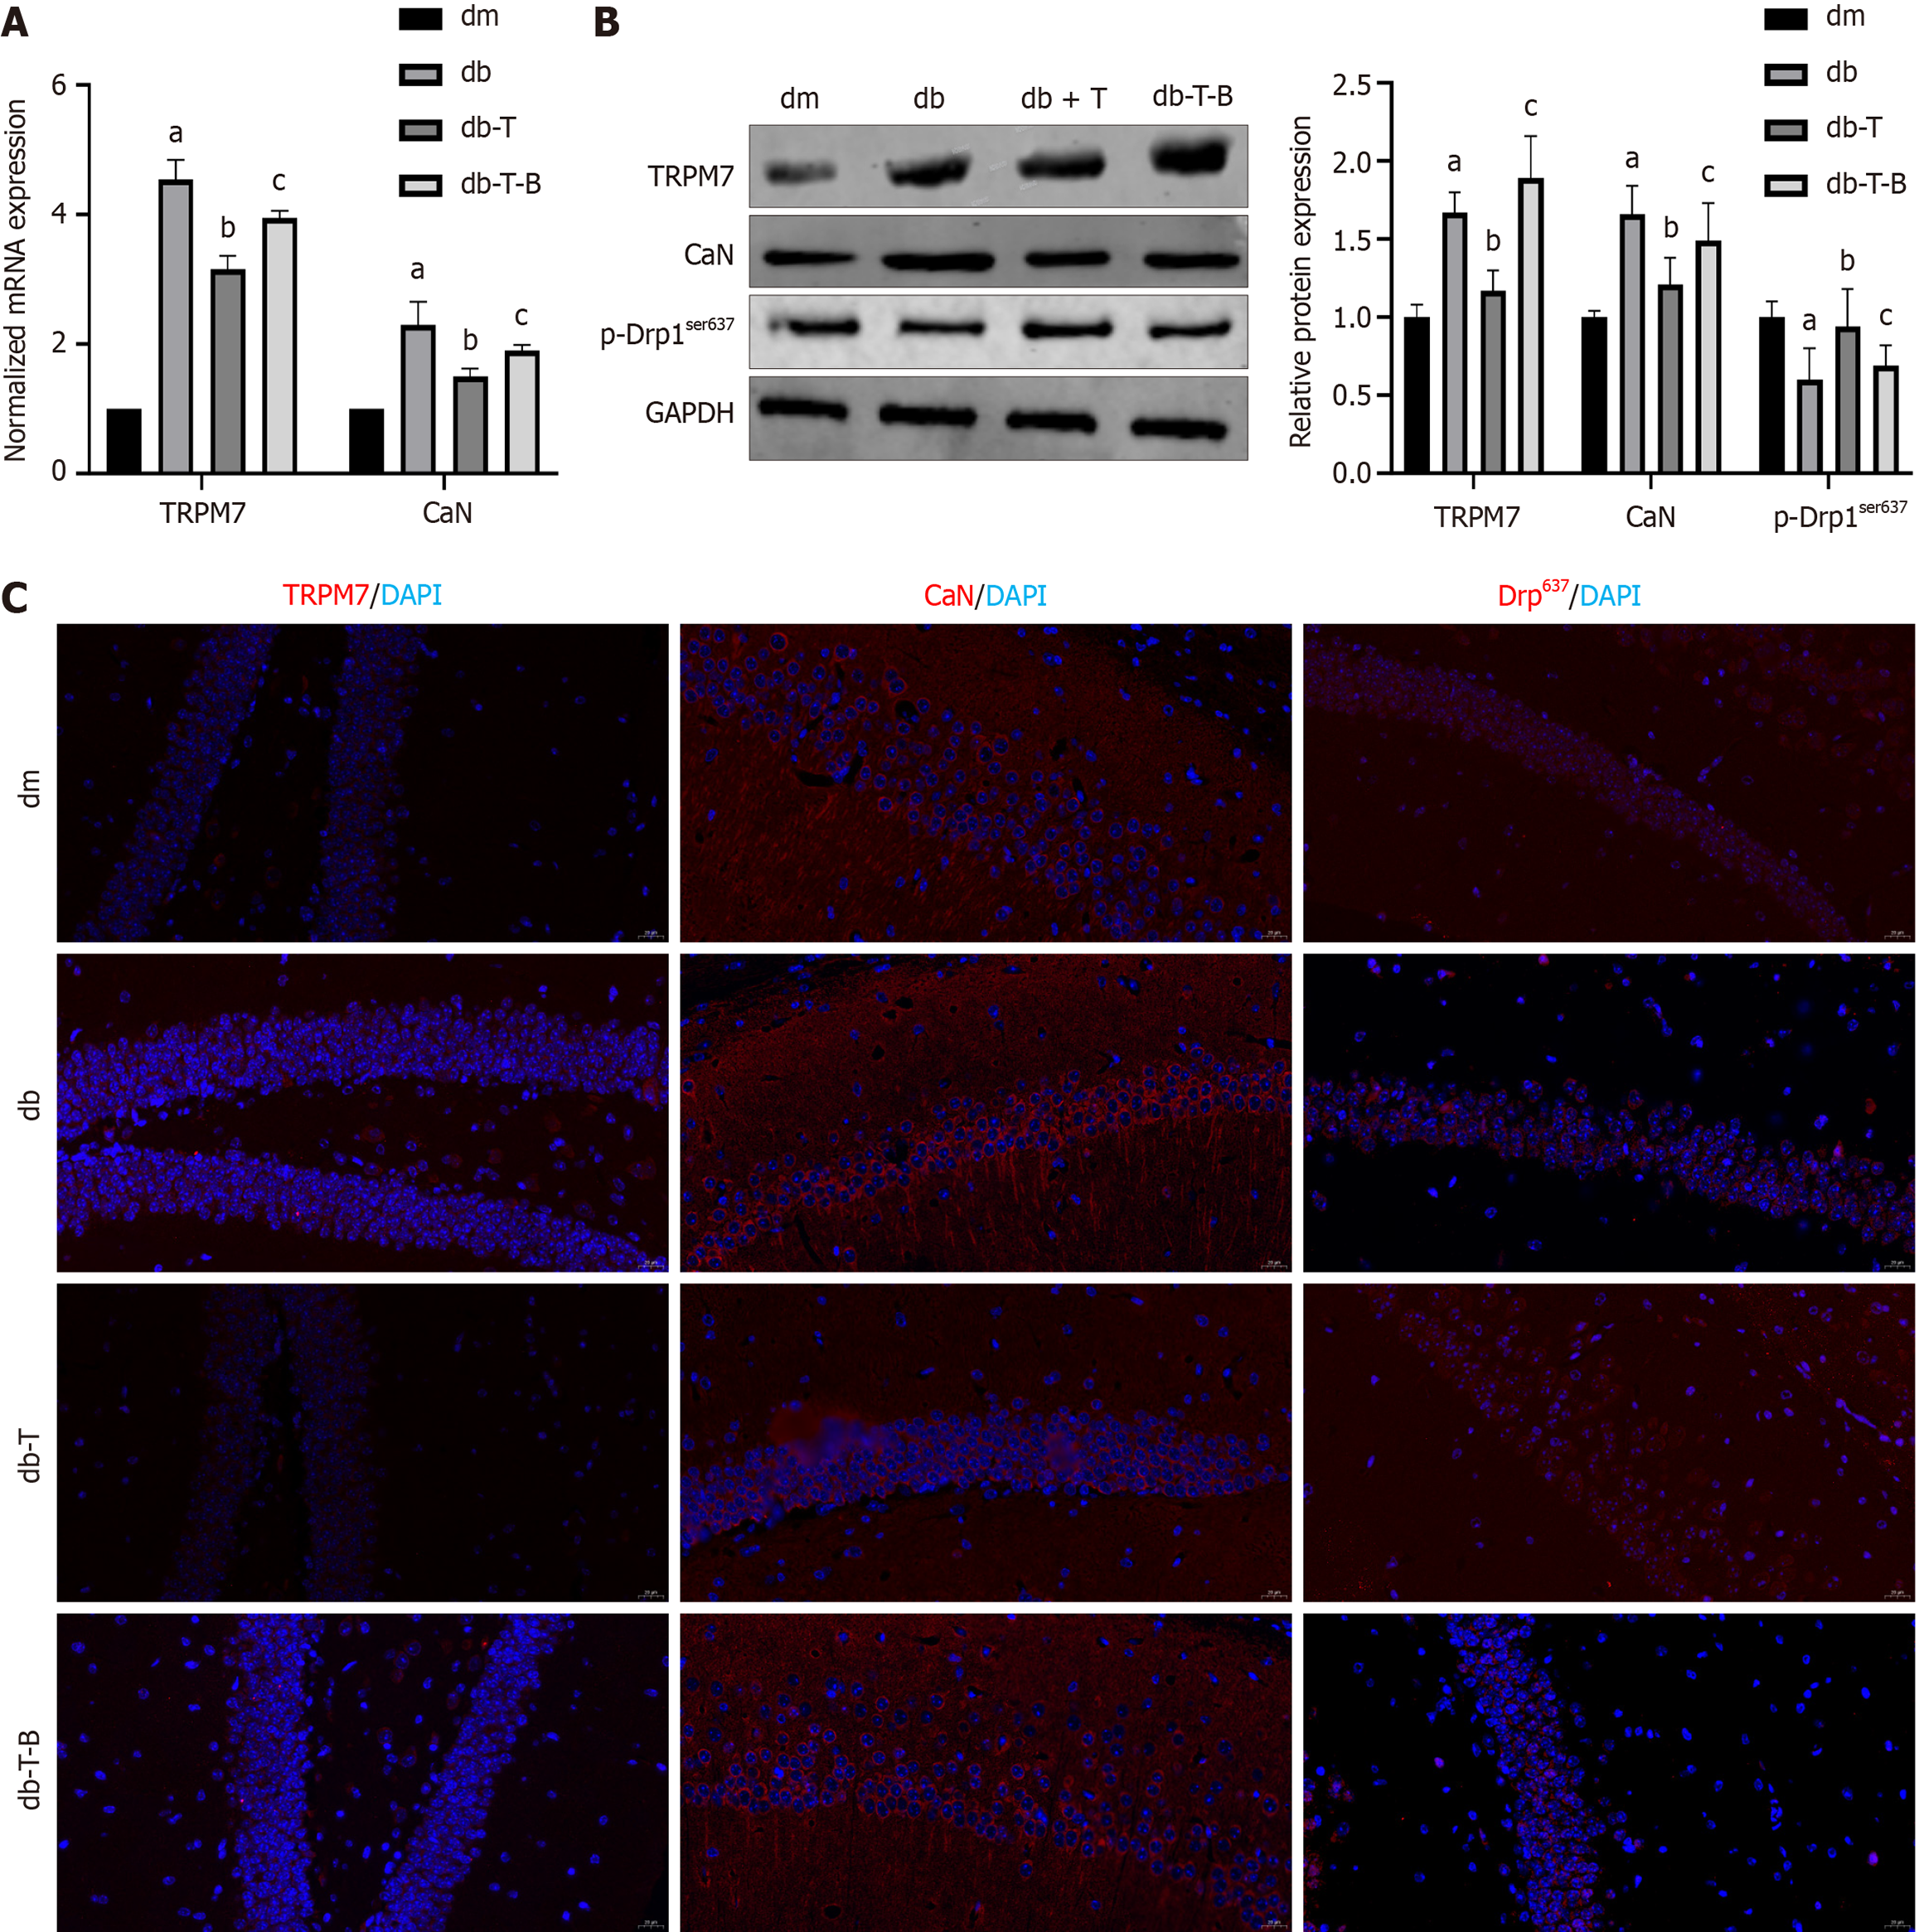
Figure 12 Troxrutin improved diabetic cognitive dysfunction by inhibiting the transient receptor potential melastatin 7/calcineurin/p-dynamin-related protein 1ser637 pathway.
A: The normalized mRNA expression of transient receptor potential melastatin 7 (TRPM7) and calcineurin (CaN); B: The relative protein expression of TRPM7, CaN, and p-Drp1ser637; C: Immunofluorescent staining of TRPM7, CaN, and p-Drp1ser637. aP < 0.05, compared with control group; bP < 0.05, compared with diabetes group; cP < 0.05, compared with diabetes + troxerutin group. Data presented as mean ± SEM. TRPM7: Transient receptor potential melastatin 7; Drp1: Dynamin-related protein 1; CaN: Calcineurin; GAPDH: Glyceraldehyde-3-phosphate dehydrogenase; DAPI: 4’,6-diamidino-2-phenylindole; dm: Control group; dm-T: Control + troxerutin group; db: Diabetes group; db-T: Diabetes + troxerutin group; db-T-B: Diabetes + troxerutin + bradykinin group.
- Citation: Li J, Gao M, Wang JX, Li HY, Wang P, Yuan F, Liu AJ, Zhang SY. Troxerutin improves diabetic cognitive dysfunction by inhibiting mitochondrial fission mediated by transient receptor potential melastatin 7/calcineurin/dynamin-related protein 1ser637. World J Diabetes 2025; 16(8): 106833
- URL: https://www.wjgnet.com/1948-9358/full/v16/i8/106833.htm
- DOI: https://dx.doi.org/10.4239/wjd.v16.i8.106833


