Copyright
©The Author(s) 2025.
World J Diabetes. May 15, 2025; 16(5): 103244
Published online May 15, 2025. doi: 10.4239/wjd.v16.i5.103244
Published online May 15, 2025. doi: 10.4239/wjd.v16.i5.103244
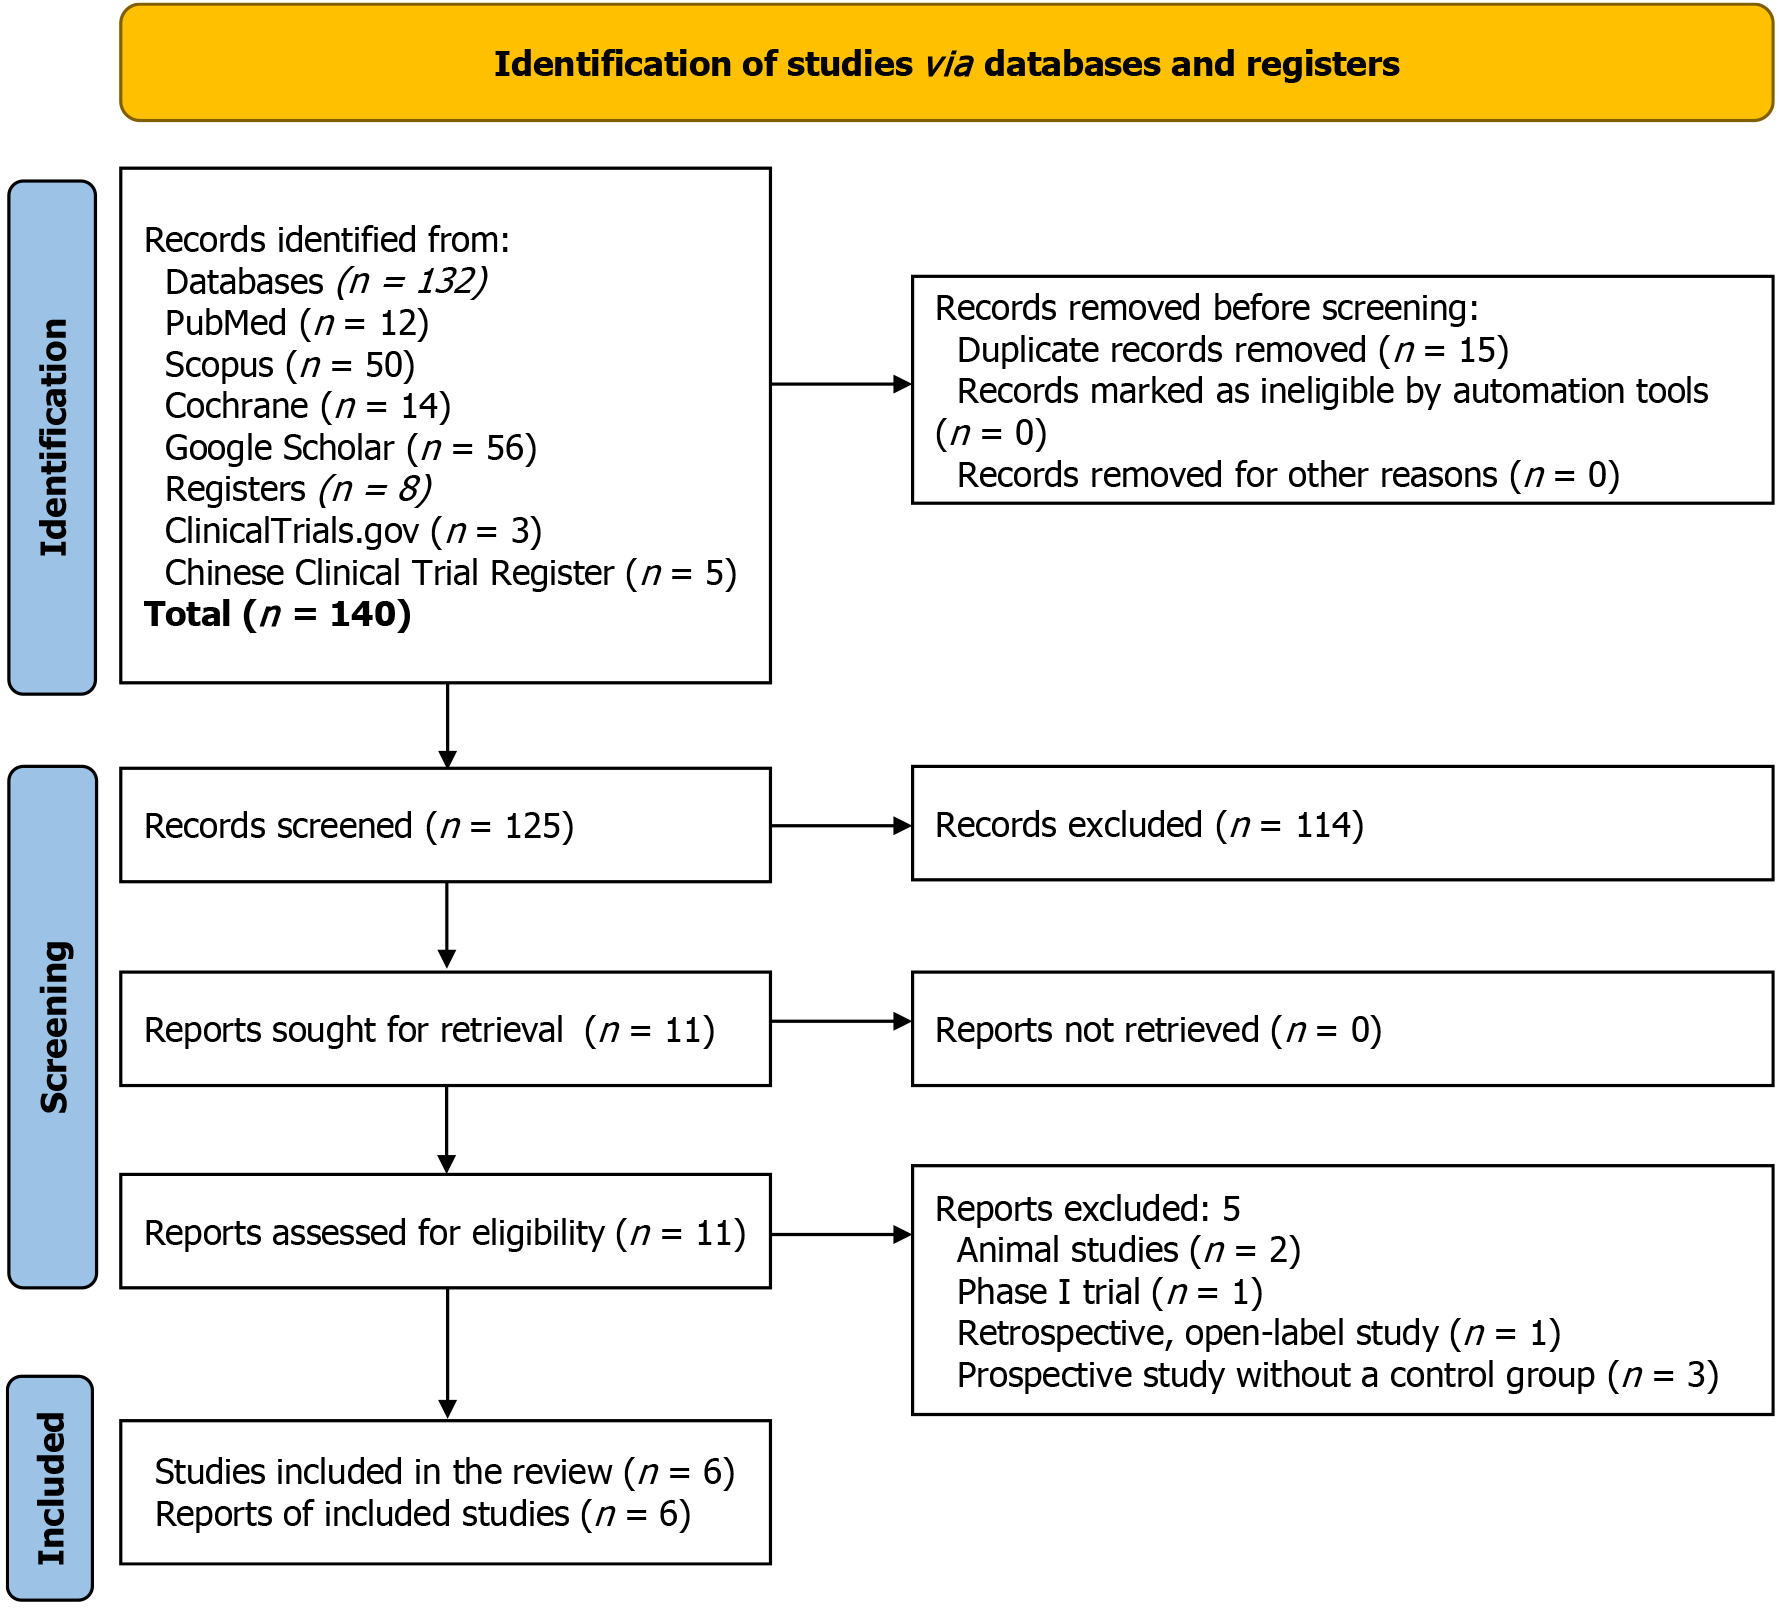
Figure 1
Flowchart on study retrieval and inclusion in the meta-analysis.
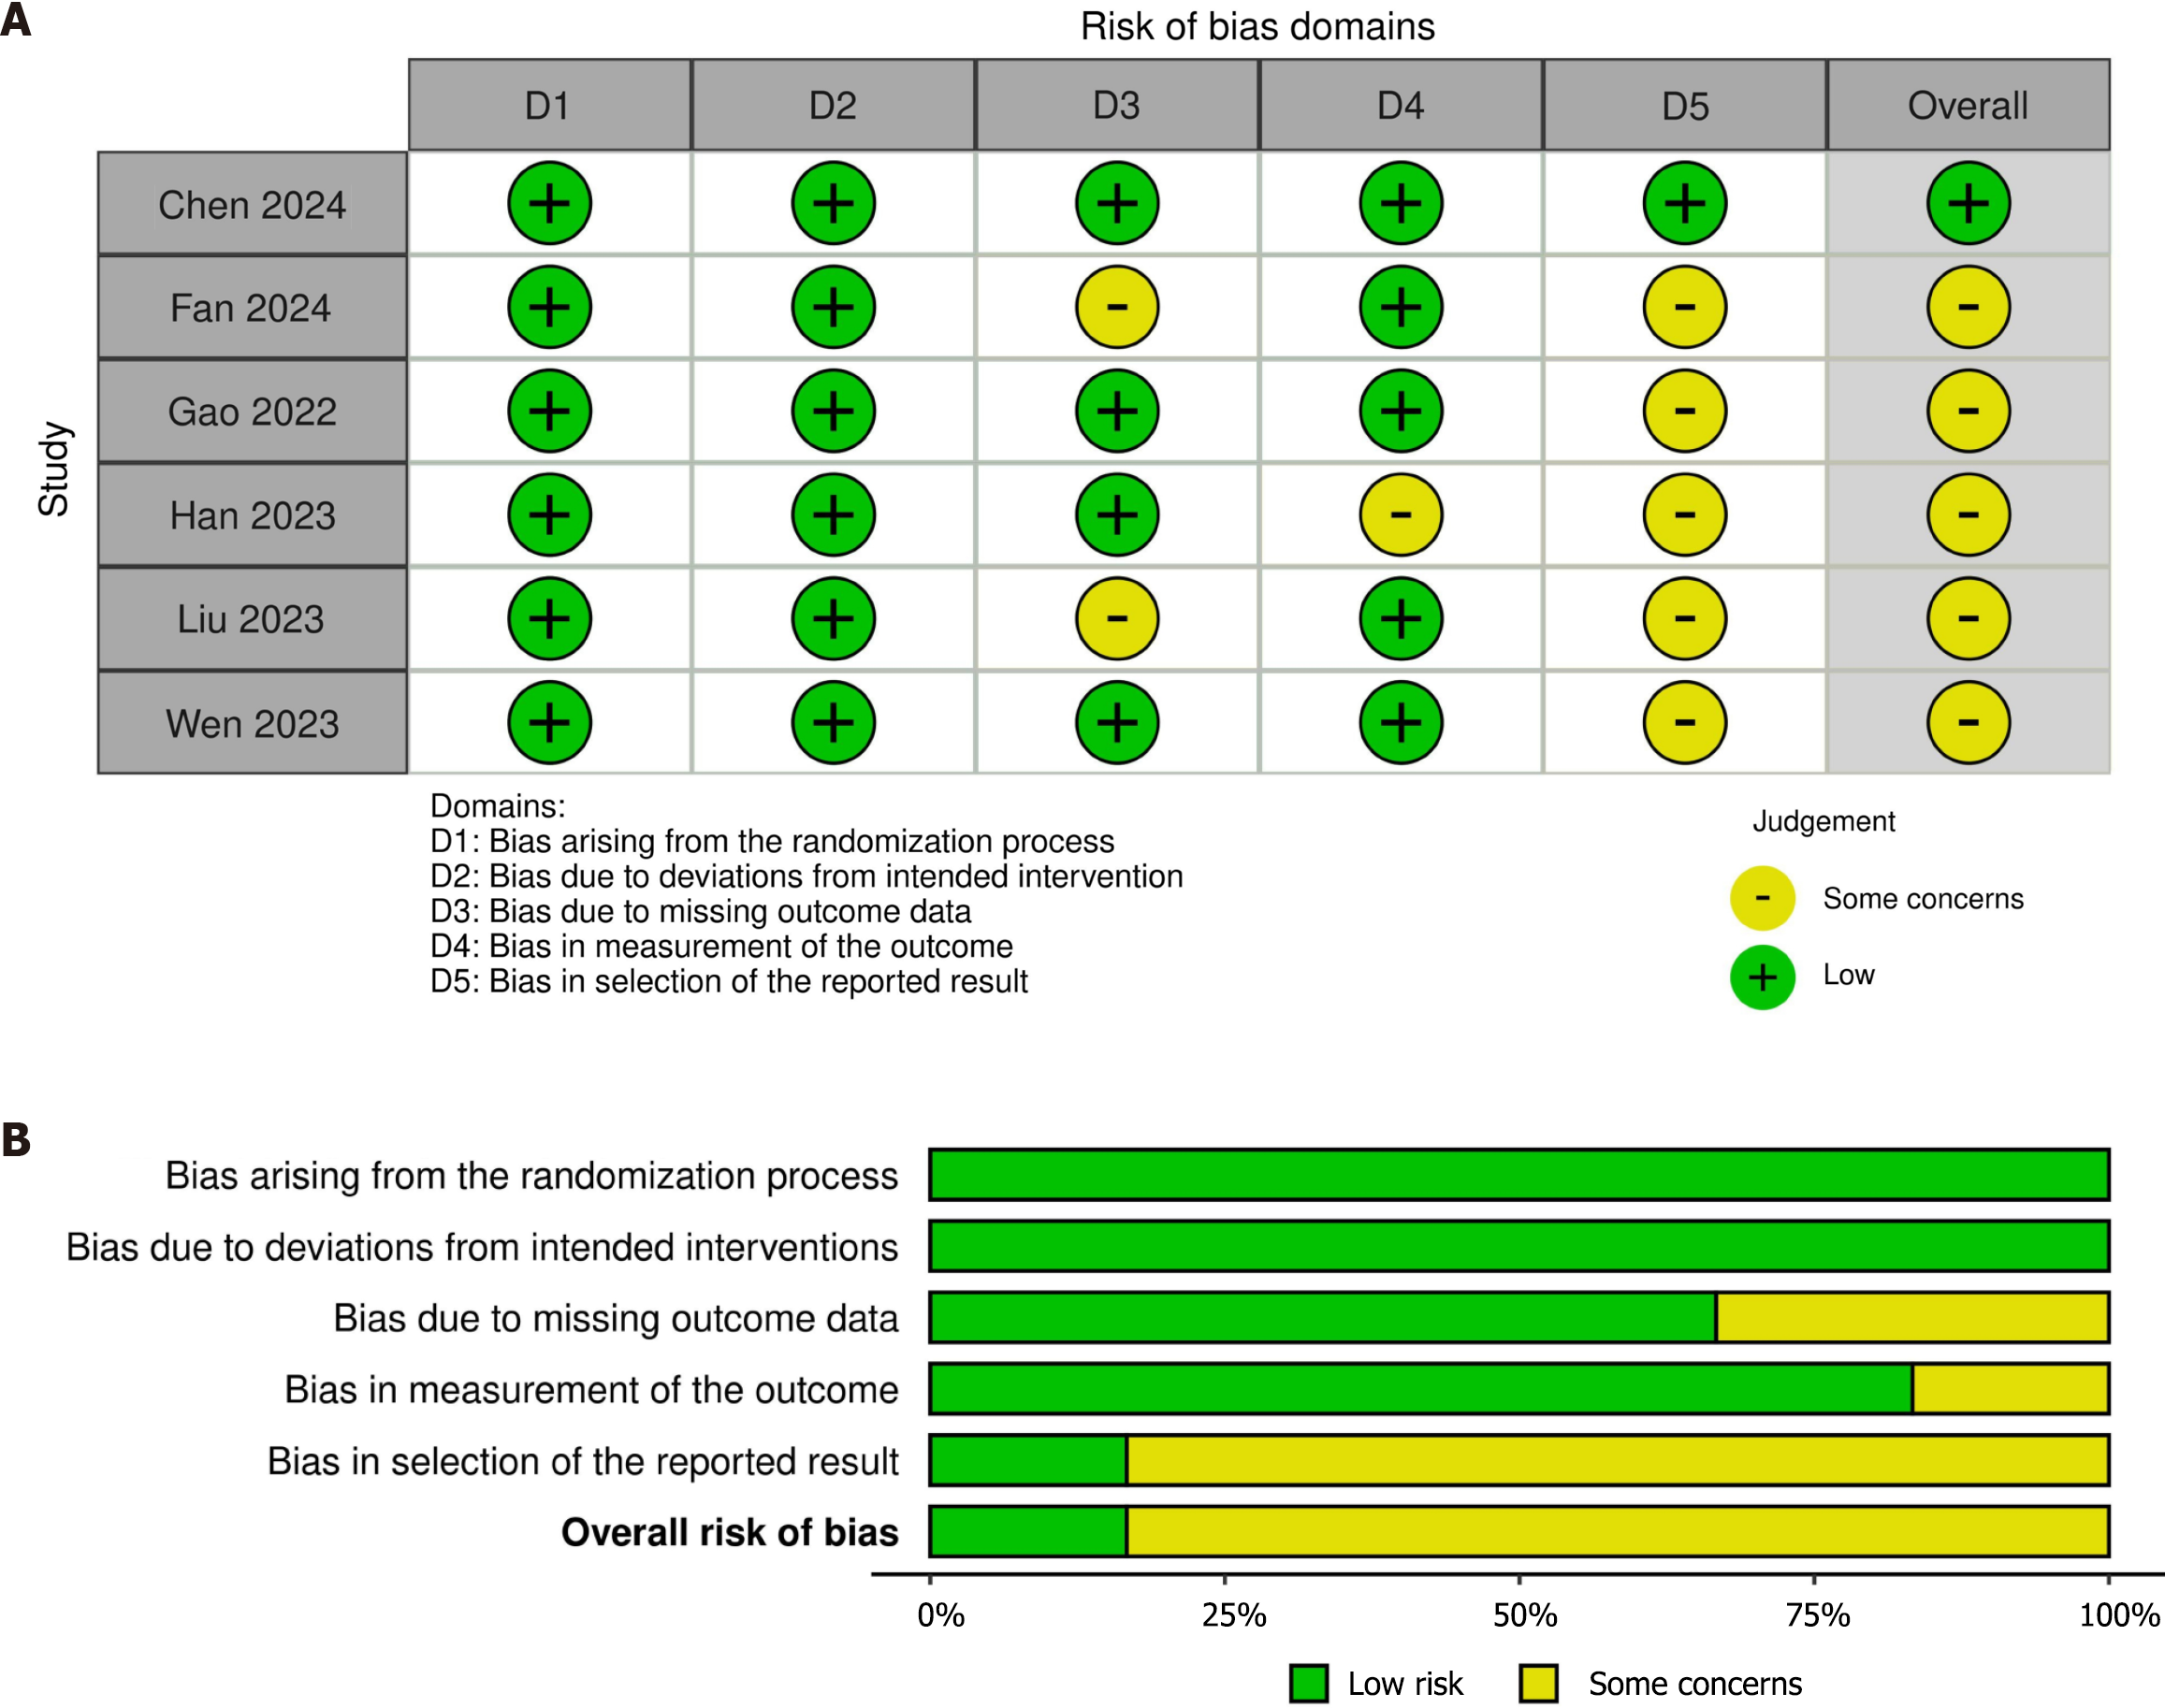
Figure 2 Specific and overall risk of bias in the six randomized controlled trials.
A: Risk of bias summary: Review authors’ judgments about each risk of bias item for each included study; B: Risk of bias graph: Review authors’ judgments about each risk of bias item presented as percentages across all included studies.
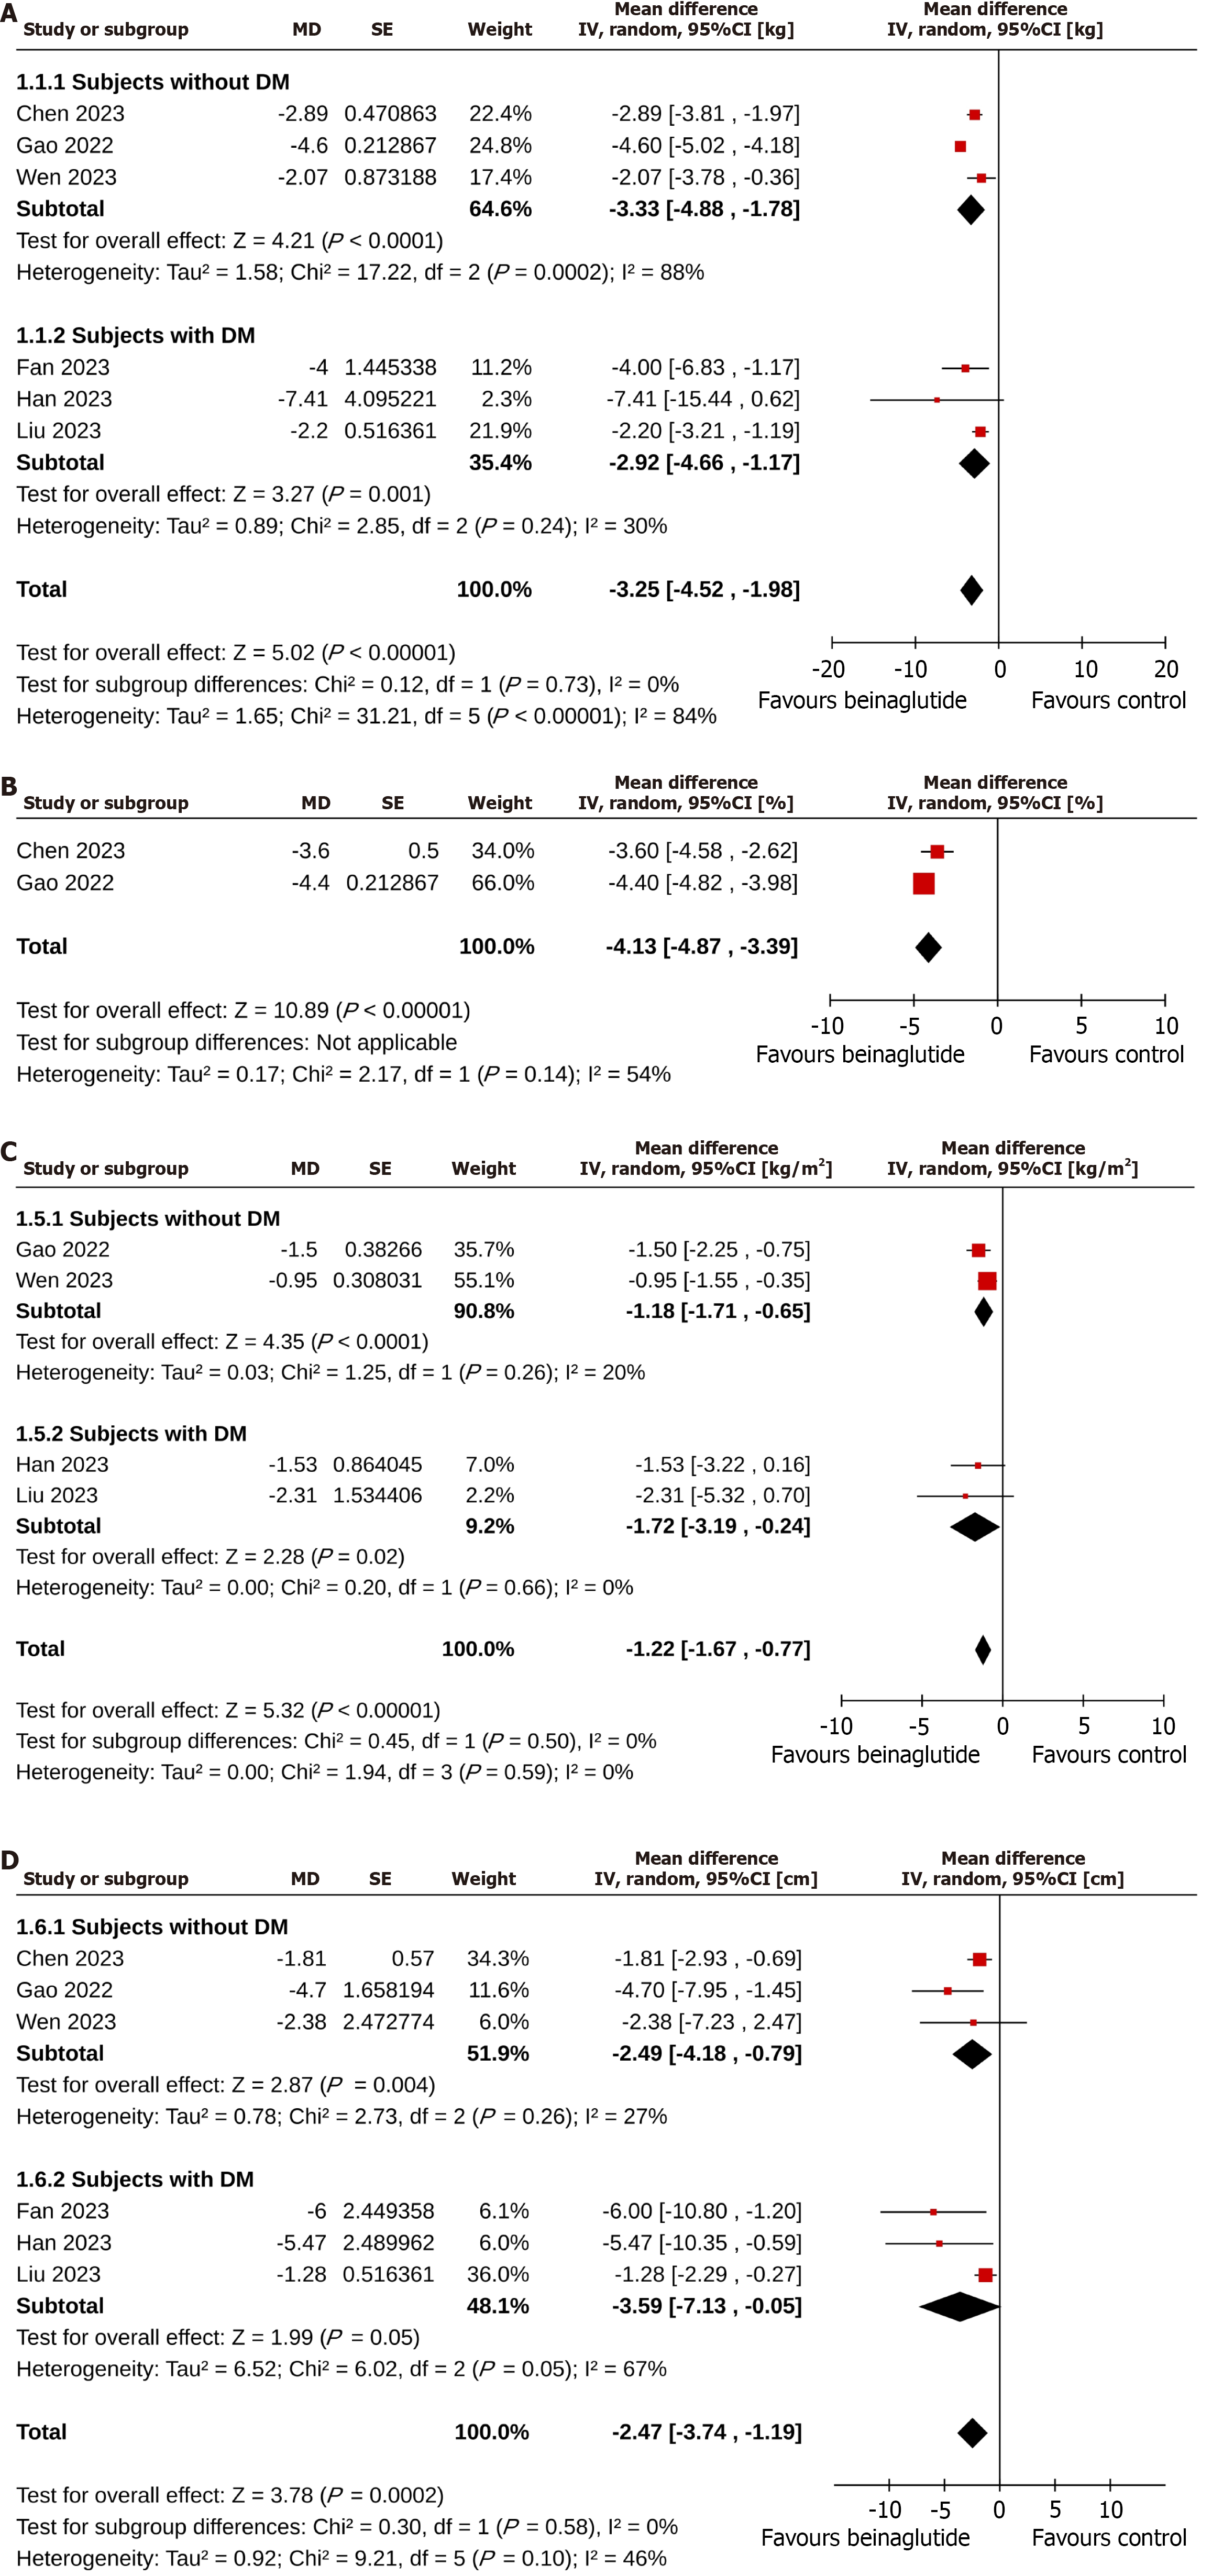
Figure 3 Forest plots comparing beinaglutide vs the control group regarding the changes from baseline at the trials.
A: Body weight; B: Percent body weight; C: Body mass index; D: Waist circumference. MD: Mean difference; 95%CI: 95% confidence interval; SE: Standard error.
- Citation: Kamrul-Hasan ABM, Ganakumar V, Nagendra L, Dutta D, Islam MR, Pappachan JM. Effect of beinaglutide, a thrice-daily GLP-1 receptor agonist, on body weight and metabolic parameters: A systematic review and meta-analysis. World J Diabetes 2025; 16(5): 103244
- URL: https://www.wjgnet.com/1948-9358/full/v16/i5/103244.htm
- DOI: https://dx.doi.org/10.4239/wjd.v16.i5.103244


