Copyright
©The Author(s) 2025.
World J Diabetes. May 15, 2025; 16(5): 101447
Published online May 15, 2025. doi: 10.4239/wjd.v16.i5.101447
Published online May 15, 2025. doi: 10.4239/wjd.v16.i5.101447
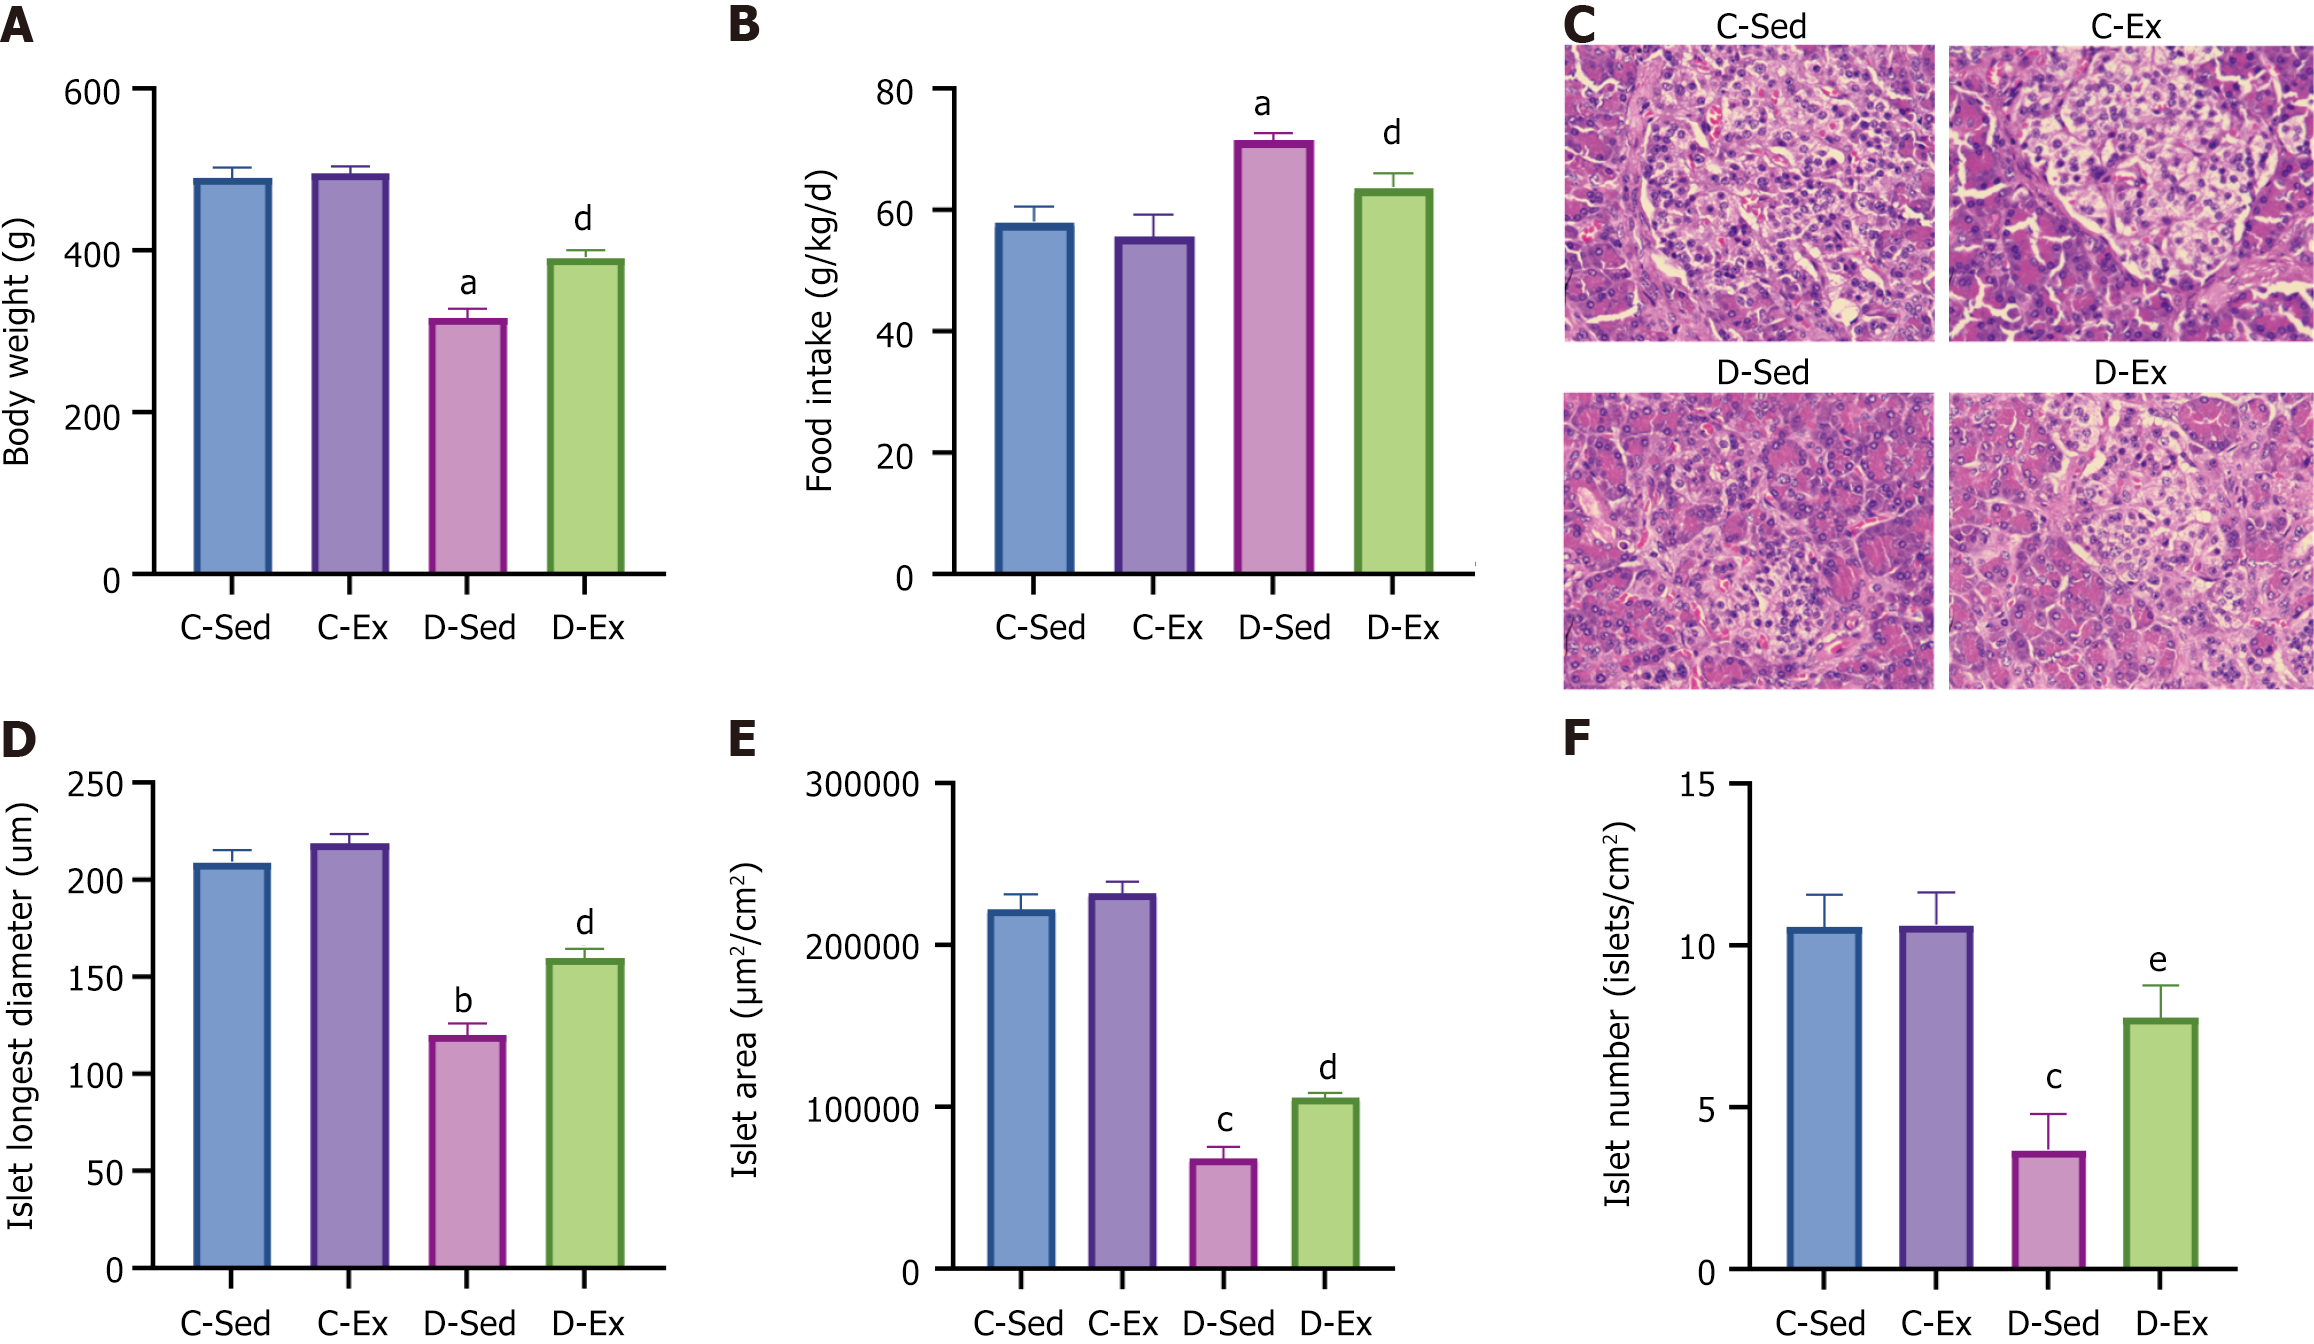
Figure 1 Features of the diabetic rat model and the impact of physical activity.
A: Measurement of rat body weight post-experiment; B: Recording of daily average food intake for rats during the experiment; C: Pancreatic morphology of rats from the four groups (× 400 magnification); D: Measurement of the islet longest diameter through observation of pancreatic sections; E: Measurement of islet area through observation of pancreatic sections; F: Measurement of islet number through observation of pancreatic sections. aP < 0.05, bP < 0.01, cP < 0.001 vs the control sedentary group; dP < 0.05, eP < 0.01 vs the diabetic sedentary group. D-Ex: The diabetic exercise group; D-Sed: The diabetic sedentary group; C-Ex: The control exercise group; C-Sed: The control sedentary group.
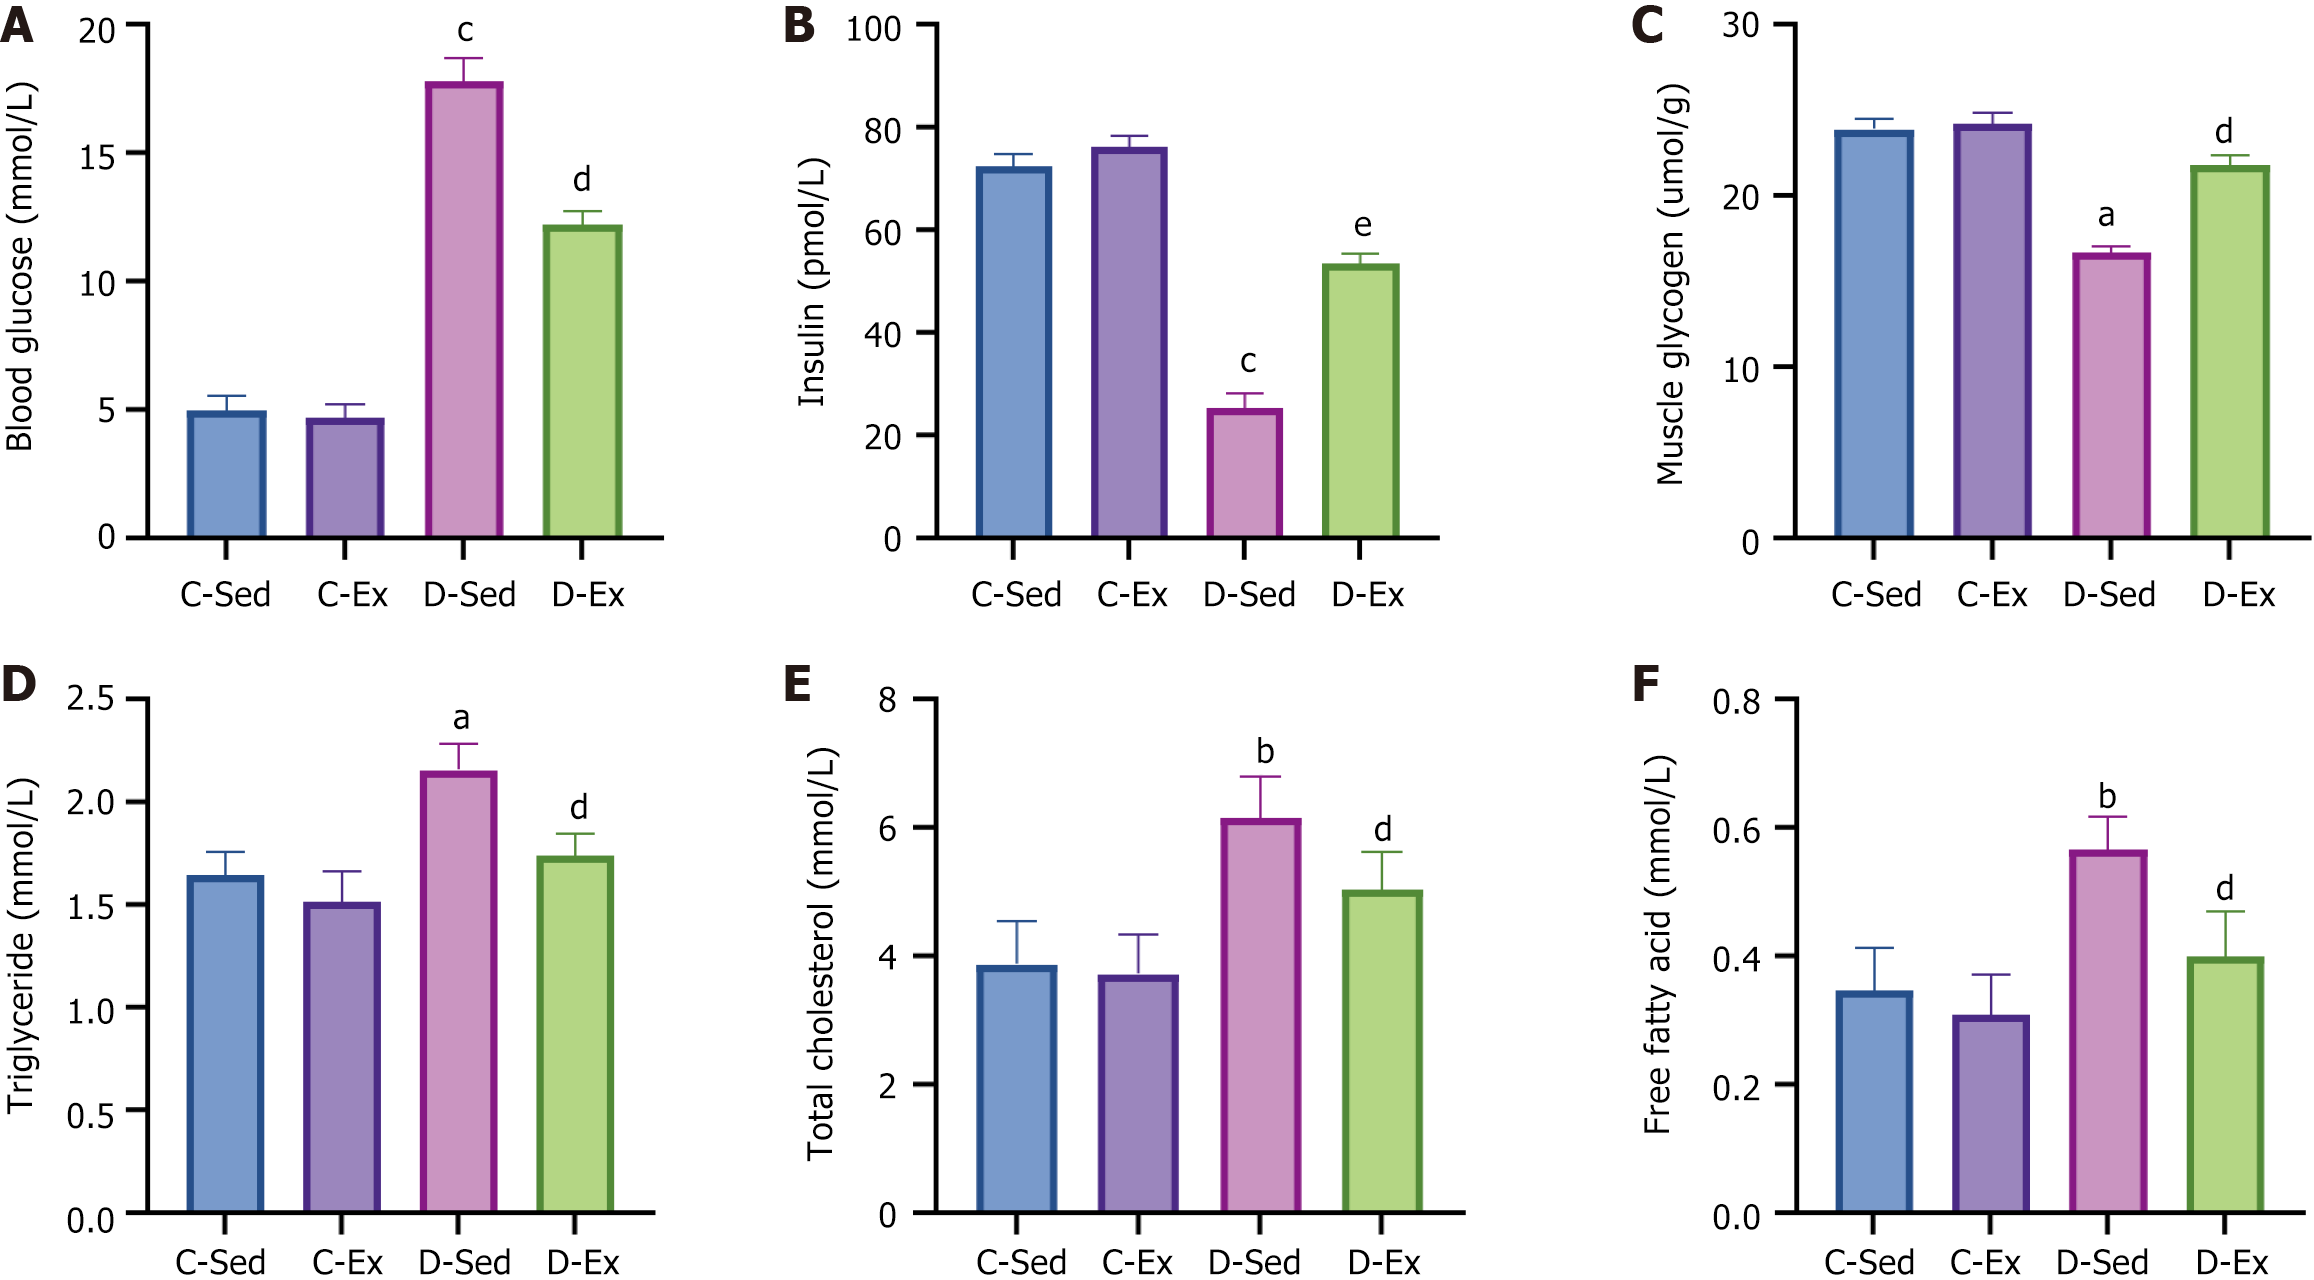
Figure 2 Serum biomarkers of rat model of diabetes and effect of exercise.
A: Measurement of blood glucose levels from blood collected via tail vein; B: Detection of insulin levels from blood collected via tail vein; C: Measurement of glycogen content from the gastrocnemius muscle; D: Detection of triglyceride concentration from blood collected via tail vein; E: Detection of total cholesterol concentration from blood collected via tail vein; F: Detection of free fatty acid concentration from blood collected via tail vein. aP < 0.05, bP < 0.01, cP < 0.001 vs the control sedentary group; dP < 0.05, eP < 0.01 vs the diabetic sedentary group. D-Ex: The diabetic exercise group; D-Sed: The diabetic sedentary group; C-Ex: The control exercise group; C-Sed: The control sedentary group.
Figure 3 Impact of diabetes and exercise on islet β-cell.
A: Microscopic measurement of islet β-cell area; B: Calculation of islet β-cell mass through the percentage of insulin-positive area multiplied by pancreatic weight; C: Determination of the size of individual islet β-cells by dividing the insulin-positive area by the number of nuclei counted in the corresponding insulin-positive structures. aP < 0.05 vs the control sedentary group; dP < 0.05 vs the diabetic sedentary group. D-Ex: The diabetic exercise group; D-Sed: The diabetic sedentary group; C-Ex: The control exercise group; C-Sed: The control sedentary group.
Figure 4 Effect of diabetes and exercise on the expression of insulin-like growth factor 1.
A: Measurement of insulin-like growth factor 1 (IGF-1) mRNA levels through real-time quantitative polymerase chain reaction; B: Determination of IGF-1 protein levels through Western blot. bP < 0.01 vs the control sedentary group; dP < 0.05 vs the diabetic sedentary group. IGF-1: Insulin-like growth factor 1; RT-qPCR: Real-time quantitative polymerase chain reaction; GADPH: Glyceraldehyde-3-phosphate dehydrogenase; D-Ex: The diabetic exercise group; D-Sed: The diabetic sedentary group; C-Ex: The control exercise group; C-Sed: The control sedentary group.
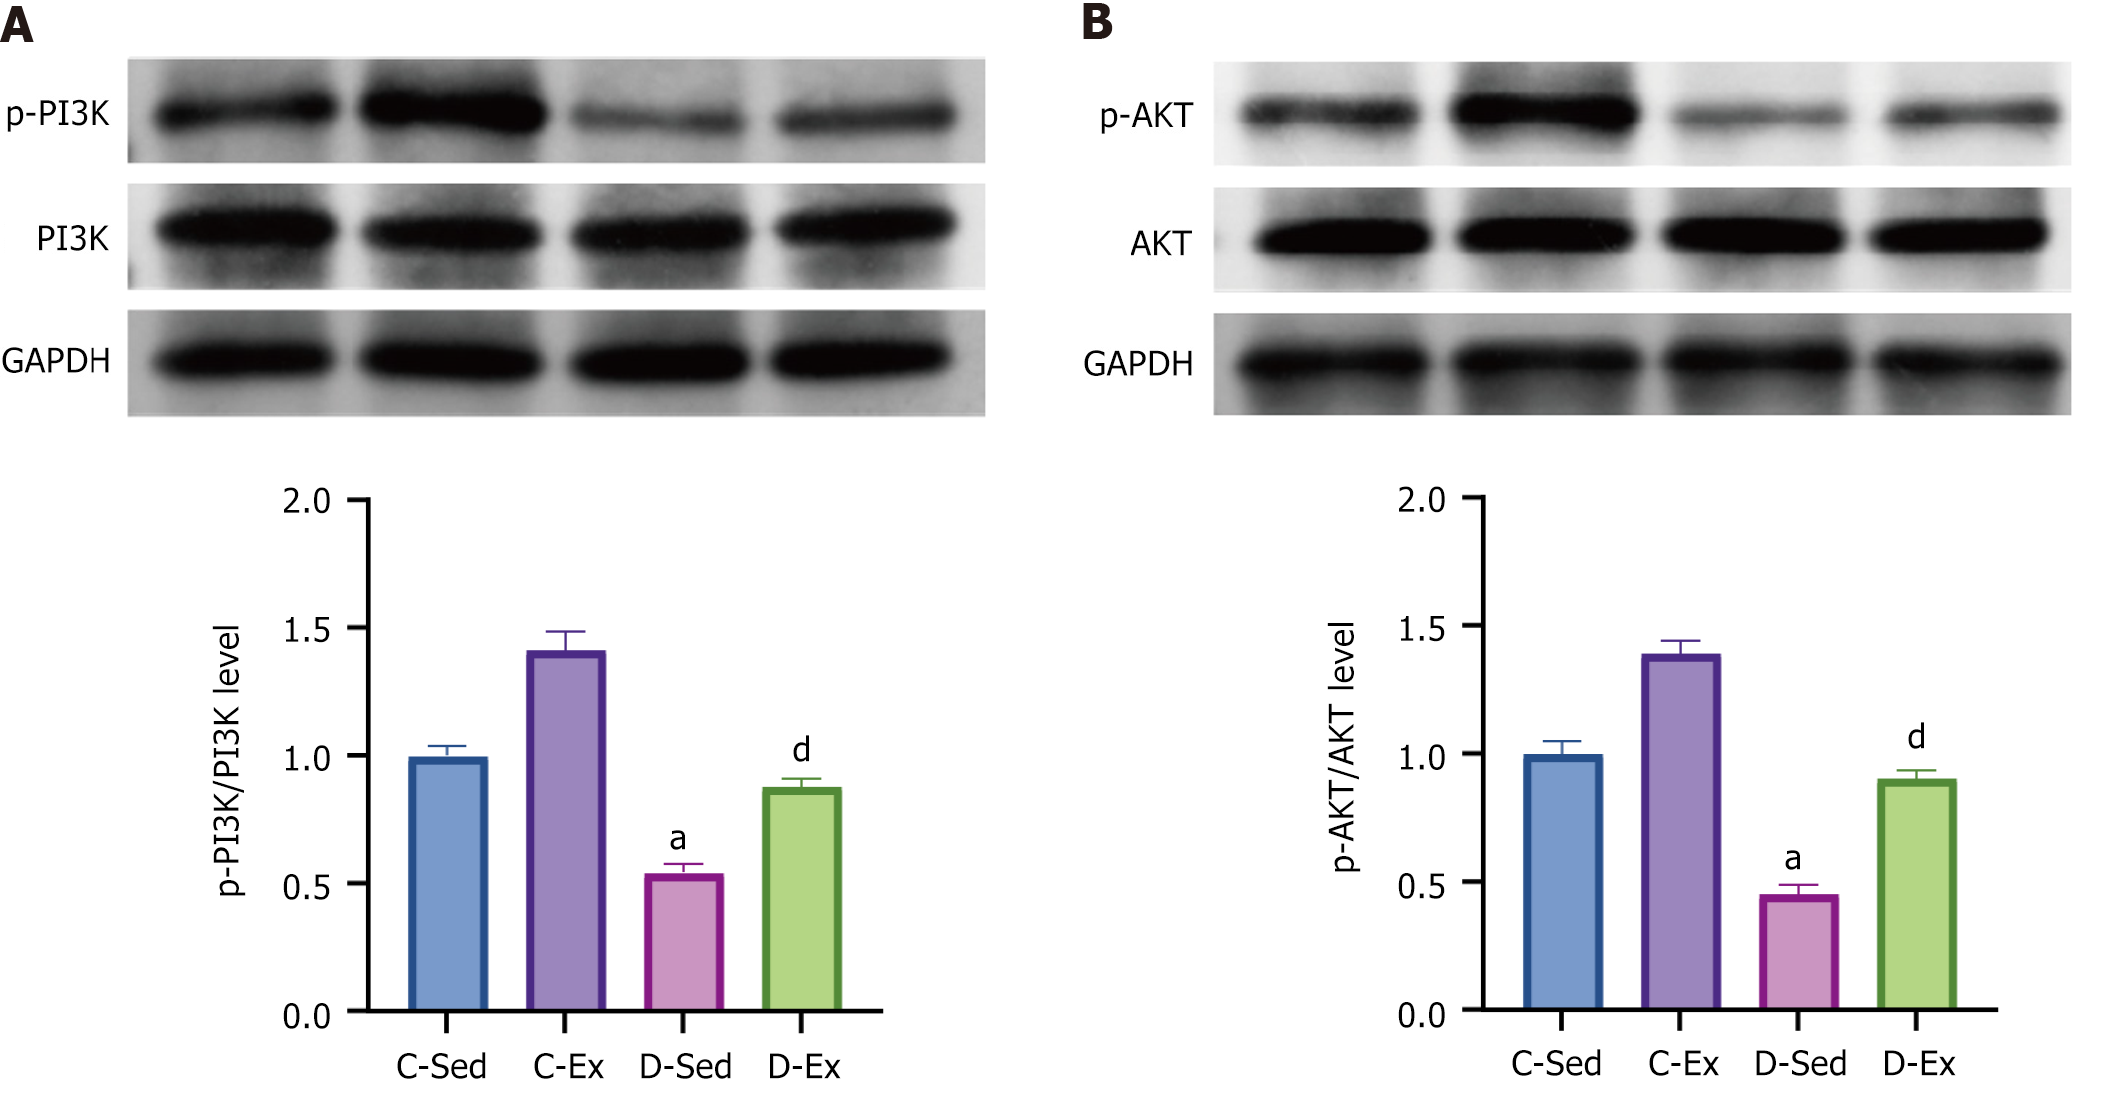
Figure 5 Impact of diabetes and swimming training on the expression of phosphatidylinositol 3-kinase/protein kinase B.
A: Determination of p-phosphatidylinositol 3-kinase (PI3K)/PI3K protein expression levels through Western blot (WB); B: Assessment of p-protein kinase B (AKT)/AKT protein expression levels through WB. aP < 0.05 vs the control sedentary group; dP < 0.05 vs the diabetic sedentary group. PI3K: Phosphatidylinositol 3-kinase; AKT: Protein kinase B; GADPH: Glyceraldehyde-3-phosphate dehydrogenase; D-Ex: The diabetic exercise group; D-Sed: The diabetic sedentary group; C-Ex: The control exercise group; C-Sed: The control sedentary group.
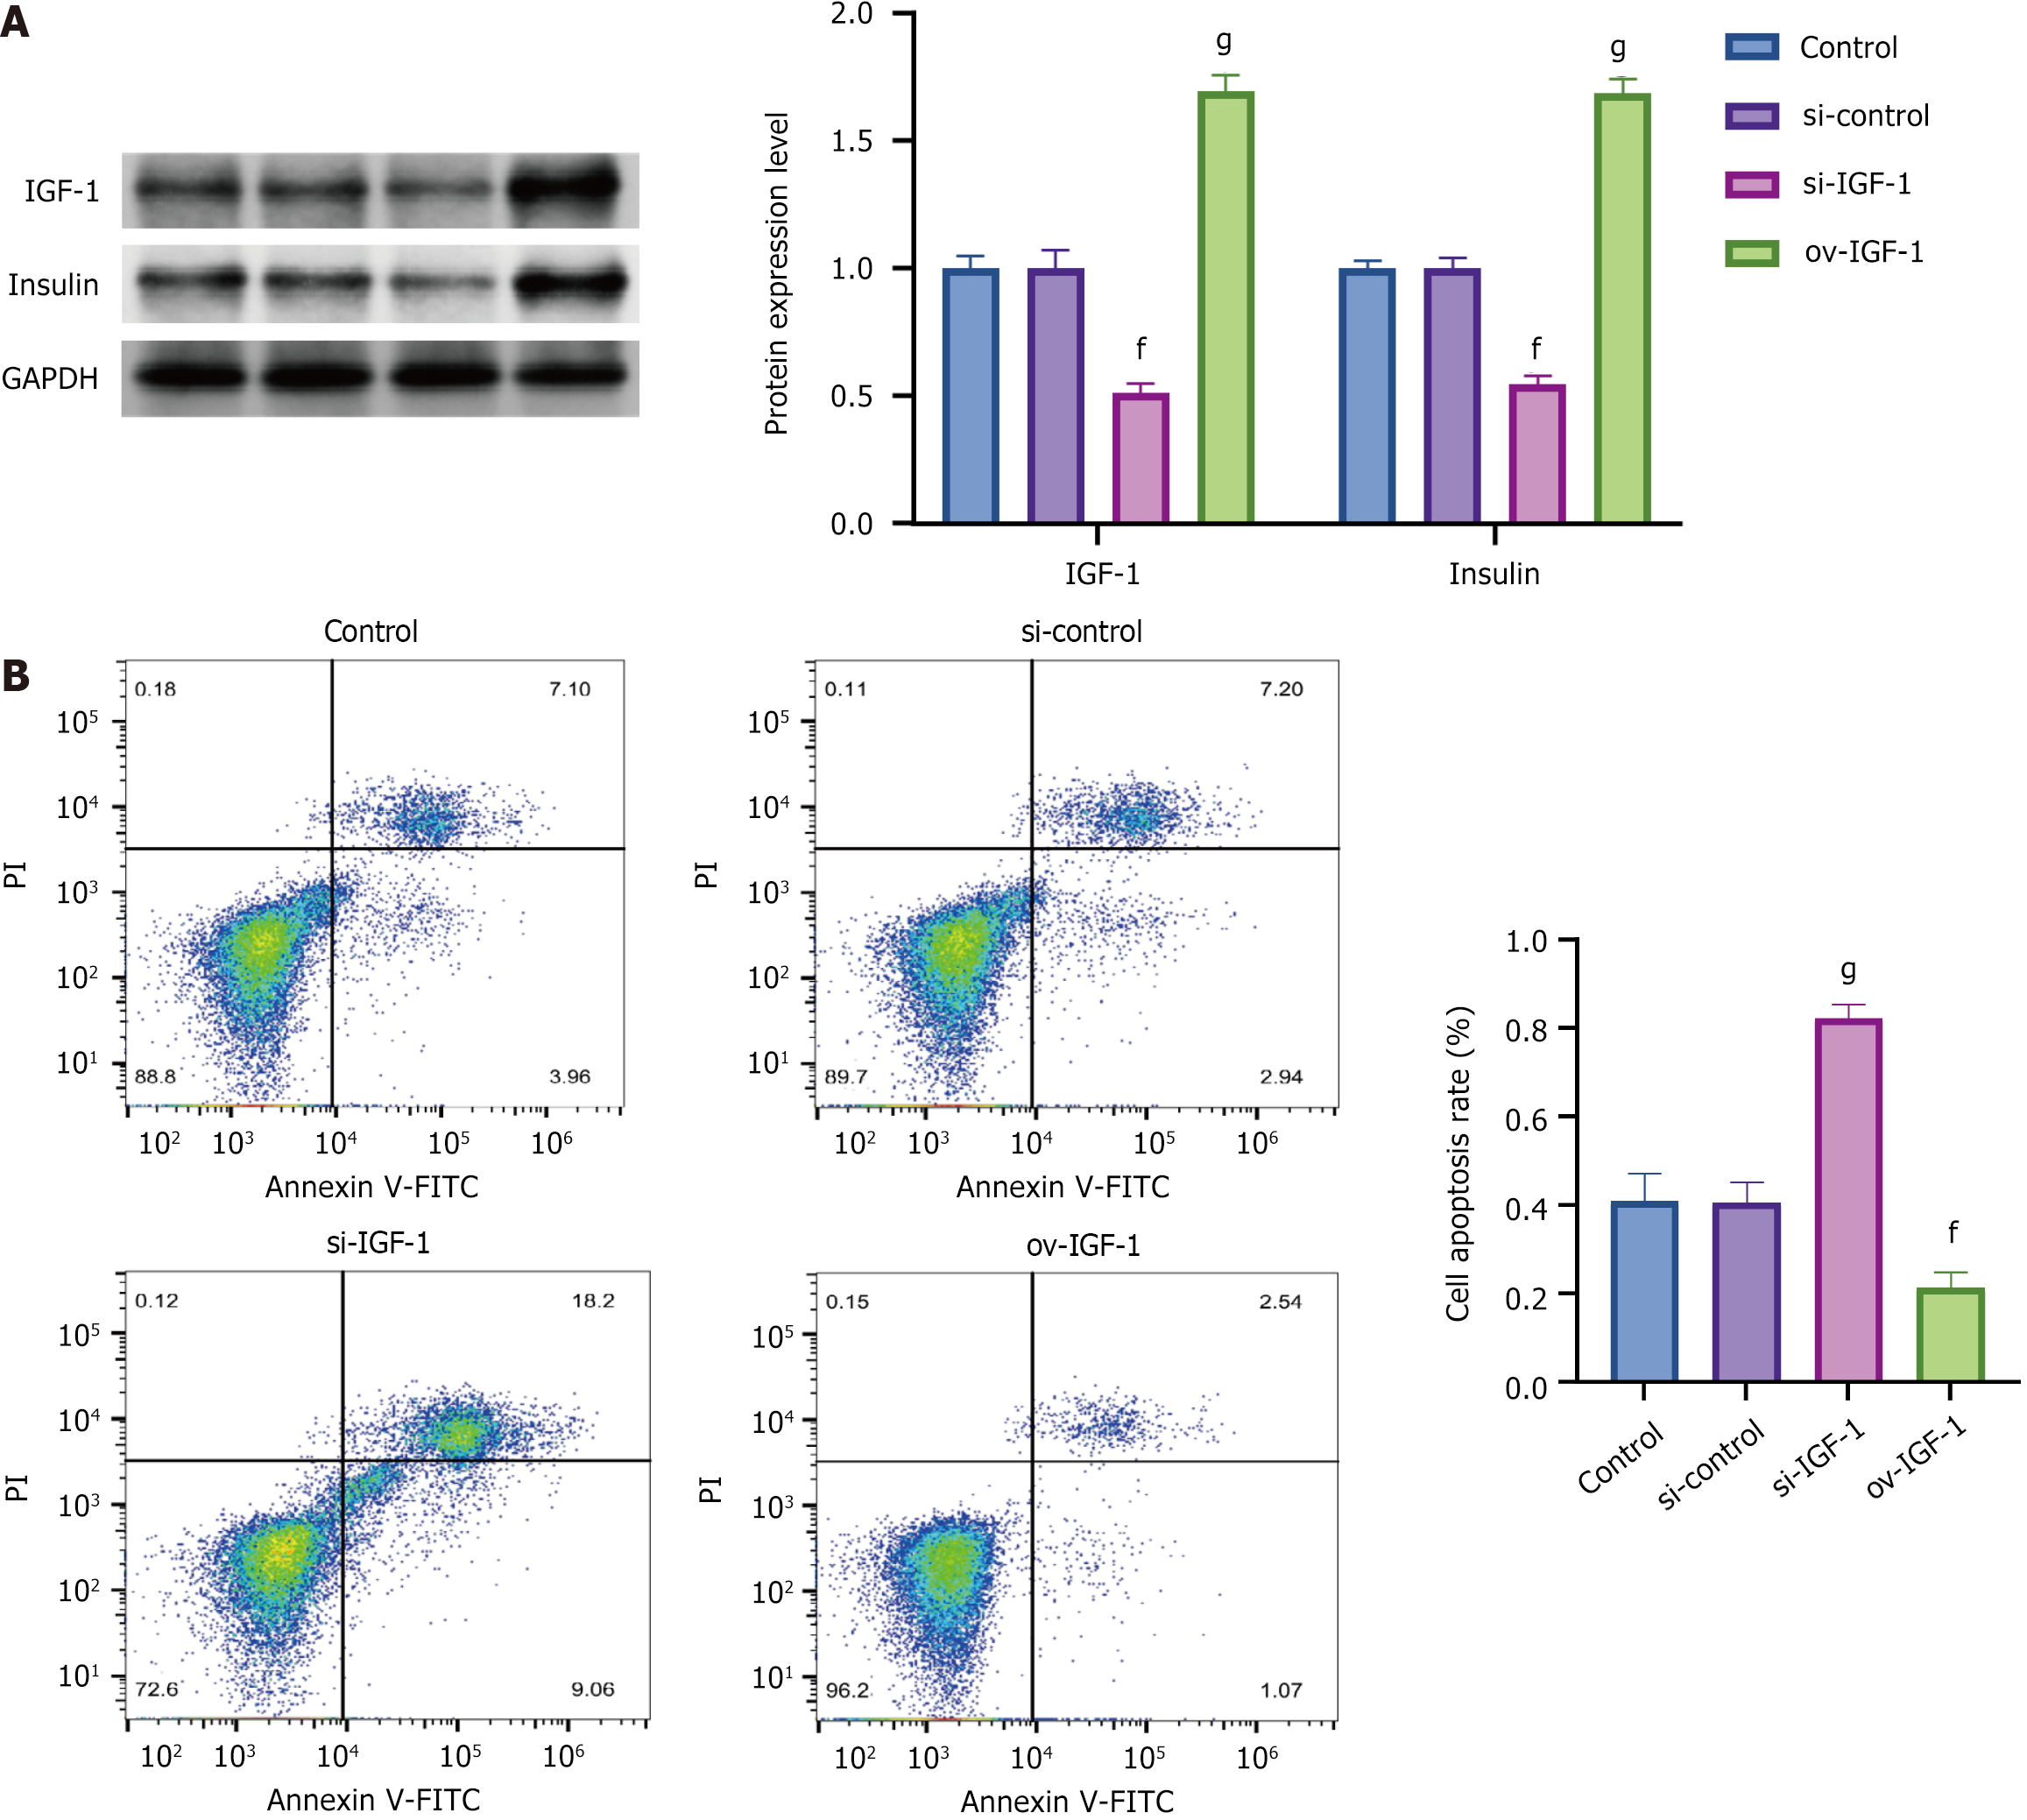
Figure 6 Effects of insulin-like growth factor 1 on islet β-cell function in vitro.
A: Determination of insulin-like growth factor 1 and insulin protein levels through Western blot; B: Cell apoptosis rate by flow cytometry. fP < 0.05, gP < 0.01 vs si-control group. IGF-1: Insulin-like growth factor 1; GADPH: Glyceraldehyde-3-phosphate dehydrogenase.
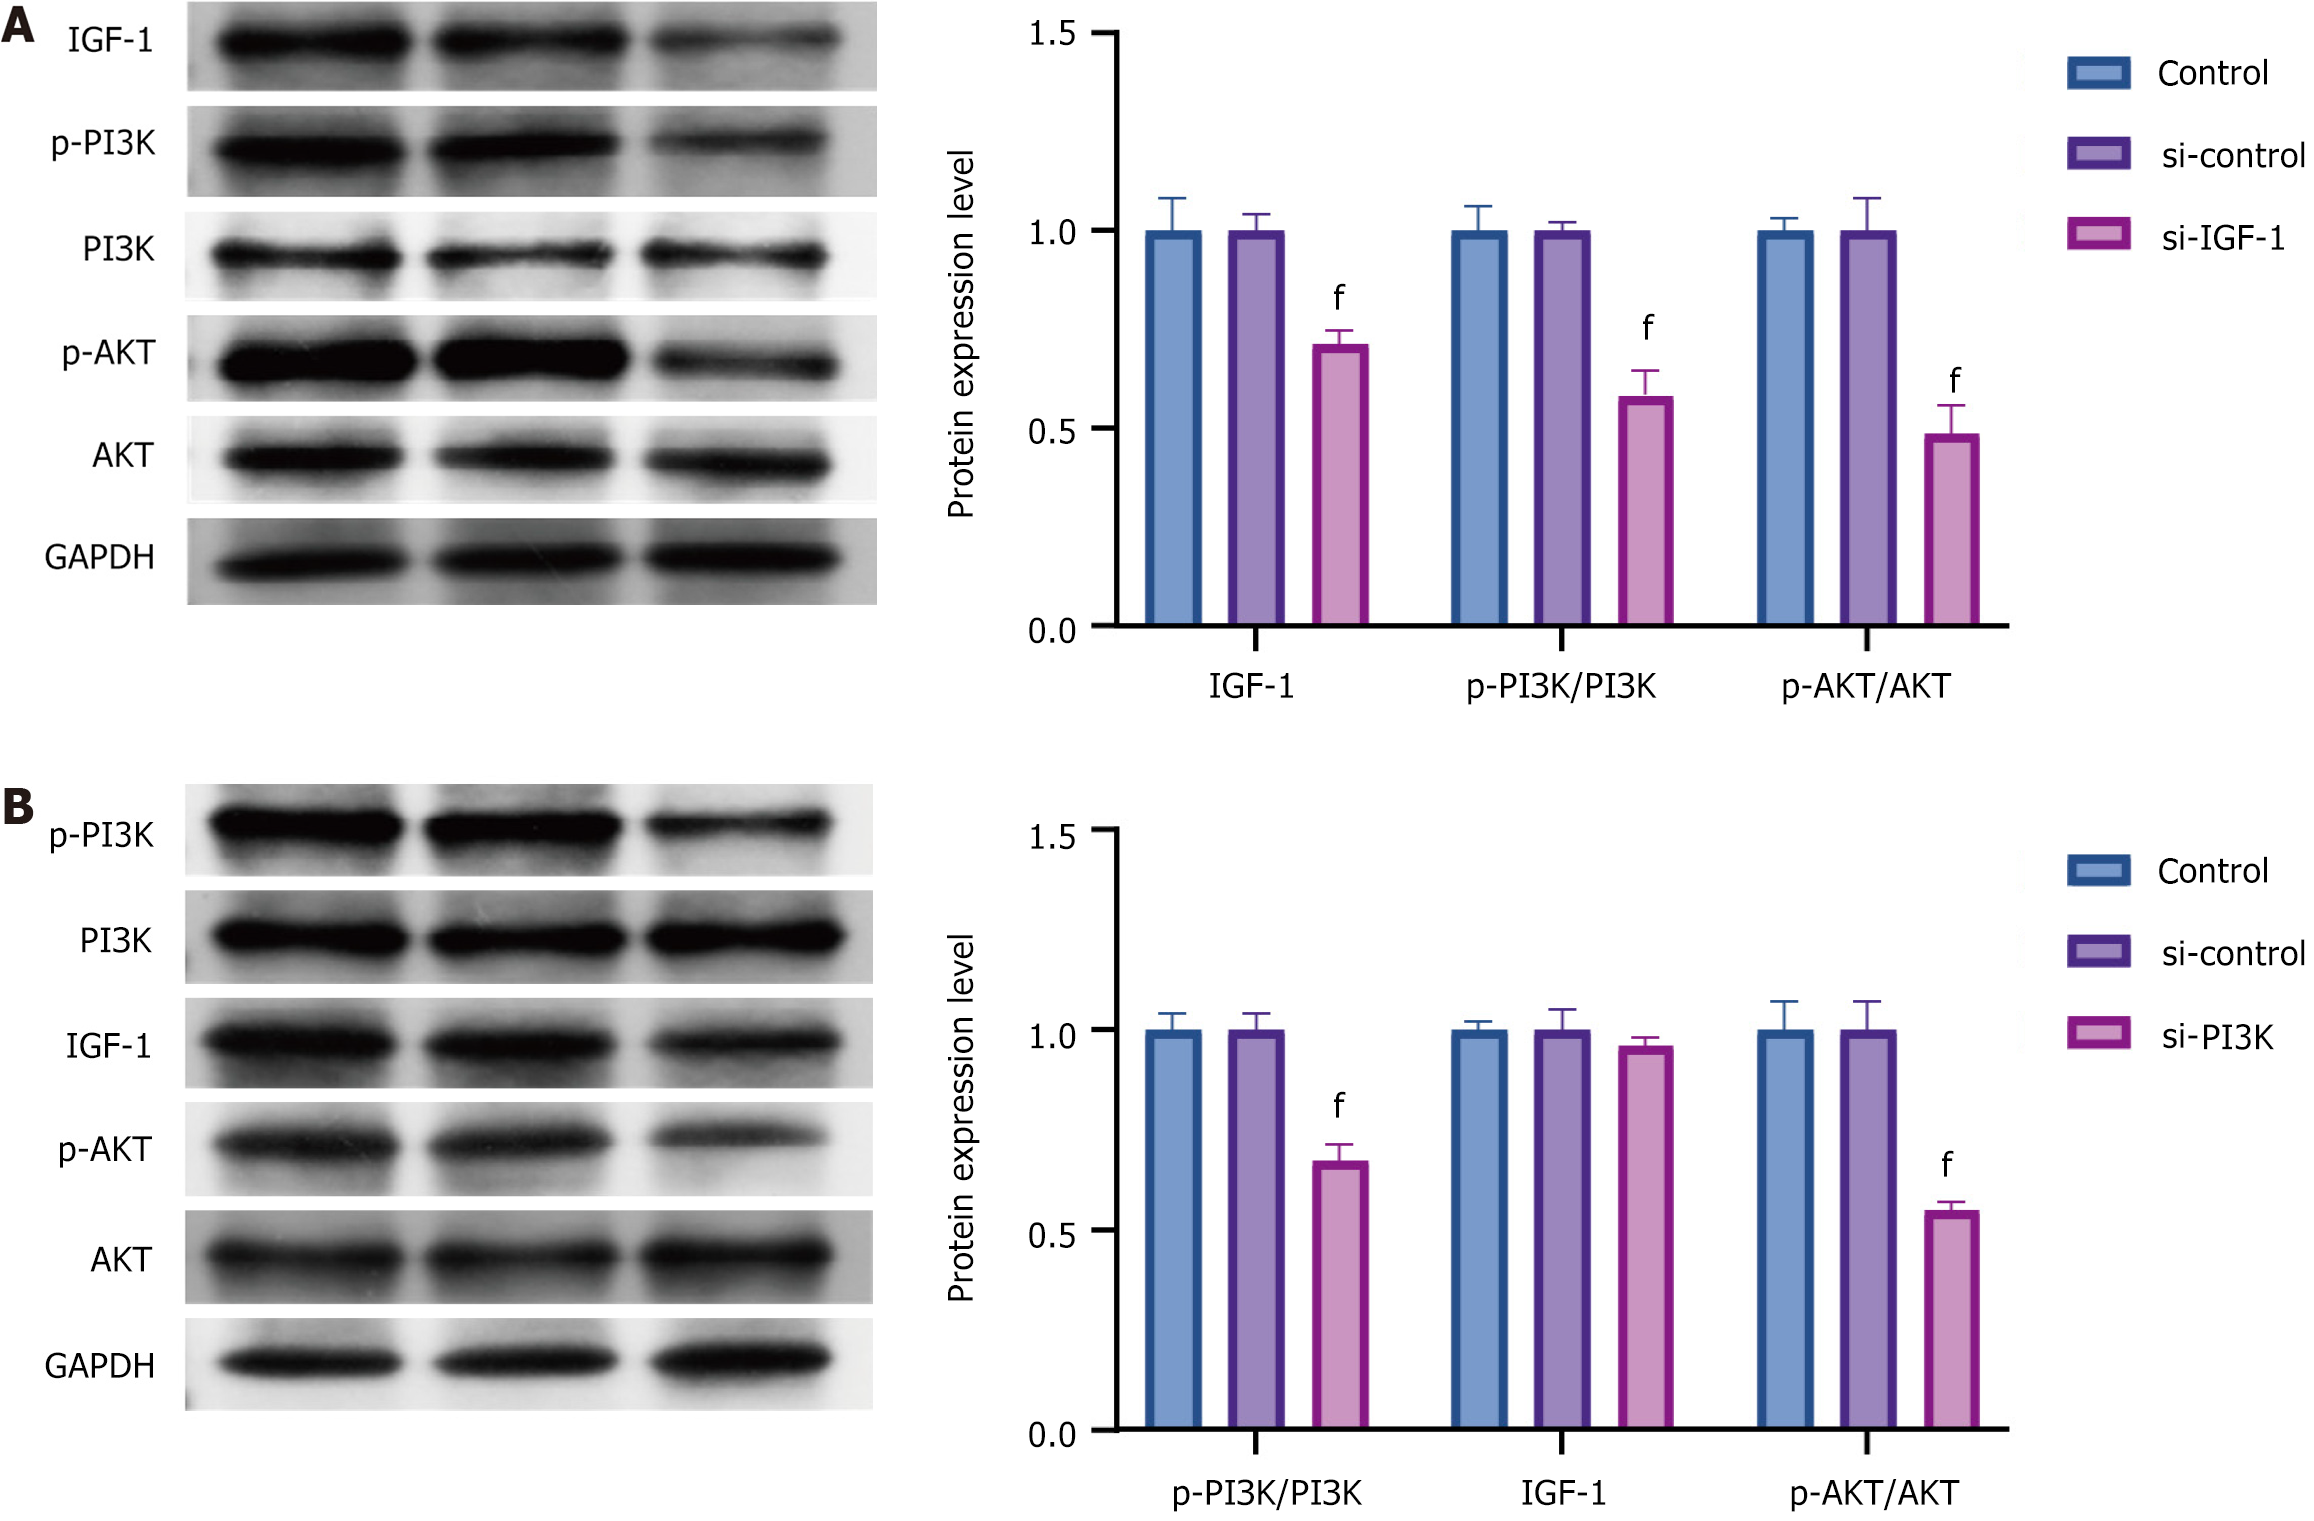
Figure 7 Relationship between insulin-like growth factor 1 and phosphatidylinositol 3-kinase/protein kinase B in vitro.
A: Detection of protein expression levels of insulin-like growth factor 1 (IGF-1), phosphatidylinositol 3-kinase (PI3K), and Protein kinase B (AKT) through Western blot (WB) after knocking down IGF-1; B: Assessment of protein expression levels of PI3K, IGF-1, and AKT through WB after knocking down PI3K. fP < 0.05 vs si-control group; IGF-1: Insulin-like growth factor 1; PI3K: Phosphatidylinositol 3-kinase; AKT: Protein kinase B; GADPH: Glyceraldehyde-3-phosphate dehydrogenase.
- Citation: Wu YW, Wu CY, Lin F, Wu JY. Exercise training benefits pancreatic islet by modulating the insulin-like growth factor 1/phosphatidylinositol 3-kinase/protein kinase B pathway. World J Diabetes 2025; 16(5): 101447
- URL: https://www.wjgnet.com/1948-9358/full/v16/i5/101447.htm
- DOI: https://dx.doi.org/10.4239/wjd.v16.i5.101447


