Copyright
©The Author(s) 2025.
World J Diabetes. Feb 15, 2025; 16(2): 94976
Published online Feb 15, 2025. doi: 10.4239/wjd.v16.i2.94976
Published online Feb 15, 2025. doi: 10.4239/wjd.v16.i2.94976
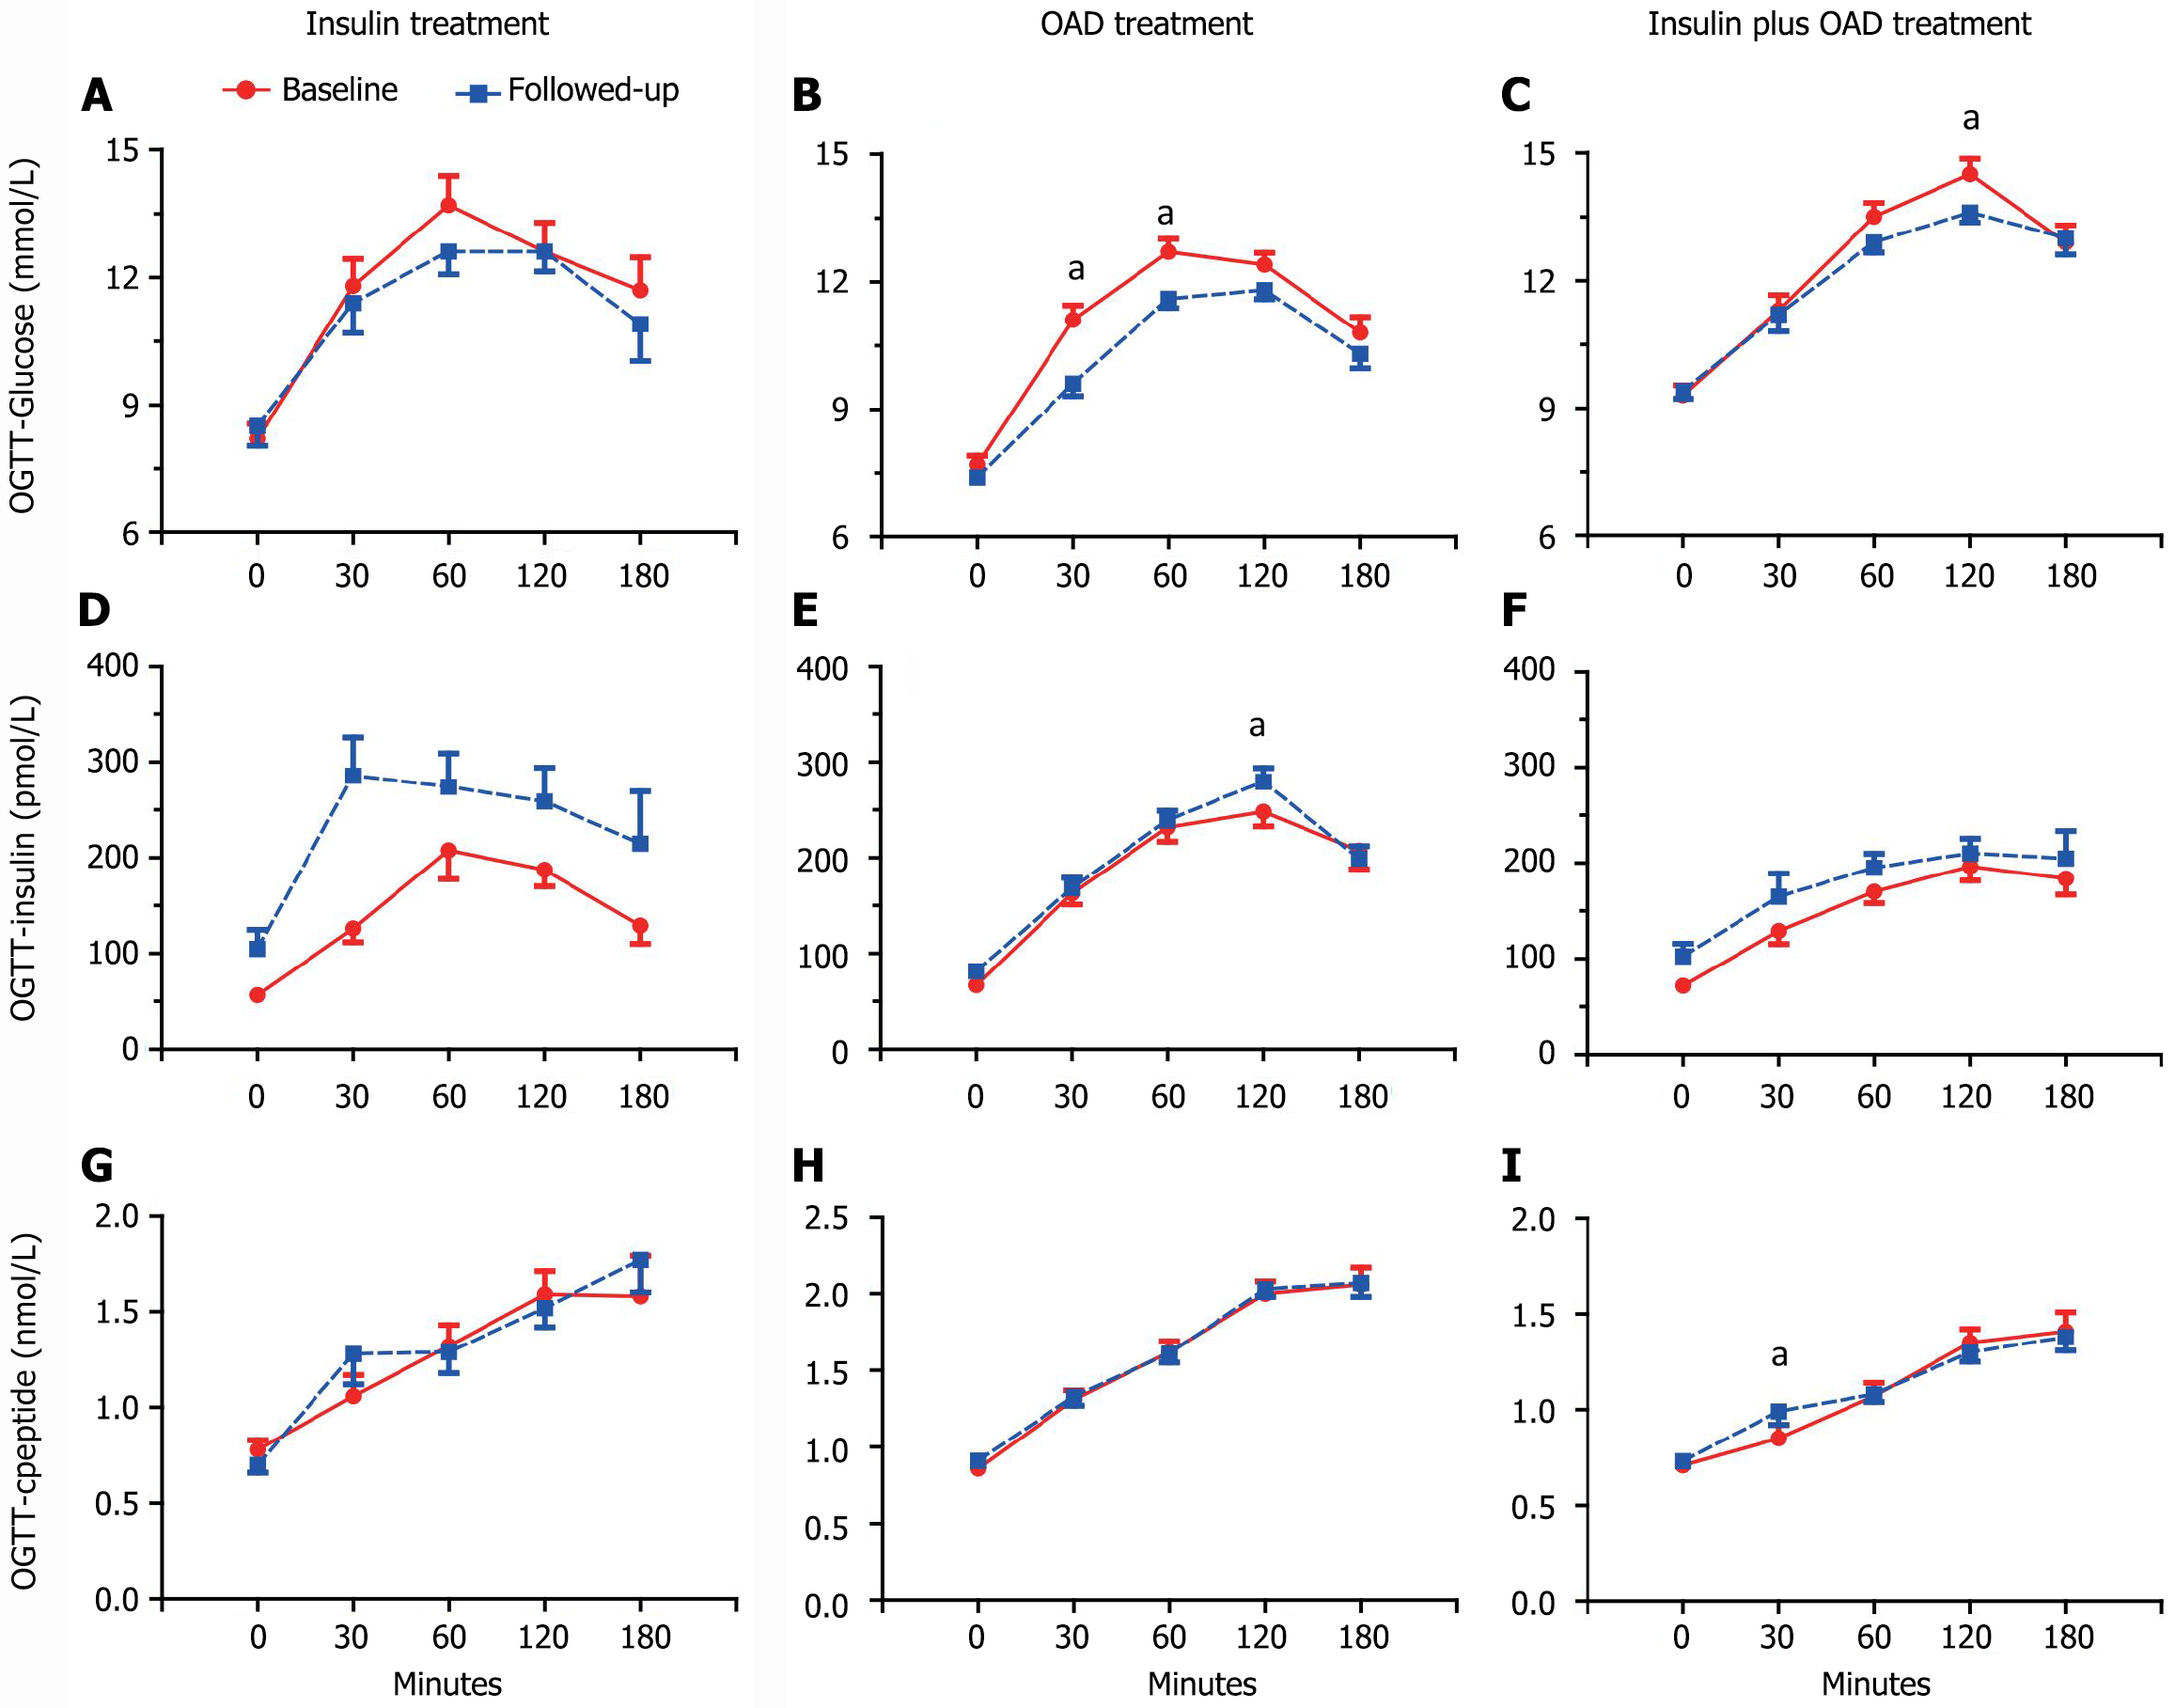
Figure 1 Levels of blood glucose, insulin and C-peptide during oral glucose tolerance test at baseline (solid line) and followed-up (dash line) between different anti-diabetic treatment groups.
A-C: Blood glucose; D-F: Plasma insulin; G-I: Plasma C-peptide; Data are mean ± SE. aP < 0.05. OCTT: Oral glucose tolerance test; OAD: Oral anti-diabetic drugs.
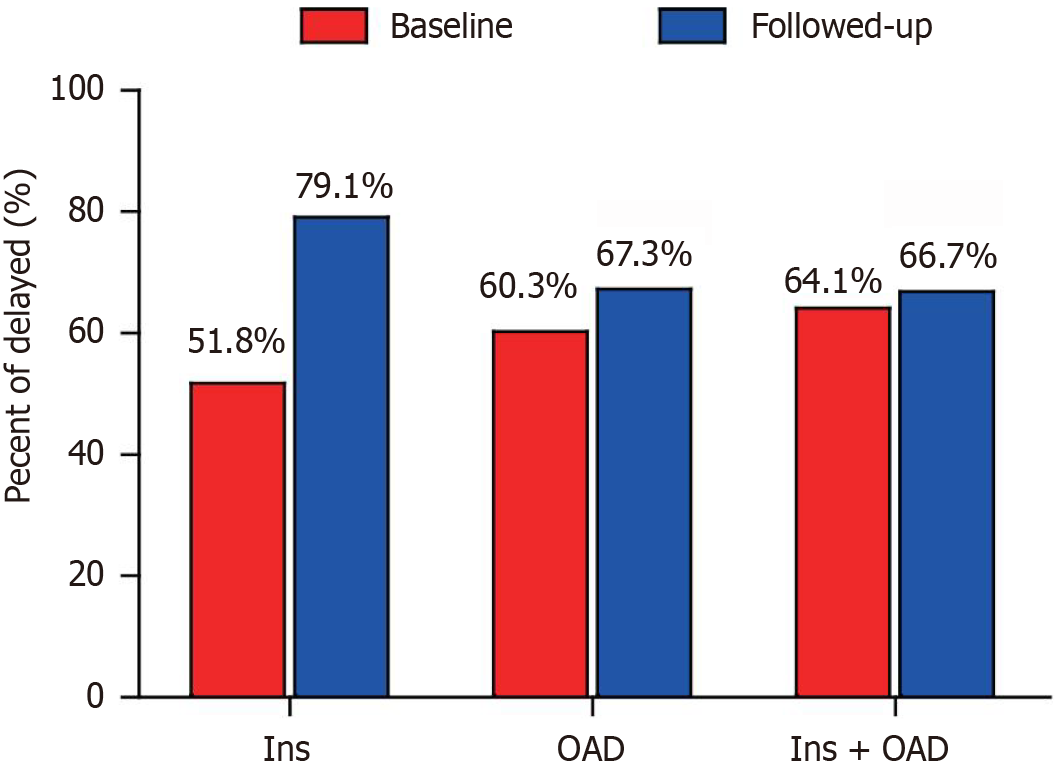
Figure 2 Percent of delayed inulin secretion response between baseline and followed-up after different anti-diabetic treatments.
Ins: Insulin therapy; OAD: Oral anti-diabetic drugs.
- Citation: Ling W, Wang YC, Huang Y, Ou YF, Jiang YC. Islet β-cell function preservation by different anti-diabetic treatments in Chinese elderly patients with type 2 diabetes mellitus. World J Diabetes 2025; 16(2): 94976
- URL: https://www.wjgnet.com/1948-9358/full/v16/i2/94976.htm
- DOI: https://dx.doi.org/10.4239/wjd.v16.i2.94976


