Copyright
©The Author(s) 2024.
World J Diabetes. Jul 15, 2024; 15(7): 1509-1517
Published online Jul 15, 2024. doi: 10.4239/wjd.v15.i7.1509
Published online Jul 15, 2024. doi: 10.4239/wjd.v15.i7.1509
Figure 1 Comparison of infarct morphology distribution maps between the two patient groups.
A: Infarct morphology distribution maps of diabetic cerebral infarction group; B: Infarct morphology distribution maps of non-diabetic cerebral infarction group.
Figure 2 Distribution of arterial lumen stenosis rate in the two patient groups.
A: Distribution of arterial lumen stenosis rate of diabetic cerebral infarction group; B: Distribution of arterial lumen stenosis rate of non-diabetic cerebral infarction group.
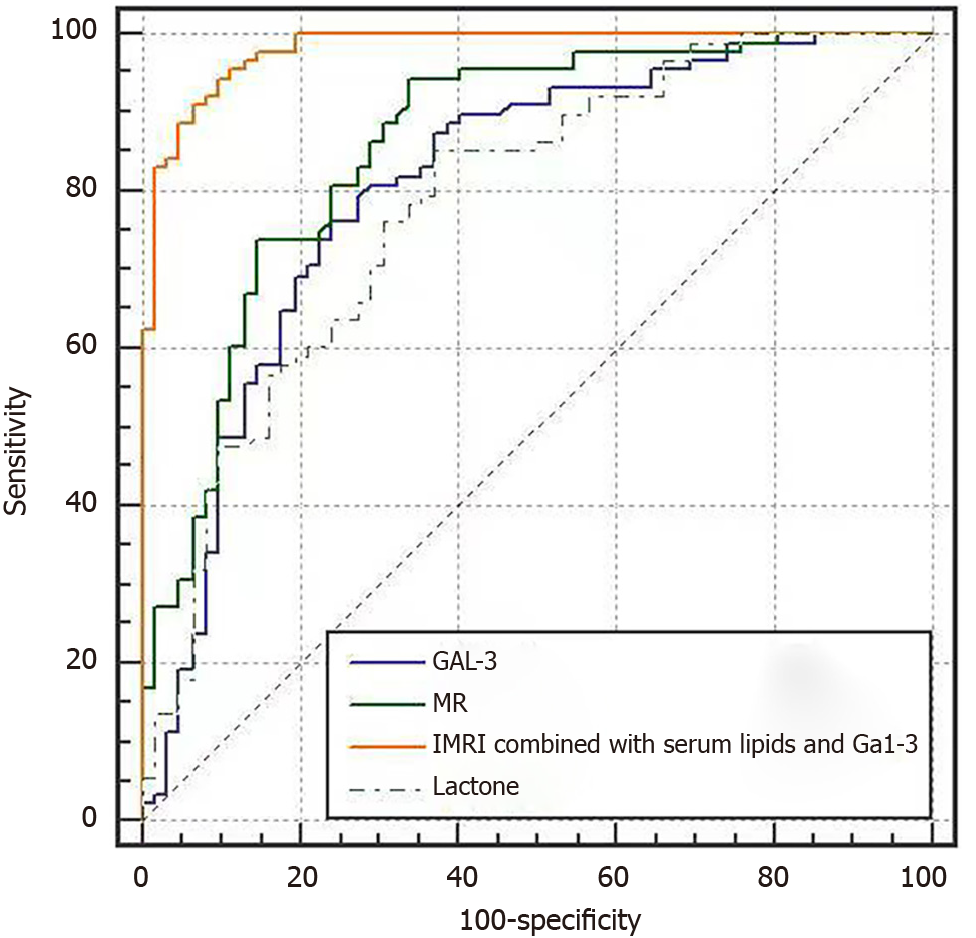
Figure 3 Receiver operating characteristic curve plot of magnetic resonance imaging combined with serum endostatin and galac
- Citation: Zhang YH, Liang D. Magnetic resonance imaging combined with serum endolipin and galactagoglobin-3 to diagnose cerebral infarction in the elderly with diabetes mellitus. World J Diabetes 2024; 15(7): 1509-1517
- URL: https://www.wjgnet.com/1948-9358/full/v15/i7/1509.htm
- DOI: https://dx.doi.org/10.4239/wjd.v15.i7.1509


