Copyright
©The Author(s) 2024.
World J Diabetes. Jun 15, 2024; 15(6): 1212-1225
Published online Jun 15, 2024. doi: 10.4239/wjd.v15.i6.1212
Published online Jun 15, 2024. doi: 10.4239/wjd.v15.i6.1212
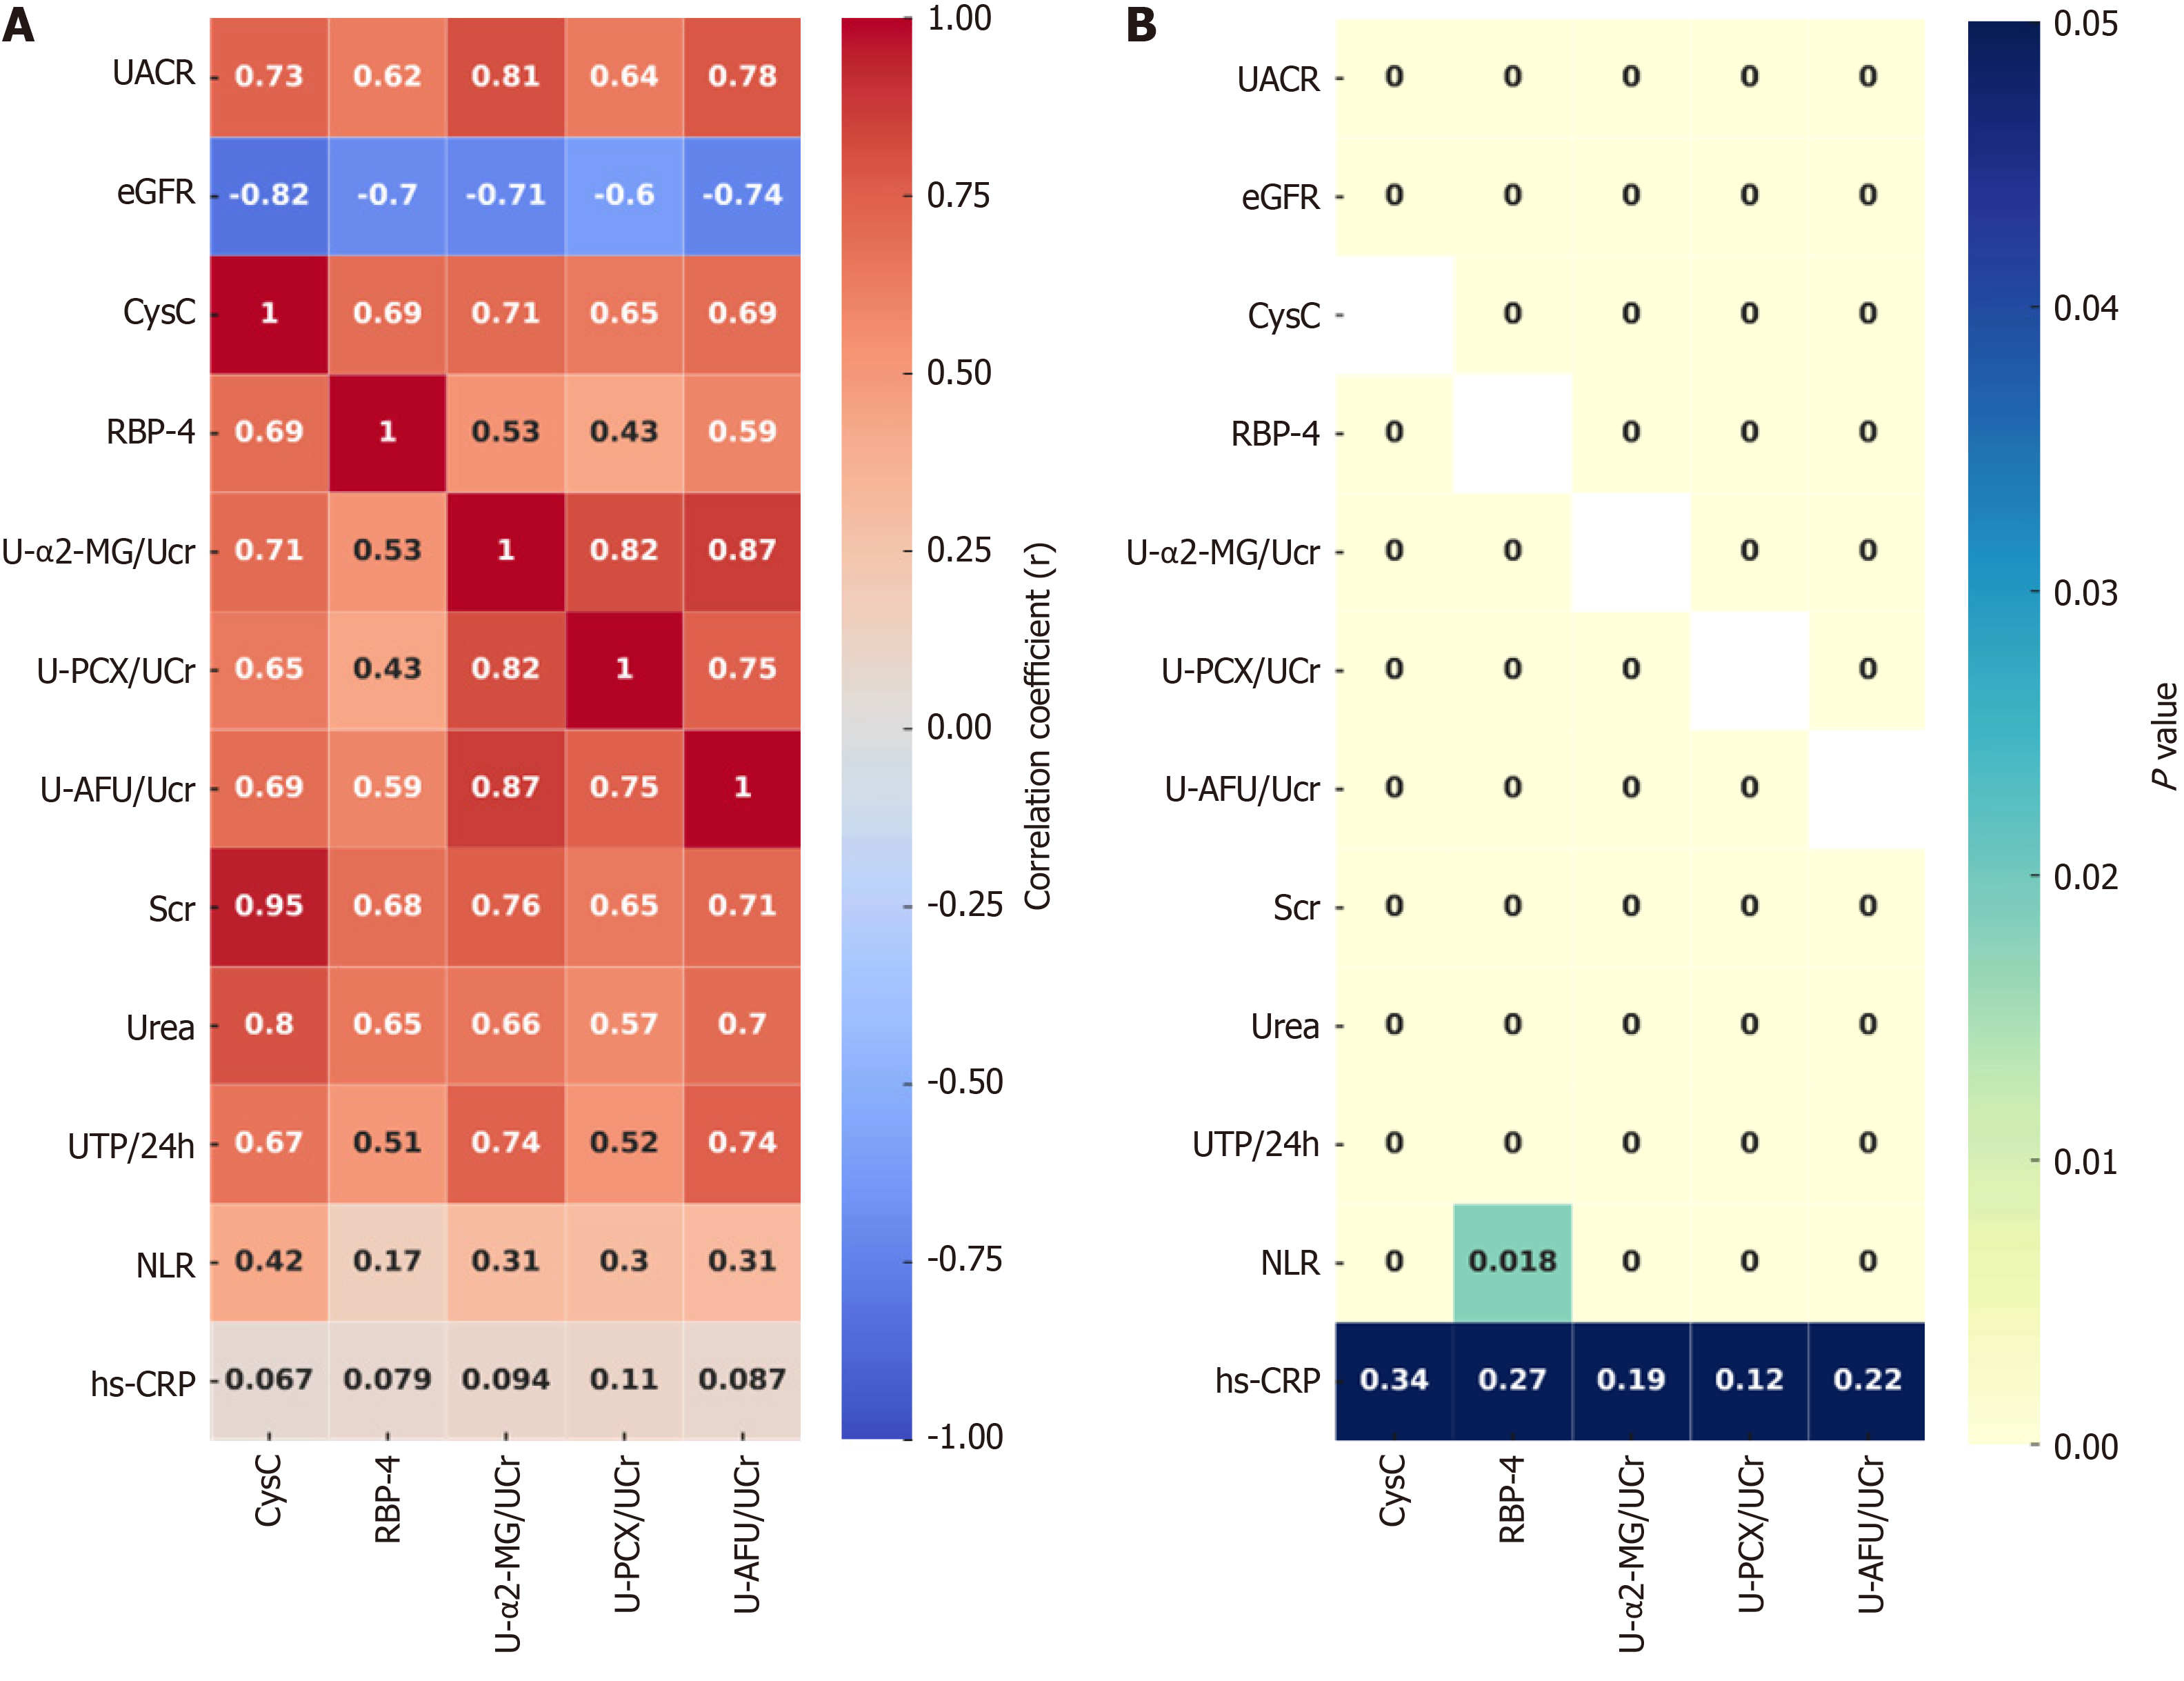
Figure 1 Correlation analysis of biomarkers and clinical indicators in diabetic nephropathy.
A: Correlation heatmap of selected biomarkers and clinical indicators, where color intensity reflects correlation strength; deep blue for strong positive and lighter shades for weaker correlations; B: Significance heatmap for biomarker and clinical indicator correlations, with color depth indicating P value magnitude; darker blue for lower P values and higher significance, lighter for higher P values or nonsignificance. α2-MG: α2-macroglobulin; PCX: Podocalysin; AFU: α-L-fucosidase; RBP-4: Retinol binding protein-4; CysC: Cystatin C; UACR: Urinary albumin/creatinine ratio.
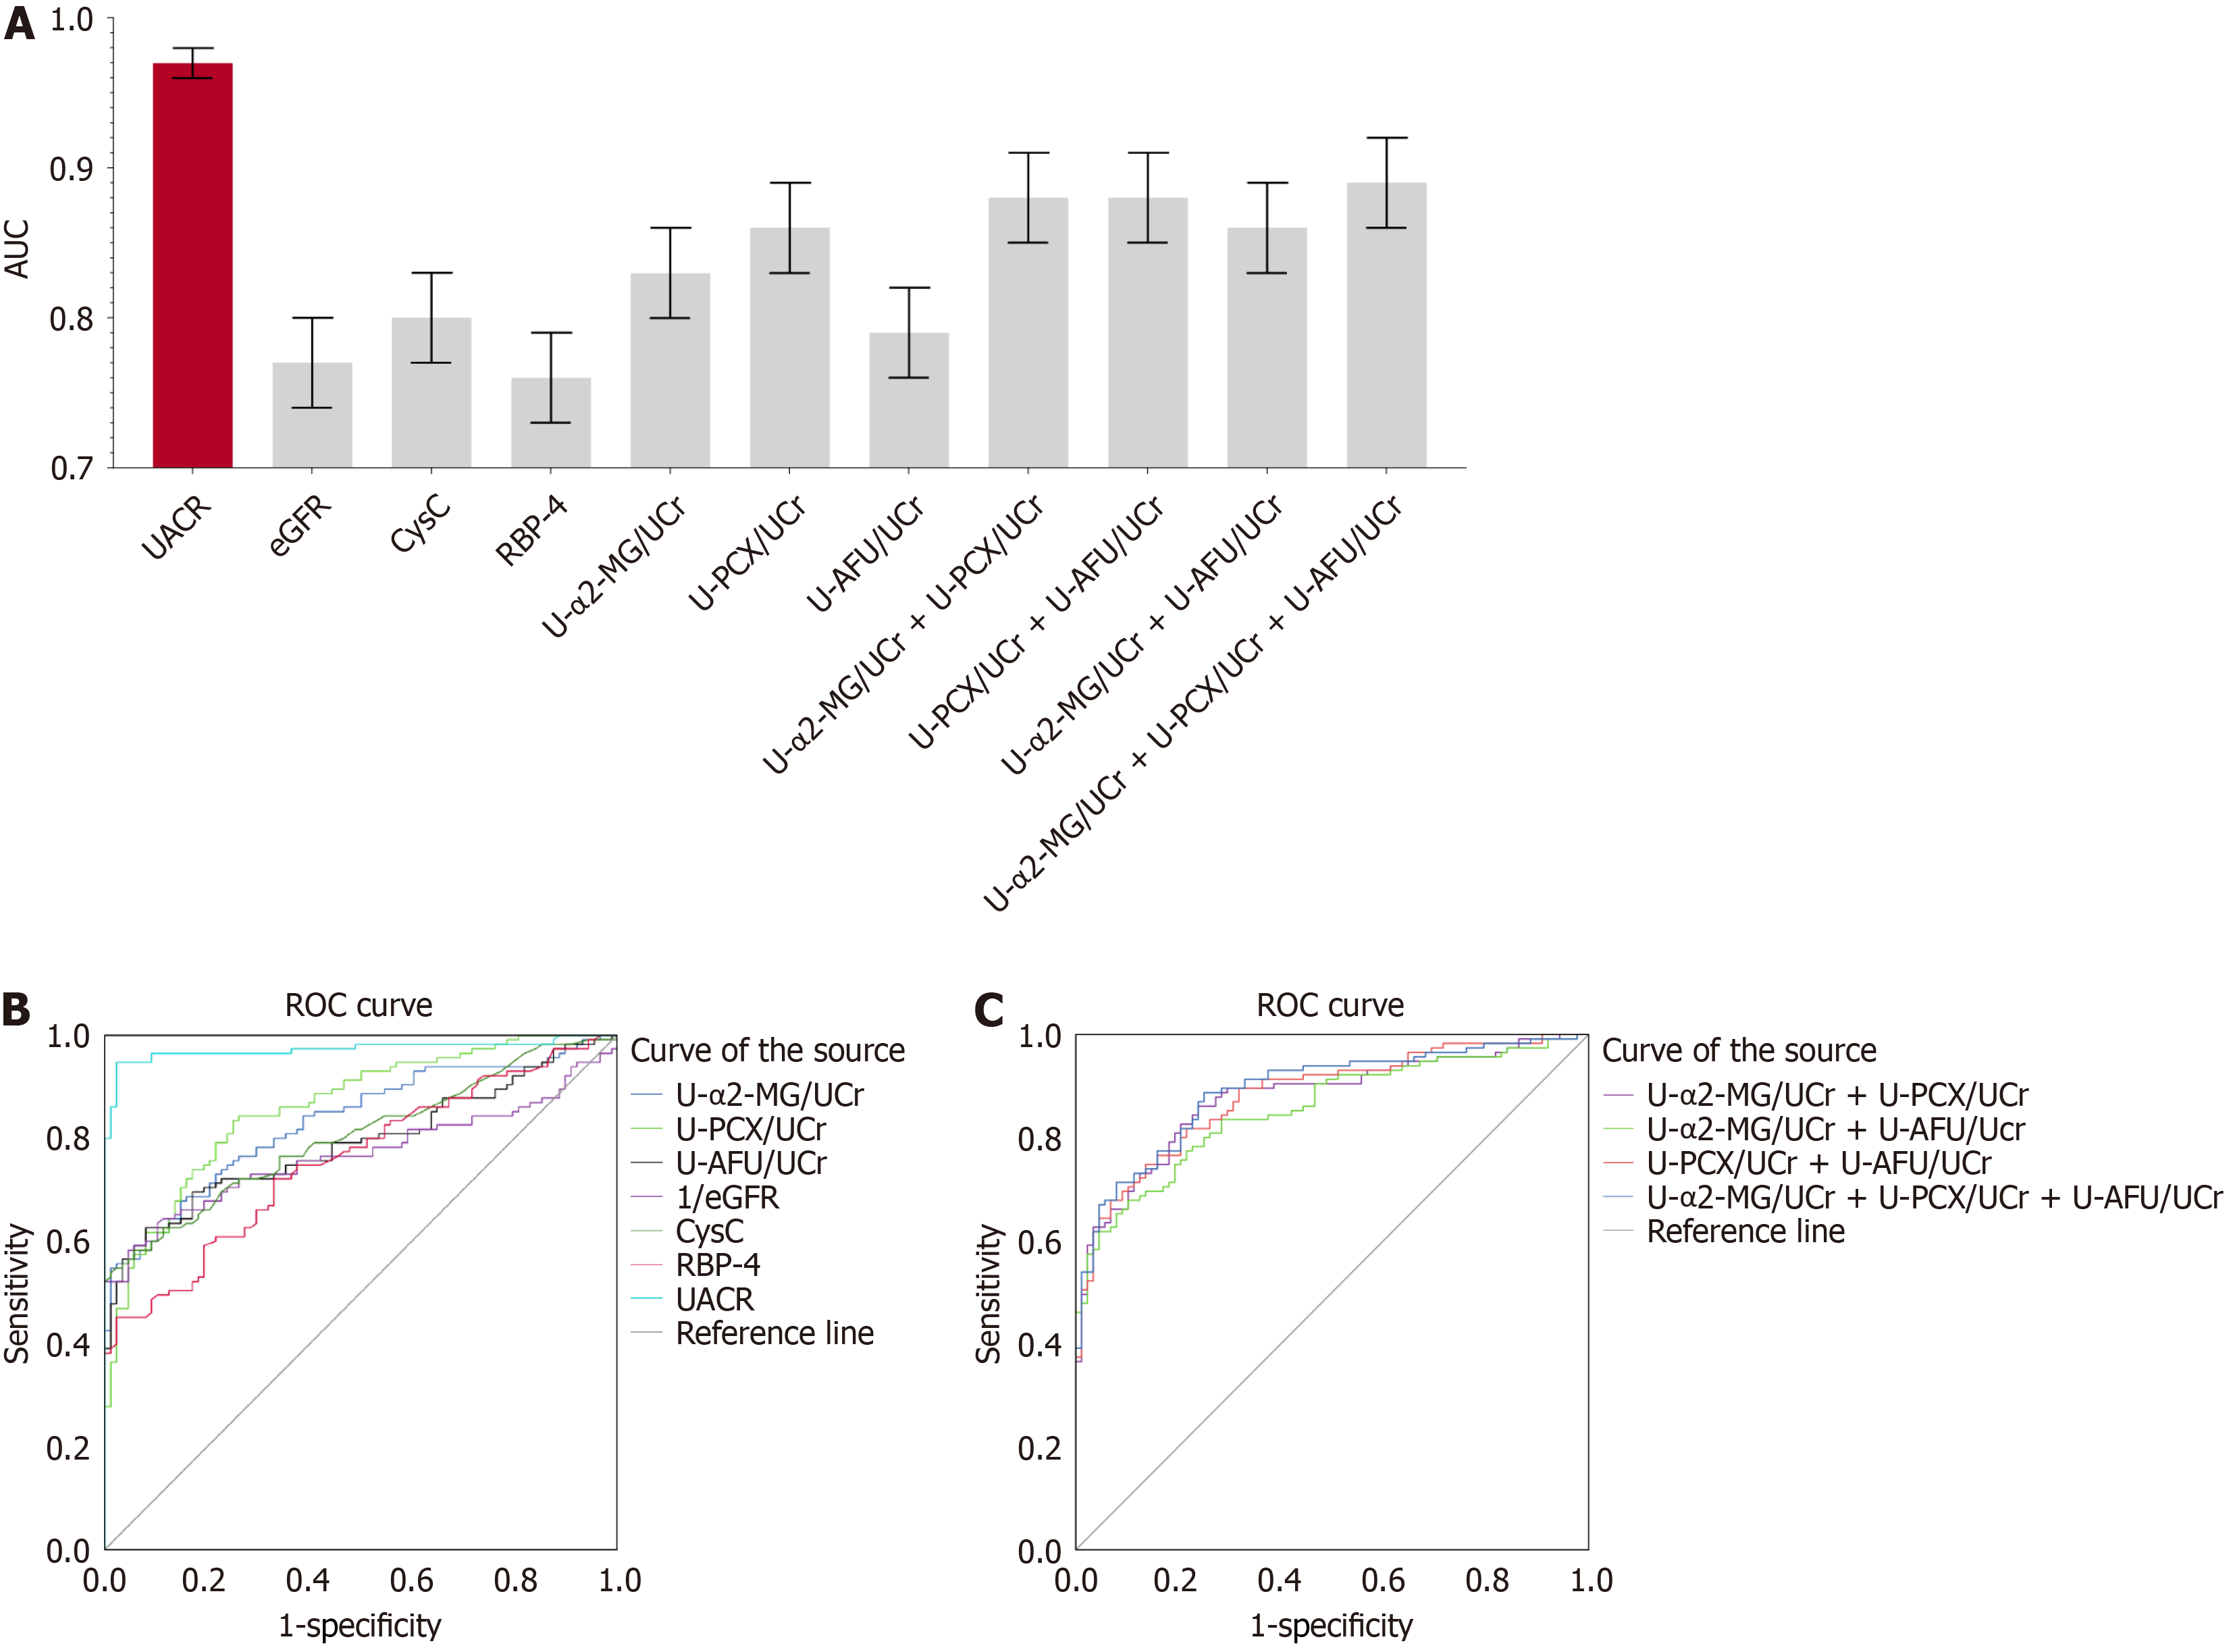
Figure 2 Diagnostic performance of biomarkers in early diagnosis of diabetic nephropathy.
A: Bar graph comparing area under the receiver operating characteristic (ROC) curve values for biomarkers in the diagnosis of diabetic nephropathy; B: ROC curve analysis for individual biomarkers; C: ROC curve analysis for combined biomarkers. ROC: Receiver operating characteristic.
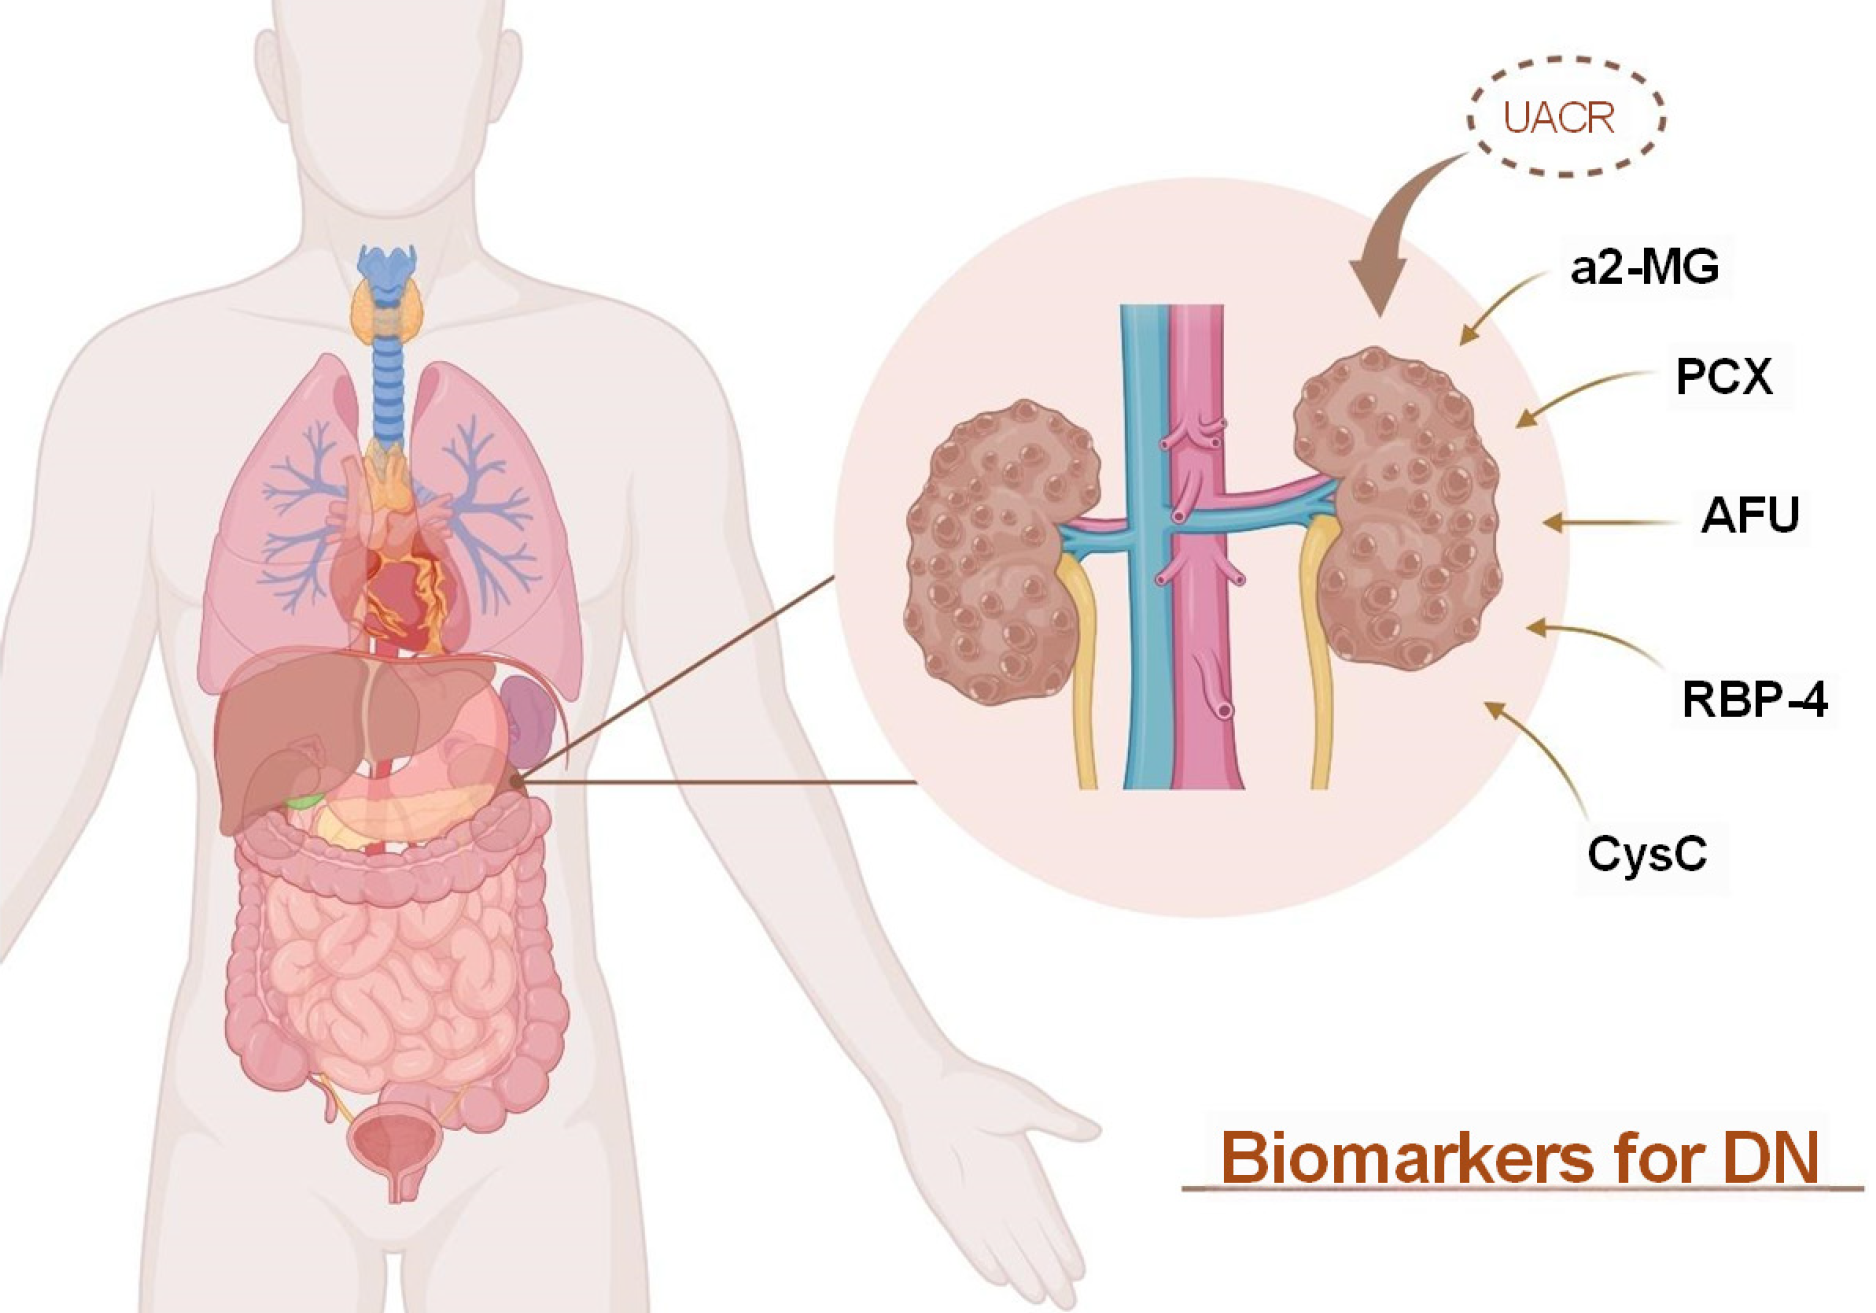
Figure 3 Molecular biomarkers and their role in diagnosing diabetic nephropathy.
This figure provides a visual overview of the key molecular biomarkers implicated in diabetic nephropathy, highlighting their significance and potential utility in the early diagnosis and monitoring of the disease. α2-MG: α2-macroglobulin; PCX: Podocalysin; AFU: α-L-fucosidase; RBP-4: Retinol binding protein-4; CysC: Cystatin C; UACR: Urinary albumin/creatinine ratio; DN: Diabetic nephropathy.
- Citation: Li JJ, Sa RL, Zhang Y, Yan ZL. Evaluating new biomarkers for diabetic nephropathy: Role of α2-macroglobulin, podocalyxin, α-L-fucosidase, retinol-binding protein-4, and cystatin C. World J Diabetes 2024; 15(6): 1212-1225
- URL: https://www.wjgnet.com/1948-9358/full/v15/i6/1212.htm
- DOI: https://dx.doi.org/10.4239/wjd.v15.i6.1212


