Copyright
©The Author(s) 2024.
World J Diabetes. Mar 15, 2024; 15(3): 463-474
Published online Mar 15, 2024. doi: 10.4239/wjd.v15.i3.463
Published online Mar 15, 2024. doi: 10.4239/wjd.v15.i3.463
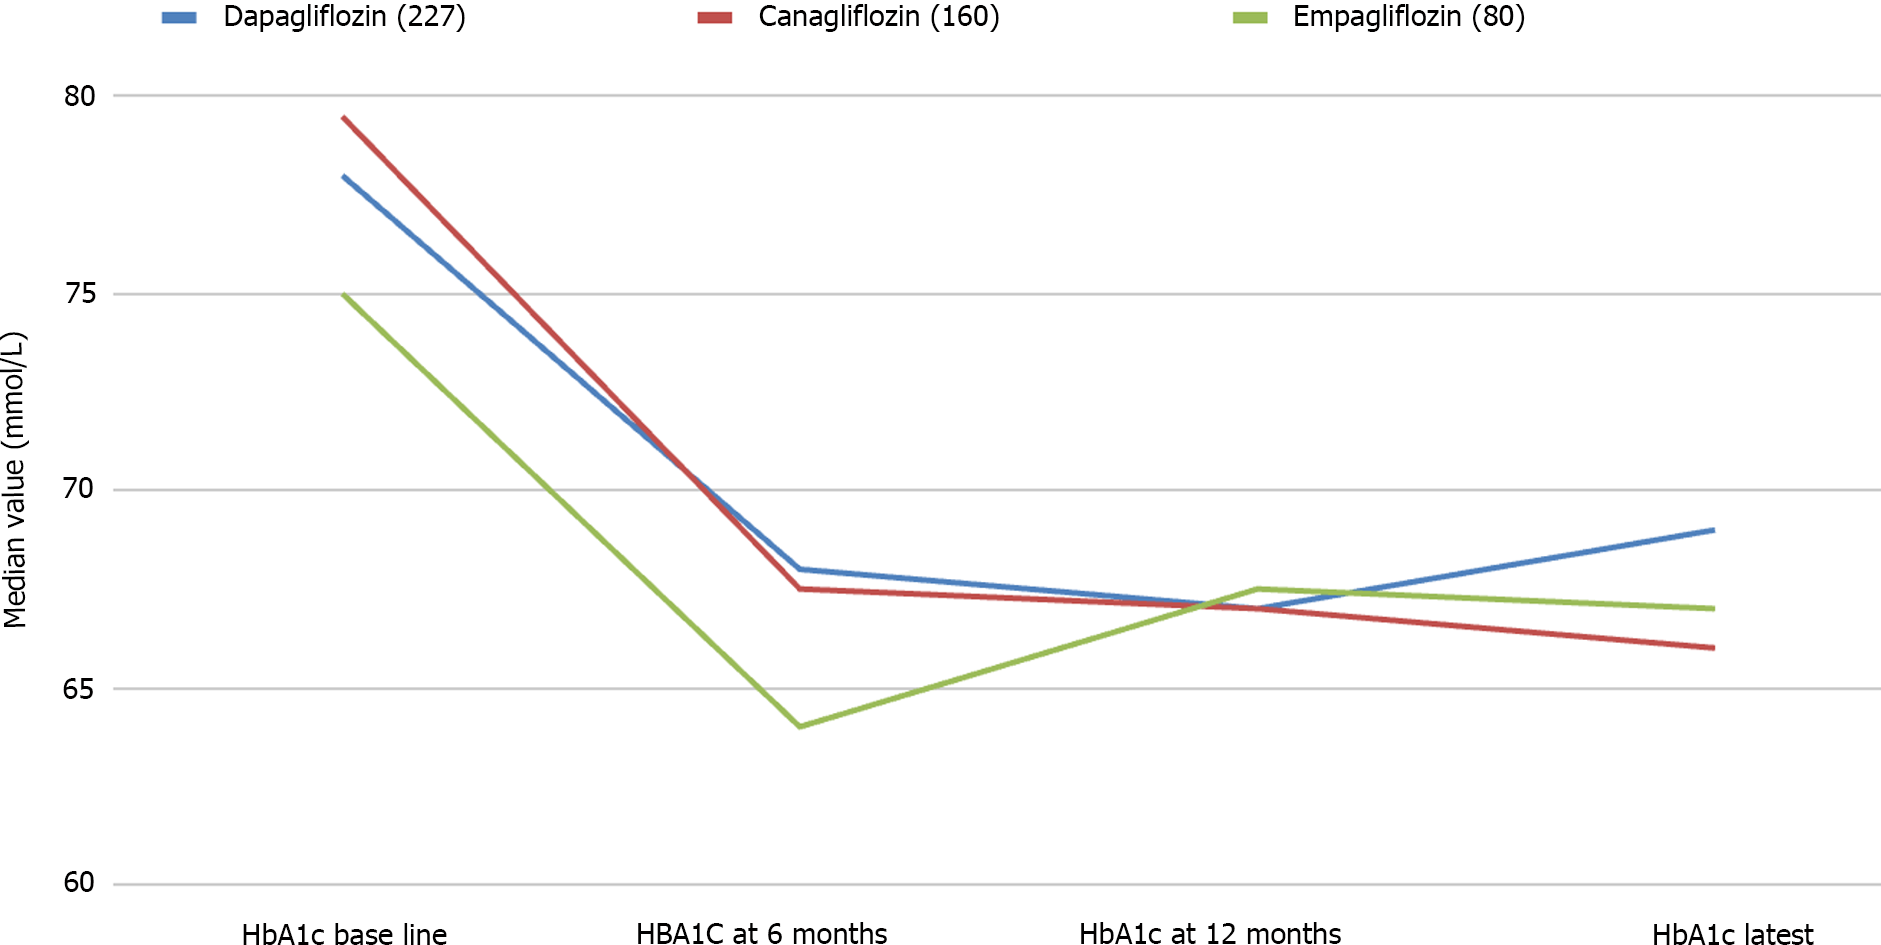
Figure 1 Changes of glycated hemoglobin from baseline at 6 months, 12 months, and latest with various sodium glucose cotransporter 2 inhibiting agents: Dapagliflozin, canagliflozin, and empagliflozin.
HbA1c: Glycated hemoglobin.
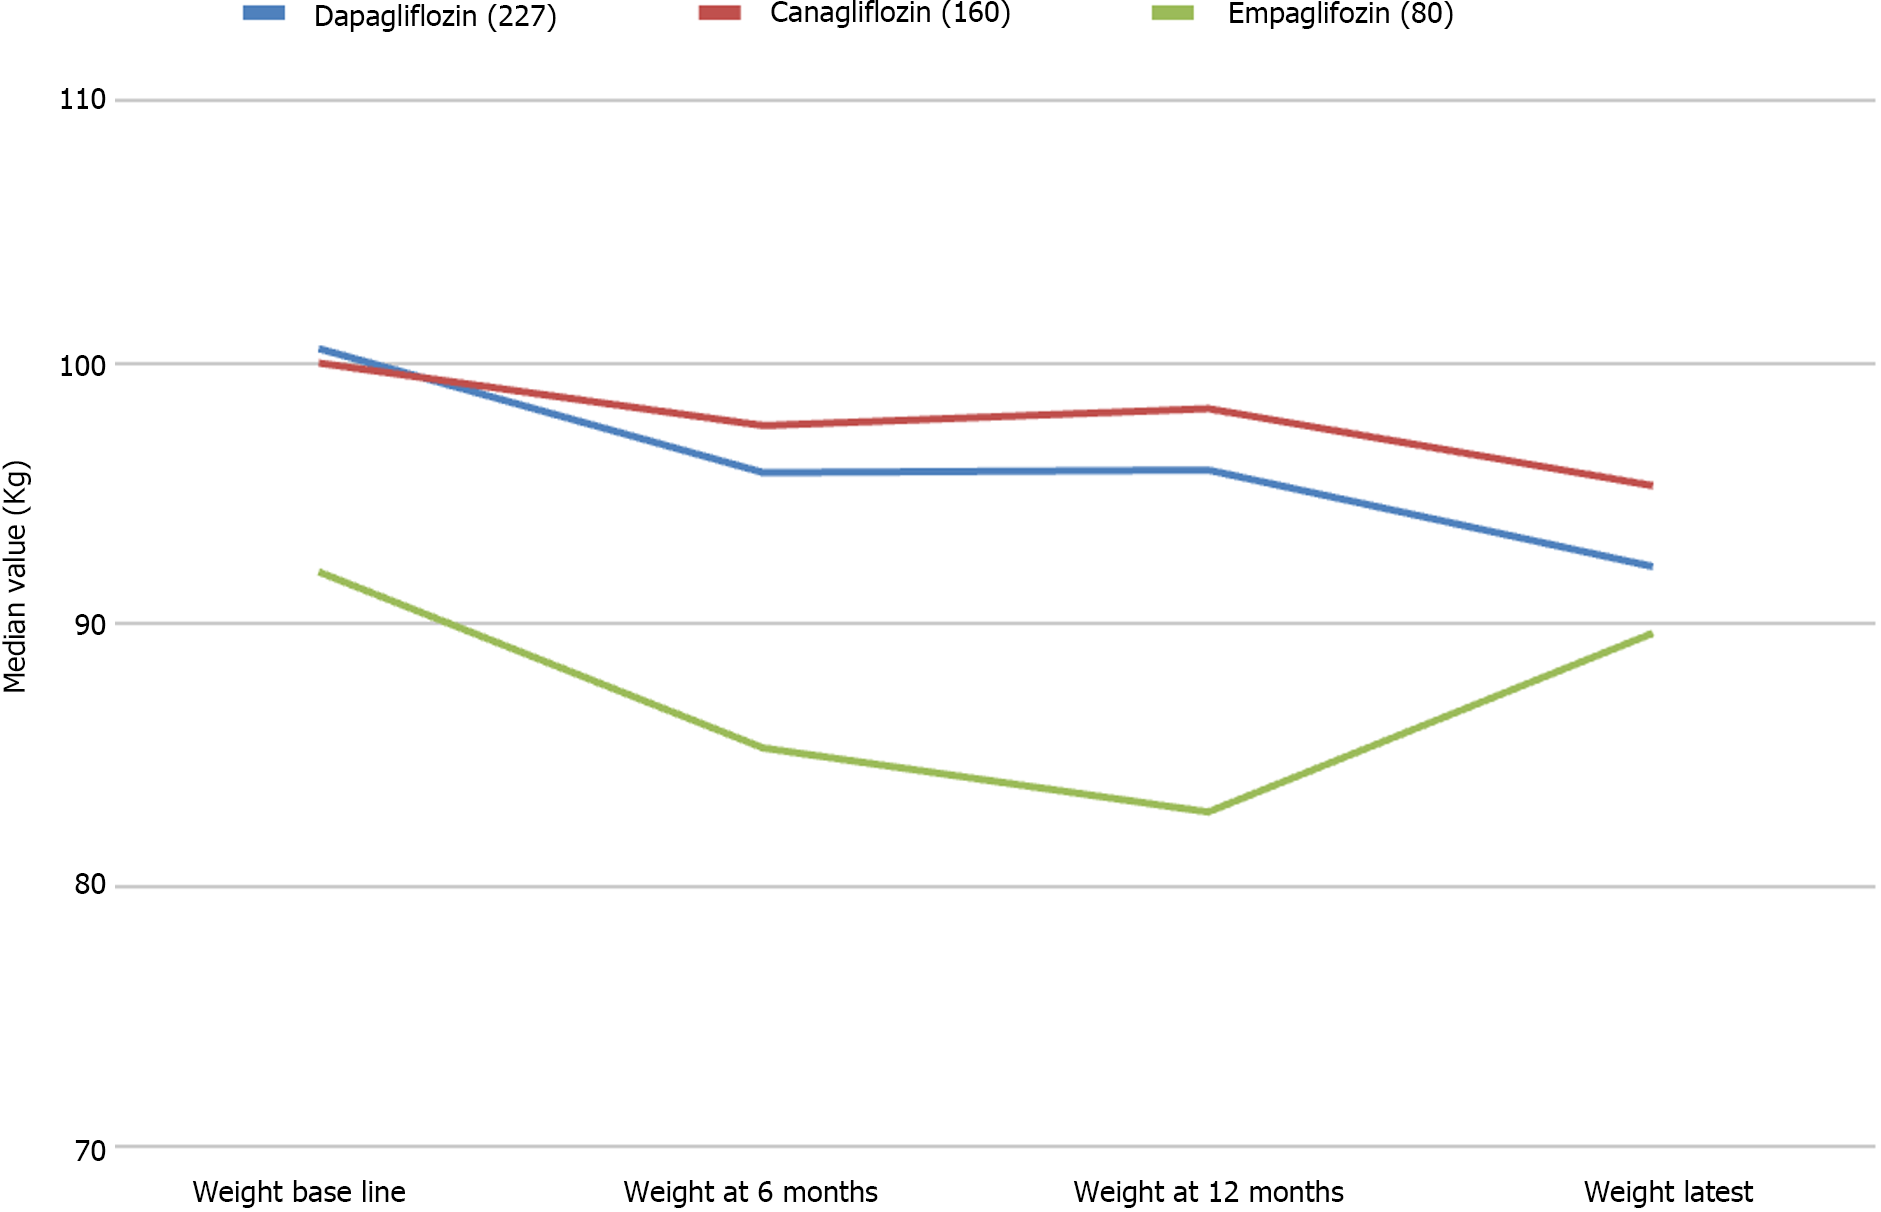
Figure 2 Weight changes, from baseline to latest follow up period with dapagliflozin, canagliflozin, and empagliflozin.
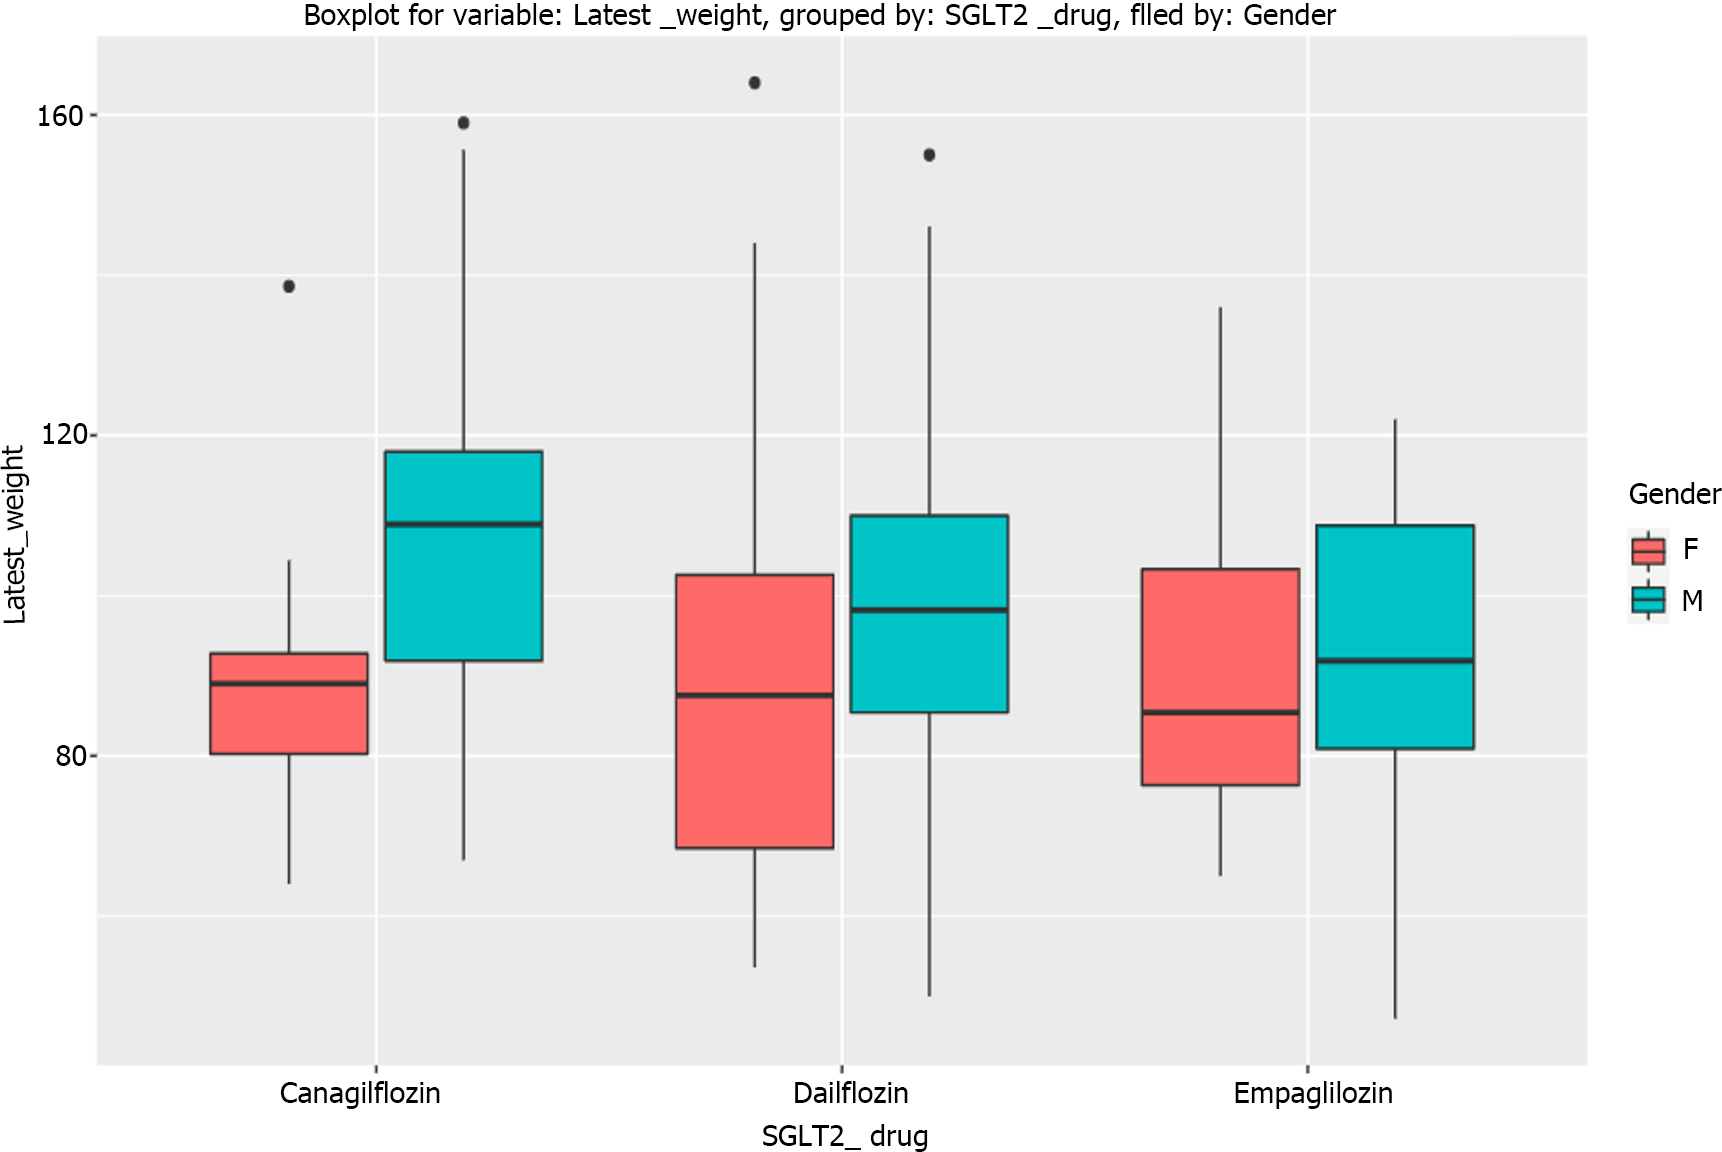
Figure 3 Boxplots showing latest weight, with dapagliflozin, canagliflozin, and empagliflozin in male and female patients.
SGLT2: Sodium glucose cotransporter 2; F: Female; M: Male.
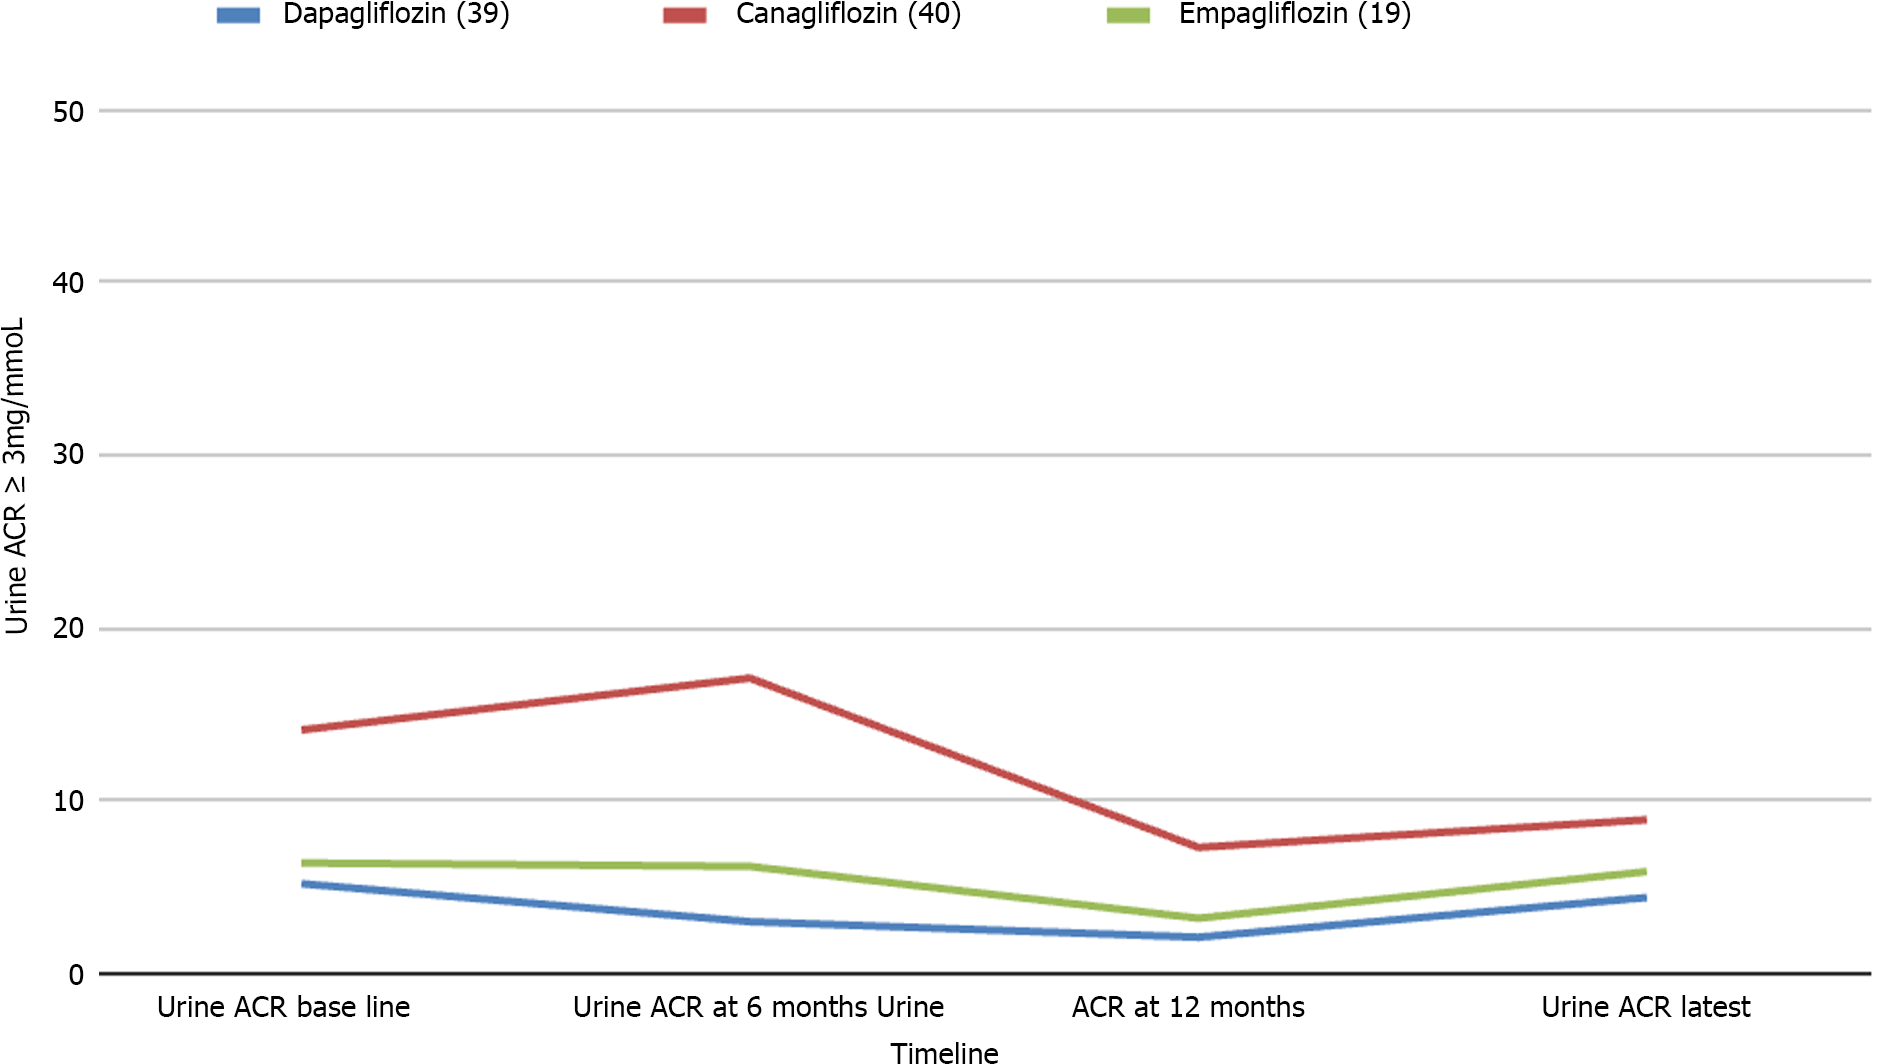
Figure 4 Trends in the urine albumin creatinine ratio among patients with baseline microalbuminuria (urine albumin creatinine ratio ≥ 3 mg/mmol).
ACR: Albumin creatinine ratio.
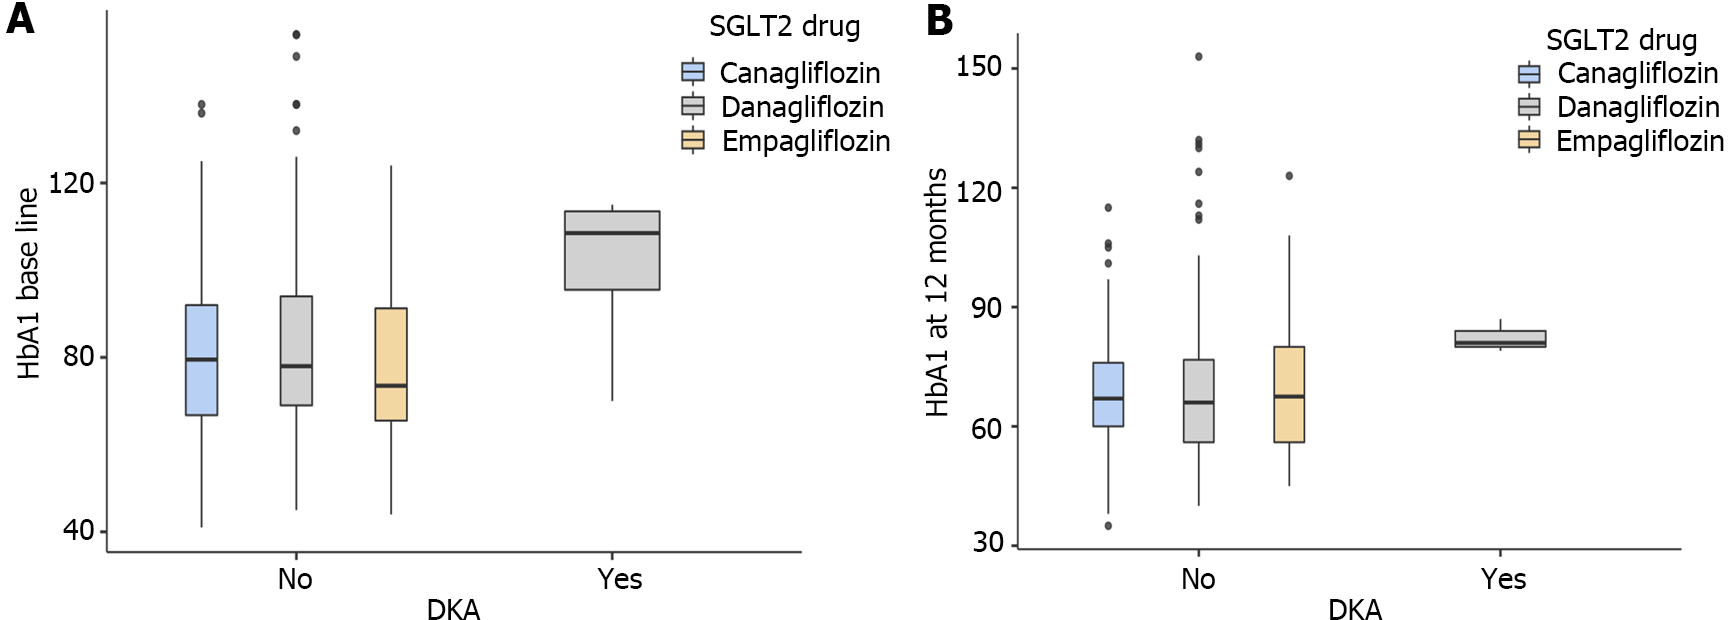
Figure 5 Boxplot analyses of baseline glycated hemoglobin vs diabetic ketoacidosis risk in individual sodium glucose cotransporter 2 inhibitor drugs at baseline and after 12 months.
A: Box plot explanatory data analysis of baseline glycated hemoglobin (HbA1c) as a risk factor for diabetic ketoacidosis (DKA) with individual sodium glucose cotransporter 2 inhibitor (SGLT2i) drug showing a correlation between the two variables; B: Box plot data analysis of HbA1c level at 12 months as a risk factor for DKA with individual SGLT2i drug showing a correlation between the two variables. DKA: Diabetic ketoacidosis; HbA1c: Glycated hemoglobin; SGLT2: Sodium glucose cotransporter 2.
- Citation: Islam L, Jose D, Alkhalifah M, Blaibel D, Chandrabalan V, Pappachan JM. Comparative efficacy of sodium glucose cotransporter-2 inhibitors in the management of type 2 diabetes mellitus: A real-world experience. World J Diabetes 2024; 15(3): 463-474
- URL: https://www.wjgnet.com/1948-9358/full/v15/i3/463.htm
- DOI: https://dx.doi.org/10.4239/wjd.v15.i3.463


